
Ascot Enhances Fan Experience With Total Performance Data’s Infographics
![]()
Friday, October 10, 2025 at 11:08 am |
Back to: Europe, Shared News Europe
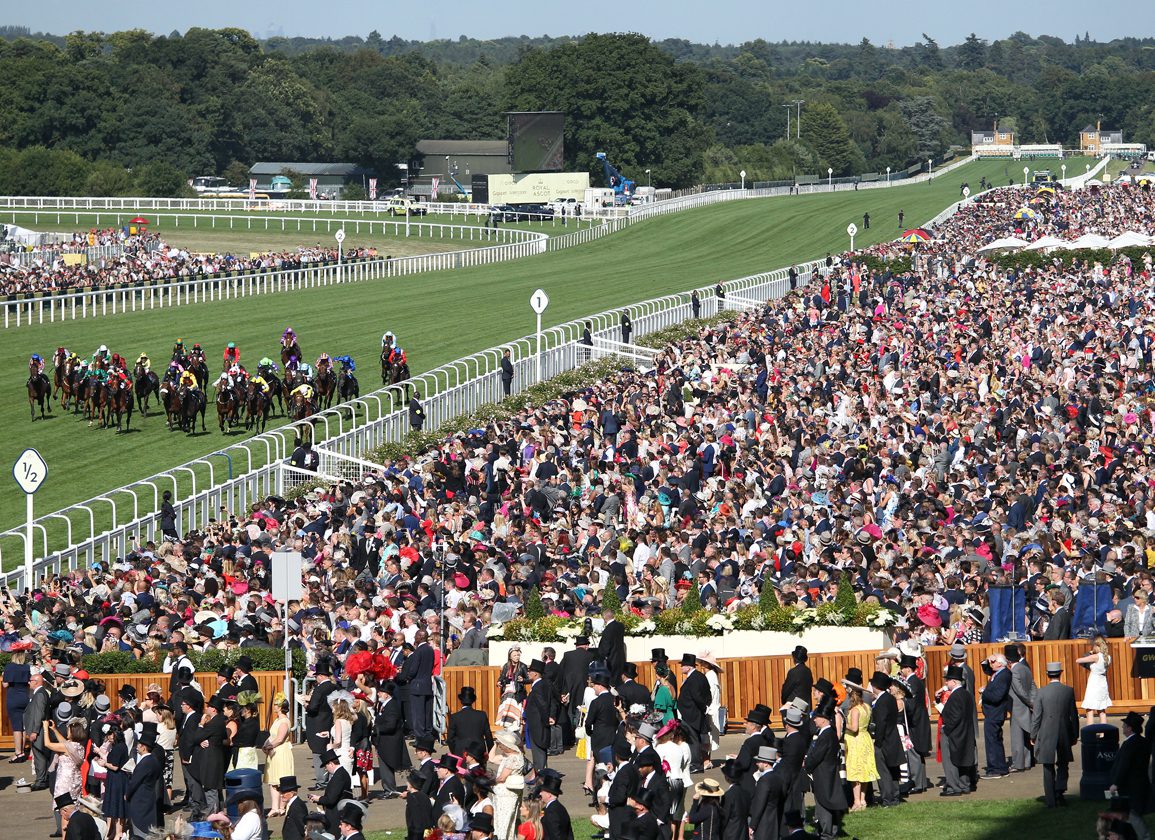
Ascot Racecourse | Horsephotos
The 2025 Ascot fan experience has been enhanced with the introduction of infographics powered by GPS data from Total Performance Data (TPD).
The graphics, already shown post-race at Royal Ascot, are now set to feature throughout the autumn programme at the racecourse and include QIPCO British Champions Day, as well as the upcoming jumps season. Each infographic contains key performance metrics from TPD’s GPS tracking including the time taken for a horse to accelerate from 0-30mph, the top speed achieved during the race, the horse’s speed through the final two furlongs, and the horse’s stride length and frequency.
“We’re delighted to be working with Ascot to showcase the raw athleticism of racehorses in such a compelling way,” said TPD’s director of racing partnerships Adam Moore. “These infographics give fans, owners and trainers a fresh perspective on performance–much like Formula 1 has done for motor racing–and we’re proud to help bring that excitement to British racing’s most iconic stage.”
Not a subscriber? Click here to sign up for the daily PDF or alerts.
Your TDN download has begun.
If the download does not complete, Click Here.

X
Never miss another story from the TDN
Click Here to sign up for a free subscription.