
C-mode measurement
The 2-probe correlation measurements were preceded by local PL spectroscopy over a 9.6 μm × 9.6 μm area at 150-nm spatial intervals in C-mode using a C-probe. This and all subsequent experiments were conducted at room temperature. The PL spectrum at each of the 4,096 obtained points was fitted to a Lorentzian function and the peak emission energies in the spectra were compiled into an energy map of the sample (Fig. 3a). In addition, an integrated intensity map across the full spectral range was generated at each observation point (Fig. 3b).
Fig. 3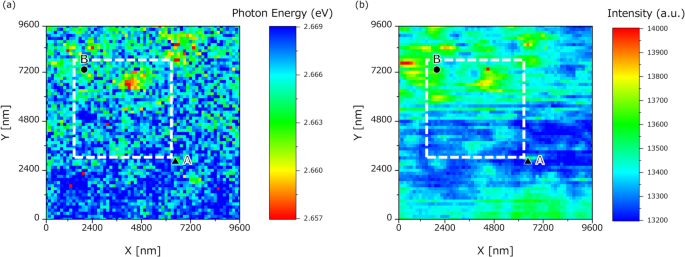
Maps of (a) energy potentials and (b) integral intensities produced in C-mode operation. Two-probe measurements were performed within the square enclosed by the white dashed lines. Excitation and detection were performed at points A (filled upward triangle) and B (filled circle).
These two maps representing the spatial distributions of the energy potentials and integral intensities were derived from the C-mode measurement data. The luminescence intensity was higher at the bottom of the potential regions than in the surrounding hills, suggesting more frequent recombination of the excited carriers in the lower than in the higher potential regions of the semiconductor quantum well. The energy and intensity maps were consistently correlated with the results previously reported in Ref. 3.
Two-probe measurement (normal: A→B)
Based on the energy and intensity distributions obtained from the C-mode measurements, a local excitation point, denoted as point A (filled upward triangle), was selected for 2-probe measurements. In this configuration, the S-probe locally excited the carriers at point A and the C-probe detected the PL resulting from recombination of the carriers diffusing from the excitation point. The C-probe detected the PL spectra over the area enclosed by the white dashed box (4.8 μm × 4.8 μm, 150-nm intervals, 1,024 points) in Fig. 3. Figure 4 shows the integrated intensity distribution map obtained from the 2-probe measurements.
Fig. 4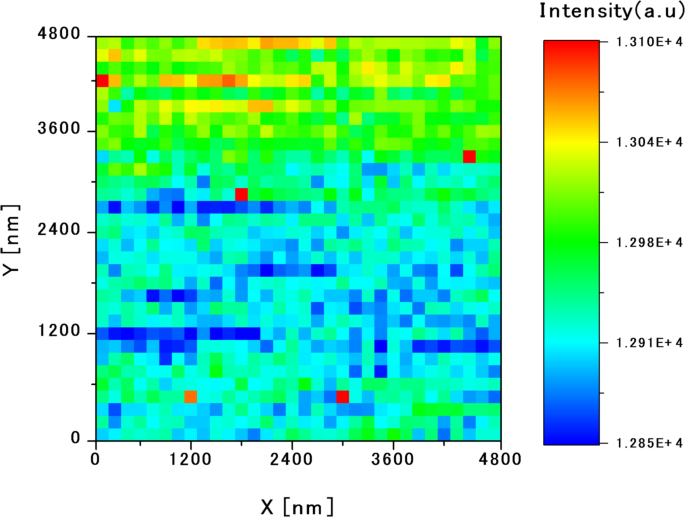
Integral intensity map based on the 2-probe measurements: excited locally at point A and detected by scanning using the S-probe and the C-probe, respectively. The excitation carriers generated at point A diffuse around the potential hill and recombine in the valleys between the hills, even in areas with relatively high energy.
Comparing the 2-probe intensity map (Fig. 4) with the C-mode energy-potential map (Fig. 3a), a higher intensity was observed in regions corresponding to lower potential energies, consistent with the previously observed C-mode intensity map. It appears that the carriers excited at point A reach and recombine in regions with relatively low-energy potentials.
However, the region near point A presents a relatively high-potential energy in the C-mode energy-potential map (Fig. 3a), suggesting that carriers must traverse energy barriers to reach low-energy areas. A more detailed analysis of Fig. 4 reveals a region of moderate luminescence intensity intersecting with a low-intensity region in the lower portion of the map. This region corresponds to an intermediate potential energy between the energy hills in Fig. 3. We suggest that excited carriers diffuse through the narrow paths of intermediate energy or bypass high-potential hills to reach the low-potential sites where recombination is more probable.
Two-probe measurement (reversed: B→A)
To further investigate the carrier-transport dynamics, we swapped the roles of the excitation and detection probes for reversed 2-probe measurements. Based on the energy landscape obtained from the C-mode measurements, a new excitation point B (filled circle) was selected along with the previously used point A (filled upward triangle). In this configuration, the C-probe excited the carriers at point B and the S-probe observed the carrier recombination at point A. Note that this configuration reverses the previous configuration with excitation at point A and detection at point B. In this reversed arrangement, we could evaluate how the potential landscape of the sample influences the full carrier transport pathway encompassing the excitation, diffusion, and recombination processes.
To assess the spectral response at each point, the emission spectra were obtained from the C-mode measurements at points A and B and their corresponding Lorentzian fitting curves (Fig. 5a). The central energy in both spectra was 2.663 eV, which was near the centre of the measured energy range. Under ideal conditions with negligible environmental influences, the spectra should be similar at points A and B. However, the central energy of the spectra obtained in case (I), when excitation and detection were applied at points B and A respectively, slightly differed from that in case (II), when the roles of the probes were reversed (Fig. 5b). It should be noted that the apparent intensity increases on the low-energy side in case (I) and on the high-energy side in case (II) of Fig. 5b arise from residual background.
Fig. 5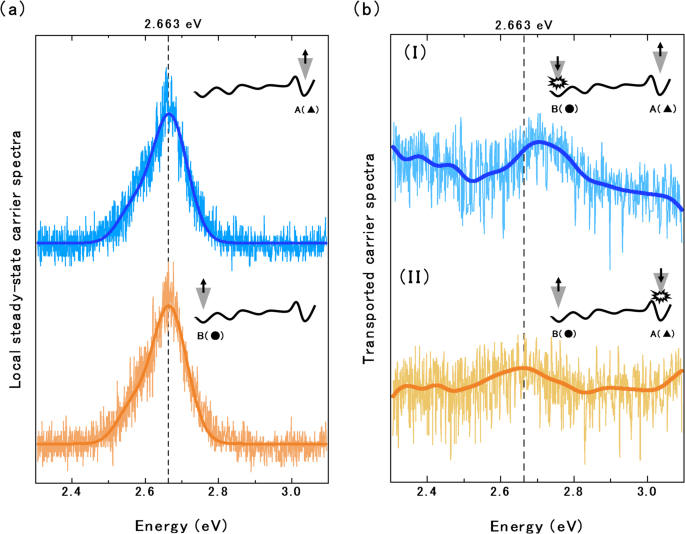
(a) Spectra detected at points A and B in C-mode and their fitting curves (thick lines). Both spectra show a central energy of 2.663 eV corresponding to the maximum intensity of the emission spectrum. (b) Spectra detected by 2-probe measurements and their moving averages (solid lines). Spectrum (I) was detected at point A using the configuration shown in Fig. 2d, and spectrum (II) was detected at point B using the configuration shown in Fig. 2c. The inset schematics show the average energy-potential height between the two points and the situation of excitation or detection by probes.
The insets of Fig. 5 schematically show the average energy-potential height between the two points and the situation of excitation and detection by probes. The excited carriers generated at point A followed a downhill path toward point B. When excitation occurs near the potential hill (e.g., at point A), the excited carriers are expected to acquire sufficient initial energy (momentum) to surmount the energy hill and should retain high energies after some energy loss during diffusion. In contrast, the excited carriers generated at point B must reach the opposite side of the potential hill without being trapped in the surrounding potential valleys to reach point A. When excitation occurs at locations with no surrounding potential hills (e.g., at point B), the carriers lose energy before reaching the distant hills. In such instances, the hills are difficult or impossible to climb and only the high-energy components of the excited carriers can reach point A. Therefore, the peak central energy should be higher in the spectrum obtained at point A than in the spectrum obtained at point B.
In addition, excited carriers that cannot surmount the energy-potential hills either recombine locally or continue to diffuse through the energy landscape. As discussed above, such carriers avoid the energy hills and diffuse along the small valleys between the hills. The diffusion paths are also thought to influence the local density of states observed at the detection site.
Figure 6 shows partial predictions of the possible paths chosen by the excited carriers diffusing between points A and B. The carriers excited at either point are expected to follow multiple diffusion paths. For example, the carriers generated at point B may reach point A by bypassing the potential energy hill and moving toward lower potential regions (Fig. 6a), whereas some carriers generated at point A that avoid immediate trapping in the potential valley may circumvent the energy hill to reach point B (Fig. 6b).
Fig. 6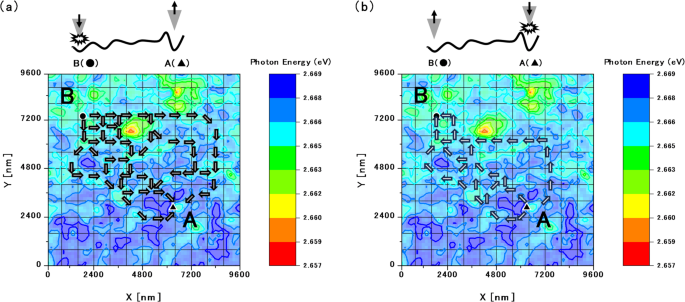
Diagrams predicting the possible diffusion paths of the excited carriers between point A and point B. Shown are the partial predictions of the diffusion paths followed by the excited carriers (a) generated at point B and moving toward A and (b) generated at point A. Multiple possible paths are predicted for the excited carriers generated at either point.
According to these results, multiple excited points at the same energy height on the potential surface exhibit different carrier dynamics that reflect their surrounding energy landscapes. Thus, the final state of the excited carriers is determined not only by the local conditions at the recombination sites but also by the complete transport process (i.e., generation, diffusion, and recombination).
Purely quantum transport should exhibit no directional differences because the probabilistic paths from B→A and A→B are symmetric. In addition, classical transport theory posits that carriers continuously lose energy and cannot overcome potential hills, diminishing the probability of excited carriers reaching distant detection points. However, during mesoscopic transport involving both quantum and classical properties, the higher-energy components of the excited carriers are expected to overcome potential barriers. This hypothesis must be confirmed through further investigations of quantum diffusion in this system. Additional experiments such as low-temperature measurements and detailed analysis would verify the quantum behaviour in the system. Nevertheless, the present results are sufficient to inspire theoretical studies in the mesoscopic region. In practice, at room temperature, thermal and quantum effects coexist at the mesoscopic scale, making their precise separation both experimentally and theoretically challenging. Our approach is characterised by measuring these inseparable effects collectively and basing our discussion on the resulting data. We respectfully note that, in the present discussion of the measurement results, the influence of V-defects22 and the quantum-confined Stark effect23 has not been treated separately. This is because the measurements were performed over a region larger than the scale at which such effects are typically significant, and thus, the results inherently comprehensively incorporate their influence. We acknowledge, however, that a more detailed separation of these effects would be valuable, and we consider this an important direction for future work. A detailed theoretical separation and interpretation remain challenges for future work.