
The temporal coupled mode theory (TCMT) is a valuable tool for describing the underlying physics of such open systems37, including near-field and far-field coupling between modes. First, we will theoretically show that BICs and EPs can simultaneously exist when at least two modes are present in an open system. For a simple two-mode model, the effective Hamiltonian is:
$${H}_{{\rm{eff}}}=\left(\begin{array}{cc}{\omega }_{1} & \kappa \\ \kappa & {\omega }_{2}\end{array}\right)-i\left(\begin{array}{cc}{\gamma }_{1} & {\gamma }_{12}\\ {\gamma }_{21} & {\gamma }_{2}\end{array}\right)$$
(1)
The first term on the righthand is a lossless Hamiltonian with resonant frequencies ω1,2 of the modes and near-field coupling between the two modes κ, while the other term represents the non-Hermitian component that includes losses γ1,2 and the off-diagonal terms (γ12 and γ21) correspond to the far-field coupling associated with each mode. If the system satisfies symmetry, \({\gamma }_{12}={\gamma }_{21}=\sqrt{{\gamma }_{1}{\gamma }_{2}}\). By solving the eigenvalues of the matrix H, we can obtain the complex eigenfrequencies:
$${{\omega }_{{\rm{eig}}}}_{1,2}=\frac{({\omega }_{1}+{\omega }_{2})-i({\gamma }_{1}+{\gamma }_{2})\pm \sqrt{{\left[({\omega }_{1}-{\omega }_{2})-i({\gamma }_{1}-{\gamma }_{2})\right]}^{2}+4{(\kappa -i\sqrt{{\gamma }_{1}{\gamma }_{2}})}^{2}}}{2}$$
(2)
Under the FW-BIC condition \(\kappa ({\gamma }_{1}-{\gamma }_{2})=\sqrt{{\gamma }_{1}{\gamma }_{2}}({\omega }_{1}-{\omega }_{2})\), one of the eigenfrequencies ωeig1 will be real, and the other one ωeig2 remains complex with a significantly large imaginary part. The detailed derivation is in Section 1 of the supplementary material. The positions of these eigenvalues and the gap between them depend on the sign and magnitude of the near-field coupling coefficient κ. Specifically, when κ = 0, the energy bands of the BIC and the lossy mode coalesce, i.e., Re(ωeig1) = Re(ωeig2) and Im(ωeig1) + Im(ωeig2) = Im(ωeig2) > 0. Further, the system can meet the EP conditions by tuning the losses of the eigenmodes, which is analogous to the experimental observation where the leakage of the BIC results in a quasi-BIC with a finite lifetime.
In momentum space, the Q factor of BIC is typically inversely proportional to the square of the transverse momentum (k), meaning the loss is proportional to k2, i.e.,\(\rm Im({\omega }_{{{\rm{eig1}}}})\propto {{\boldsymbol{k}}}^{2}\). This indicates that by altering k, the mode loss can be tuned. And when the BIC mode is at k = 0, i.e., at the center of the first Brillouin zone (the Γ point of FBZ), increasing the k leads to a symmetry mismatch, causing the BIC to transition into an observable quasi-BIC with a high Q factor. At the same time, assuming that the total loss caused by the interference of the two modes forming the FW-BIC remains constant, the losses of the two modes can coincide at a specific transverse momentum, and their imaginary parts of the characteristic frequencies become equal, i.e., Im(ωeig1) = Im(ωeig2). As a result, the two modes coalesce into an EP with common features.
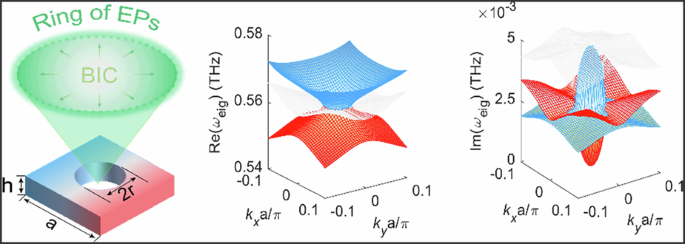
To validate our theoretical descriptions, we designed a silicon-based terahertz metasurface enabling the transition process from BIC to EP as shown in Fig. 1a. The structural unit is composed of a low-loss perforated free-standing silicon slab with a radius of air holes r = 70.4 μm, arranged in a square lattice with a period of a = 230 μm. The silicon slab has a thickness of h = 120 μm. Because of the highly resistive silicon, extremely low material (non-radiative) loss rates can be achieved. Additionally, the advantage of operating at the terahertz region lies in the ability to modify the carrier density in silicon through optical doping, a process as we will demonstrate later, which facilitates the switching of the EP state. The coupling of modes is influenced by the structural parameters, and to illustrate this, we have selected the radius as a key parameter, with detailed results presented in Supplementary Fig. S1. Figure 1b, c shows the real and imaginary parts of the transverse electric (TE) like eigenmodes in k space for the designed metasurface structure. The three colors represent three modes, with the white indicating an orthogonal mode that is disregarded. Our focus is on the red and blue dispersion curves, denoted TE1 and TE2, which correspond to the two modes forming the FW-BIC. At the Γ point, the real parts of the two eigenvalues are degenerate. While one imaginary part close to zero indicates that it is a non-radiating state, i.e., BIC, the other has a larger loss, i.e. a lossy mode. As k gradually moves away from the Γ point to a critical value, the real and imaginary parts of the eigenmodes in each k direction simultaneously degenerate, resulting in the emergence of a closed contour. This transition facilitates the evolution of the non-Hermitian system from a single BIC to a two-dimensional exceptional ring. The detailed dispersion curves of the two modes in the two-dimensional k direction are shown in Fig. 2b. Two EPs in the k directions from Γ to X and M gradually divide the dispersion into two regions. Within the exceptional ring (−0.023π/a < k < 0.023π/a), the real parts of the eigenfrequencies Re(ωeig) are non-dispersive and degenerate, while outside the ring (−0.023π/a > k and k > 0.023π/a), they are dispersive and non-degenerate. The situations for the imaginary parts Im(ωeig) are exactly opposite. From the PT symmetry perspective, k inside the EPs indicates that the system is in a symmetry-broken phase, as opposed to those outside indicating a symmetric phase. The entire process is consistent with our previous TCMT analysis as shown in Supplementary Fig. S2 in the Supplementary Material. The band structure near the EP exhibits square root branching behavior, attributed to the consideration of non-Hermitian conditions such as open boundaries. The change in normal magnetic field distribution of the two modes from the Γ point (BIC) to the off-Γ bifurcation point (EP) reflects the gradual coalescence of the eigenstates. In addition, we also calculated the Q factors of both modes in the FBZ and far-field polarization of BIC mode as shown in Fig. 2c, d. The Q factor is defined by Q = Re(ωeig)/2Im(ωeig). It is noteworthy that the Q factor of the TE1 mode reaches its maximum value at the center of the FBZ, ideally approaching infinity, while the Q factor of the TE2 mode exhibits a minimum value. Interestingly, both modes show abrupt changes at the boundary of the exceptional ring resulting from the combined merits of two topological singularities—namely, the high Q nature of the BICs and the non-Hermitian sensitivity of the EPs, as also illustrated in Supplementary Fig. S3 of the supplementary material. A winding behavior of far-field polarization can also be observed at the center of the FBZ, forming a polarization vortex. By calculating the number of windings of the polarization vector in the counterclockwise direction, the topological charge can be easily determined. The definition of the topological charge is as follows38,39:
$$q=\frac{1}{2\pi }{\oint }_{c}{dk}{\nabla }_{{\boldsymbol{k}}}\varphi ({\boldsymbol{k}})$$
(3)
where c represents a closed path in the k-space, oriented in an anti-clockwise direction around the BICs, and φ(k) denotes the angle between the polarization major axis and the x-axis. In our case, the BICs are all topologically protected by the same topological charge of +1, which is an important property of the topological nature of the BICs.
Fig. 1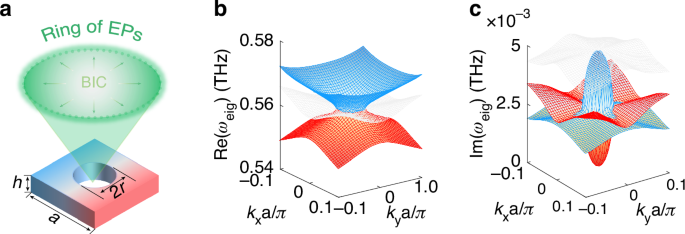
Transition from one bound singularity to a two-dimensional exceptional ring. a Schematic of the transition of one BIC point to an exceptional ring in a designed unit cell. Structural parameters: period a = 230 μm, hole radius r = 70.4 μm, thickness h = 120 μm. b The real parts of the calculated TE-like eigenmodes in k-spaces. c The imaginary parts of the calculated TE-like eigenmodes in k-spaces. The red surface represents the TE1 mode, while the blue surface corresponds to the TE2 mode
Fig. 2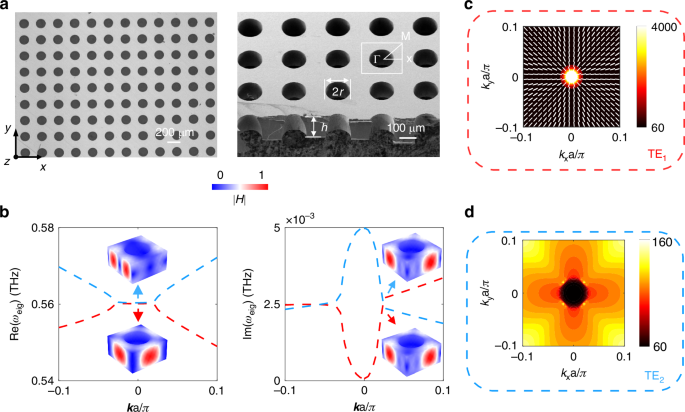
EP and FW-BIC were observed in the calculated TE-like band structure. a Left: Optical microscope image of the prepared sample supporting the transition from FW-BIC to EP. Right: SEM image of the cross-section of the sample. b Detailed views of the real and imaginary parts of the two discussed eigenmodes are provided. The insets depict the normal magnetic field distributions of the two modes at the Γ point (BIC) and away off- Γ point (EP). c, d The calculated Q factors of the TE1 and TE2 mode, with the white ellipse indicating the far-field polarization around the BIC
To experimentally demonstrate the theoretical and simulation findings, we patterned the structure on a thin (120 μm) and high-resistivity (1000 Ω∙cm) silicon wafer using standard photolithography and deep reactive ion etching processes. The left side of Fig. 2a presents the optical microscope image of the large-area sample, while the right side illustrates the scanning electron microscope (SEM) cross-sectional image of the sample, providing a detailed view of our fabricated sample. Since the designed FW-BIC is located at the Γ point, it can also be considered as a symmetry-protected BIC. The wave vector of the incident wave exhibits a sinusoidal relationship with the k, and the transition from BIC to quasi-BIC can be observed by varying the incident angle for mode matching. A Terahertz time-domain spectroscopic system (THz-TDS) with a spectral resolution of about 1 GHz, is used for the characterization of the fabricated large-area metasurfaces. A stepper motor was installed on the transmitting and receiving antennas to adjust the incident angle of the THz waves with an angular resolution of 0.1°, ranging from 0 to 6.7°. This setup allows for the characterization of angle-resolved transmission spectra along the Γ-Χ direction. Detailed sample preparation and testing procedures can be found in the Methods. Figure 3a illustrates the measured transmission spectra as a function of the incident angle, alongside the extracted transmission profiles at marked incident angles of 0°, 1.5°, and 5°, corresponding to BIC, EP, and more lossy quasi-BIC, respectively. These results show excellent agreement with the numerical simulations presented in Fig. 3b. At normal incidence, near 0.56 THz, destructive interference between the two modes results in a transmission close to 0.98. As the incident angle increases, a distinct spectral splitting can be observed, attributed to the oblique incident wave vector processing an in-plane wave vector component that couples with the continuum, causing BIC mode leakage. Isolated quasi-BICs can also be observed at frequency points of 0.47 THz and 0.67 THz, but these are beyond the scope of this work. It is worth noting that the transmission peaks and dips only reflect the Hermitian part of the Hamiltonian matrix, which is typically damped by losses and therefore does not correspond to the eigenfrequency points. The eigenfrequency points we discuss correspond to the poles of the S-matrix. The spectral line at the EP typically resembles a line shape of electromagnetic-induced transparency (EIT)20. Repeating the fitting process for transmission spectra measured at different angles yields two modes’ complex eigenfrequencies. Figure 3c shows the calculated and fitted quality factors. Due to material losses, the experimentally measured maximum Q factor is approximately 2000 (compared to the simulated value of 3997), which is of the same order of magnitude as the highest Q factor measurable in the THz regime22. At the EP, a sudden drop in the Q factor to 106 is observed, after which it stabilizes. In the supplementary materials, we provide a comparative analysis excluding material losses, showing that even a slight loss can significantly reduce the Q factor at the BIC. In Fig. 3d, we plot the relationship of the complex frequencies of the two modes, showing that their positions tend to converge at the EP.
Fig. 3
Experimental demonstration of the transition process from FW-BIC to EP. Left: the color maps show the measured (a) and simulated (b) transmission spectra as a function of the incident terahertz angle. Right: the extracted transmission spectra at angles of 0°, 1.5°, and 5° are detailed, corresponding to FW-BIC, EP, and a more quasi-BIC, respectively. c The variation of the calculated Q factor with the incident angle. d The real and imaginary parts of the eigenfrequency exhibit a trend of approaching each other near the EP
After describing the transmission characteristics of BICs transitioning to EPs with varying incident angles, we further demonstrated the active switching capability of EP through optical pumping. Specifically, we maintained the incident angle of the THz wave at θ = 1.5° and used a 980-nm continuous-wave laser to optically pump the silicon sample, thereby increasing the loss of the silicon through photogenerated carriers. The schematic diagram of the experimental setup is shown in Fig. 4a. Figure 4b provides a clear comparison between the experimental and simulated transmission spectra. The carrier concentration for simulations is calculated based on the given pump power as detailed in Section 6 of the Supplementary Material. With an optical pump power changing from 0 mW (dark blue curve) to 500 mW (dark red curve), the corresponding optically doped carrier density increases from 1 × 1013 cm−3 to 7 × 1014 cm−3. Consequently, the strong damping caused by the photoinduced free carriers disrupts the high Q factor sustained in the silicon resonators. As the pump power increases further, a substantial number of photocarriers dominate the decay process, leading to a broadening of the resonant modes. This indicates that the high Q EP state of the system is disturbed. To provide a more intuitive description of the pumping modulation, we define the transmission difference, Δt, as the difference between the maximum and minimum transmission at a relatively lower frequency near 0.56 THz, i.e., Δt = tmax − tmin. Figure 4c shows the variation of Δt under different pump powers. The change in Δt from 0.79 to 0.38 indicates a modulation depth of about 52%. Furthermore, through numerical simulations and data fitting, we plotted the Q factor and the difference in the imaginary part of the eigenfrequency as functions of carrier concentration. It was found that the external optical pump primarily introduces losses as previously mentioned, which break the mode’s degeneracy of the system. The carrier concentration required for the optical pump modulation of our BIC-derived EP is an order of magnitude lower than that required when only considering the quasi-BIC21.
Fig. 4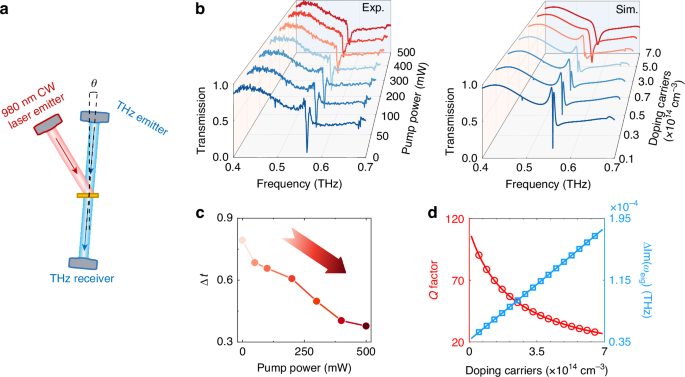
Results of the optical pumping experiment at the EP. a Schematic diagram of the experimental setup. b Left: experimental data demonstrating the pumping process through changes in pump power, right: simulated data demonstrating the pumping process through changes in carrier concentration. c Dependence between transmission difference Δt and pump power. d Variation of the Q factor and the degree of nondegeneration of the imaginary part of the two modes with carrier concentration
Another significant feature of the EP is that a 2π-phase accumulation can be achieved when encircling its parameter space, providing more options for wavefront control40,41,42. At 0.56 THz, the simulated transmission without laser pumping in Fig. 5b shows that the metasurface with the smallest radius of 64.0 μm, achieves a phase of −119.0°, while the unit with the largest radius of 71.7 μm, reaches a phase of 150.1°, resulting in a total phase coverage of 269.1° and with all units maintaining an amplitude above 0.65, these combined features confirm the system’s capability for implementing effective 2-bit beam steering. After pumping shown in Fig. 5c, however, the phase coverage narrows to 65° with an average amplitude of just 0.32, making effective wavefront manipulation unattainable. According to the simplified generalized Snell’s law: \(\sin {\theta }_{{\rm{def}}}=\frac{\lambda }{2\pi }d\varphi /{dx}\), where θdef is the theoretical deflection angle, λ is the operating wavelength, and dφ/dx is the phase gradient between adjacent structural units. Thus, we can obtain the theoretical deflection angle is about 35.6°. We performed beam deflection experiments using the setup shown in Fig. 5a. A THz beam was incident at 1.5° onto the EP phase gradient metasurface, with the transmitted THz signals collected by a receiving antenna scanning the angle behind the metasurface. As shown in Fig. 5c, a signal at 0.56 THz was detected at a deflection angle of 35.6°, demonstrating excellent agreement with theoretical predictions. However, as shown in Fig. 5d, after optical pumping with a power of 500 mW, the deflected THz signal was reduced to 33.74% of its level before pumping, indicating that the system was no longer in the EP state. The switching speed is primarily determined by the carrier lifetime in bulk silicon, which is ~25 μs under our experimental conditions43. In addition, much faster modulation speeds can be achieved through material optimization. For example, by employing defect engineering or using radiation-damaged silicon or other semiconductor substrates with engineered recombination dynamics, carrier lifetimes as short as sub-picosecond can be realized. Our experiments have demonstrated that the structure, designed around the EP, not only functions as a beam deflector on gradient metasurfaces with varying radii, but also highlights its potential as an optical switch leveraging the phase mechanism associated with the EP.
Fig. 5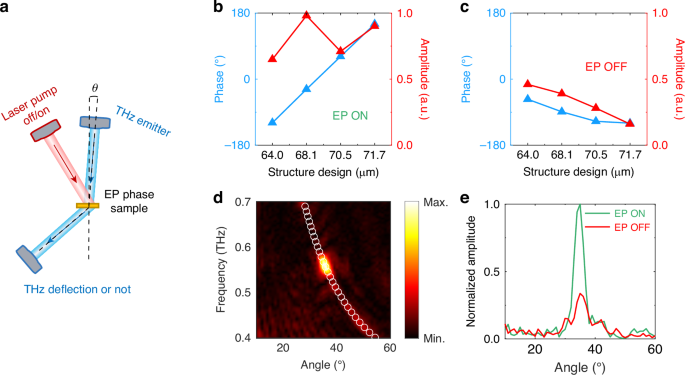
Switch based on EP as a phase singularity. a Schematic diagram of the experimental setup for THz beam deflection. b, c Amplitude and phase diagrams for the structural units with four radius parameters before and after the pump (carrier concentration is 7 × 1014 cm−3, corresponding to the pump power of 500 mW) at the EP point. d Experimental measurements of the beam deflection result, with white circles indicating theoretical predictions. e Normalized THz signal amplitude results at different angles; green line represents before the pump (EP on), and red line represents after the pump (EP off)