

The Government weighs children in reception and then again in Year Six – here’s a full breakdown of the figures Around one in seven children in Stoke-on-Trent are already obese by the time they start primary school. T
More than one in seven children in Stoke-on-Trent are already obese by the time they start primary school. The city has the second highest number of obese youngsters in reception out of every local authority area in England.
It is estimated that 15.1 per cent of boys and girls were obese in the Potteries at the start of the 2024/5 academic year, only behind Halton in Runcorn. This compares to a national average of 10.5 per cent.
And by Year Six one in four children (27.5 per cent) in Stoke-on-Trent are obese compared to the England average of 22.2 per cent.
The figures have been published as part of the Government’s National Child Measurement Programme, which covers mainstream state-maintained schools. Children in reception are aged four to five, while children in Year 6 are aged 10 to 11.
The data has been compiled by the postcode address of the child, not the postcode address of their school.
NHS England has branded the figures “extremely concerning” and warned of a “devastating impact on children’s health”. Some 1.1 million children were measured at state-maintained schools as part of the data collection.
Professor Simon Kenny, NHS England’s Clinical Director for Children and Young People, said: “These figures are extremely concerning. Obesity can have a devastating impact on children’s health, increasing their risk of type 2 diabetes, cancer, mental health issues, and many other illnesses, which can sadly lead to shorter and unhappier lives.
“The NHS is transforming the lives of thousands of children and families impacted by severe weight issues through its specialist clinics, supporting them to lose weight, live healthier lives and improve their mental health through a personalised package of support.
“However prevention is key and continued joined-up action by industry and wider society is essential if we want to improve the health of our younger generations.”
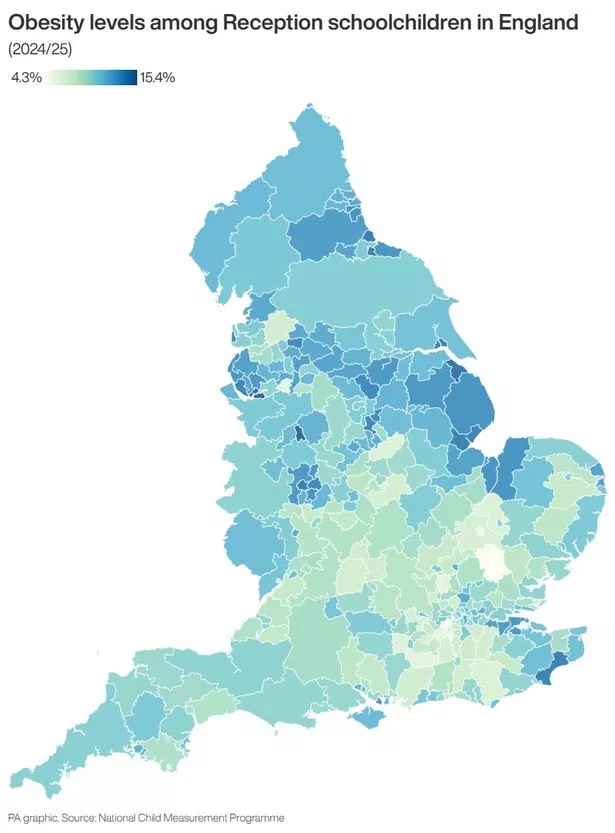 Obesity levels among Reception children in local areas of England. Infographic from PA Graphics. See story HEALTH Obesity. An editable version is available: please contact graphics@pamediagroup.com. Embed code for interactive version:
Katharine Jenner, executive director of the Obesity Health Alliance, said the data was a “stark reminder that poor child health remains a serious issue across England”, particularly among children living in the most deprived areas and those of black African heritage.
“Every child deserves the chance to grow up healthy, regardless of their background,” she added.
“The findings suggest that the recent small reductions in obesity among Reception-age children were short-lived, with this year’s figures showing one of the highest obesity rates recorded since the programme began.
“These concerning trends are at odds with the Government’s ambition to create the healthiest generation of children ever.”
Health and Social Care Secretary Wes Streeting said: “This government will not look away as kids get unhealthier and critics urge us to leave them behind.
“Obesity robs children of the best possible start in life, sets them up for a lifetime of health problems, and costs the NHS billions.
“Today’s figures show the extent of the problem and the need to act now, which is exactly what we’re doing – in schools, on sports pitches, and online – to make healthy choices the easy choices, support families, and turn the tide on childhood obesity.
“This is prevention, not punishment, and will help families and children across the country.”
The two lists are ordered by prevalence of obesity, starting with the highest, and reads, from left to right: local authority area; region of England (in brackets); proportion of schoolchildren estimated to be obese in the academic year 2024/25.
Reception:
Halton (NW England) 15.4%
Stoke-on-Trent (West Midlands) 15.1%
North East Lincolnshire (Yorkshire/Humber) 14.6%
Wolverhampton (West Midlands) 14.4%
Middlesbrough (NE England) 14.3%
Hartlepool (NE England) 14.3%
Hull (Yorkshire/Humber) 14.2%
Folkestone & Hythe (SE England) 14.1%
Boston (East Midlands) 14.0%
Liverpool (NW England) 13.9%
Ashfield (East Midlands) 13.9%
Walsall (West Midlands) 13.8%
Blackpool (NW England) 13.7%
Burnley (NW England) 13.7%
Mansfield (East Midlands) 13.7%
Rotherham (Yorkshire/Humber) 13.6%
Gosport (SE England) 13.4%
Sunderland (NE England) 13.3%
East Lindsey (East Midlands) 13.3%
Sandwell (West Midlands) 13.3%
King’s Lynn & West Norfolk (Eastern England) 13.2%
Redcar & Cleveland (NE England) 13.2%
Sefton (NW England) 13.2%
West Lindsey (East Midlands) 13.1%
St Helens (NW England) 13.1%
Medway (SE England) 13.1%
Doncaster (Yorkshire/Humber) 13.0%
South Staffordshire (West Midlands) 13.0%
Gravesham (SE England) 12.9%
County Durham (NE England) 12.8%
Rochdale (NW England) 12.7%
South Holland (East Midlands) 12.6%
West Lancashire (NW England) 12.6%
Dartford (SE England) 12.6%
Great Yarmouth (Eastern England) 12.6%
Barnsley (Yorkshire/Humber) 12.5%
Darlington (NE England) 12.5%
Kirklees (Yorkshire/Humber) 12.5%
Manchester (NW England) 12.5%
Knowsley (NW England) 12.5%
Derby (East Midlands) 12.4%
Lancaster (NW England) 12.4%
Calderdale (Yorkshire/Humber) 12.3%
Pendle (NW England) 12.3%
Enfield (London) 12.2%
South Tyneside (NE England) 12.2%
Salford (NW England) 12.2%
Rossendale (NW England) 12.2%
Bradford (Yorkshire/Humber) 12.2%
Nottingham (East Midlands) 12.1%
Barking & Dagenham (London) 12.1%
Southwark (London) 12.1%
Worcester (West Midlands) 12.1%
North Tyneside (NE England) 12.1%
Broxtowe (East Midlands) 12.0%
Lincoln (East Midlands) 12.0%
Staffordshire Moorlands (West Midlands) 11.9%
Stevenage (Eastern England) 11.9%
Dudley (West Midlands) 11.9%
Newcastle upon Tyne (NE England) 11.9%
Wakefield (Yorkshire/Humber) 11.9%
Wigan (NW England) 11.8%
Plymouth (SW England) 11.8%
Bassetlaw (East Midlands) 11.8%
Southampton (SE England) 11.8%
Wirral (NW England) 11.7%
Tameside (NW England) 11.7%
Gateshead (NE England) 11.7%
North Kesteven (East Midlands) 11.7%
Bolton (NW England) 11.7%
Hackney (London) 11.6%
Birmingham (West Midlands) 11.6%
Sheffield (Yorkshire/Humber) 11.6%
Erewash (East Midlands) 11.6%
Newcastle-under-Lyme (West Midlands) 11.5%
Isle of Wight (SE England) 11.5%
Cumberland (NW England) 11.5%
North Lincolnshire (Yorkshire/Humber) 11.4%
Nuneaton & Bedworth (West Midlands) 11.4%
Newark & Sherwood (East Midlands) 11.4%
Telford & Wrekin (West Midlands) 11.3%
Northumberland (NE England) 11.3%
Herefordshire (West Midlands) 11.3%
Portsmouth (SE England) 11.3%
Ashford (SE England) 11.3%
Eastbourne (SE England) 11.3%
Peterborough (Eastern England) 11.3%
Slough (SE England) 11.2%
Dover (SE England) 11.2%
South Derbyshire (East Midlands) 11.2%
Southend- on -Sea (Eastern England) 11.2%
Gloucester (SW England) 11.2%
Broxbourne (Eastern England) 11.1%
Newham (London) 11.1%
Greenwich (London) 11.1%
East Riding of Yorkshire (Yorkshire/Humber) 11.1%
Swale (SE England) 11.1%
Breckland (Eastern England) 11.1%
Thanet (SE England) 11.0%
Leeds (Yorkshire/Humber) 11.0%
Torbay (SW England) 11.0%
Swindon (SW England) 11.0%
Castle Point (Eastern England) 11.0%
Forest of Dean (SW England) 11.0%
Arun (SE England) 10.9%
Ipswich (Eastern England) 10.9%
Hounslow (London) 10.9%
Bolsover (East Midlands) 10.8%
Westminster (London) 10.8%
Westmorland & Furness (NW England) 10.8%
Cheshire East (NW England) 10.8%
Coventry (West Midlands) 10.7%
Cheshire West & Chester (NW England) 10.7%
East Suffolk (Eastern England) 10.7%
Hastings (SE England) 10.7%
Hyndburn (NW England) 10.7%
Stafford (West Midlands) 10.7%
West Devon (SW England) 10.7%
West Berkshire (SE England) 10.6%
Croydon (London) 10.6%
Reading (SE England) 10.6%
Stockton- on -Tees (NE England) 10.6%
Tamworth (West Midlands) 10.6%
Luton (Eastern England) 10.6%
Kensington & Chelsea (London) 10.6%
Bury (NW England) 10.6%
Wyre (NW England) 10.6%
Haringey (London) 10.6%
Norwich (Eastern England) 10.5%
South Kesteven (East Midlands) 10.5%
Tower Hamlets (London) 10.5%
North Northamptonshire (East Midlands) 10.5%
Malvern Hills (West Midlands) 10.5%
Harlow (Eastern England) 10.5%
Rushmoor (SE England) 10.5%
North East Derbyshire (East Midlands) 10.5%
North Warwickshire (West Midlands) 10.4%
Islington (London) 10.4%
North Yorkshire (Yorkshire/Humber) 10.4%
Chesterfield (East Midlands) 10.4%
North Norfolk (Eastern England) 10.3%
Thurrock (Eastern England) 10.3%
Havering (London) 10.3%
Maidstone (SE England) 10.3%
Cornwall (SW England) 10.3%
Fylde (NW England) 10.3%
Oldham (NW England) 10.2%
Lambeth (London) 10.2%
Teignbridge (SW England) 10.2%
Preston (NW England) 10.1%
Warrington (NW England) 10.1%
Shropshire (West Midlands) 10.1%
Somerset (SW England) 10.1%
Babergh (Eastern England) 10.1%
Worthing (SE England) 10.1%
Lewisham (London) 10.0%
Ealing (London) 10.0%
Maldon (Eastern England) 10.0%
West Suffolk (Eastern England) 9.9%
York (Yorkshire/Humber) 9.9%
Dorset (SW England) 9.9%
Lewes (SE England) 9.9%
Basingstoke & Deane (SE England) 9.9%
Rother (SE England) 9.9%
Bristol (SW England) 9.8%
Blackburn with Darwen (NW England) 9.8%
Tendring (Eastern England) 9.8%
Torridge (SW England) 9.8%
Bexley (London) 9.8%
Fareham (SE England) 9.7%
Waltham Forest (London) 9.7%
Amber Valley (East Midlands) 9.7%
East Hampshire (SE England) 9.7%
Wokingham (SE England) 9.7%
East Staffordshire (West Midlands) 9.7%
Redditch (West Midlands) 9.7%
New Forest (SE England) 9.7%
Basildon (Eastern England) 9.6%
Epping Forest (Eastern England) 9.6%
Leicester (East Midlands) 9.6%
Rutland (East Midlands) 9.6%
Bournemouth, Christchurch & Poole (SW England) 9.6%
Lichfield (West Midlands) 9.6%
North Devon (SW England) 9.6%
Derbyshire Dales (East Midlands) 9.6%
Charnwood (East Midlands) 9.5%
Bracknell Forest (SE England) 9.5%
Crawley (SE England) 9.5%
Vale of White Horse (SE England) 9.5%
Watford (Eastern England) 9.5%
Hillingdon (London) 9.5%
Gedling (East Midlands) 9.4%
Mid Devon (SW England) 9.4%
Melton (East Midlands) 9.4%
Hertsmere (Eastern England) 9.4%
Chorley (NW England) 9.3%
Brighton & Hove (SE England) 9.3%
High Peak (East Midlands) 9.3%
Brent (London) 9.3%
Redbridge (London) 9.3%
Bedford (Eastern England) 9.3%
Fenland (Eastern England) 9.3%
Oxford (SE England) 9.3%
Milton Keynes (SE England) 9.2%
Rochford (Eastern England) 9.2%
Tonbridge & Malling (SE England) 9.2%
Exeter (SW England) 9.1%
Wiltshire (SW England) 9.1%
Camden (London) 9.1%
Canterbury (SE England) 9.1%
Cheltenham (SW England) 9.1%
Tewkesbury (SW England) 9.0%
Huntingdonshire (Eastern England) 9.0%
Welwyn Hatfield (Eastern England) 9.0%
Chelmsford (Eastern England) 9.0%
South Ribble (NW England) 8.9%
Havant (SE England) 8.9%
North West Leicestershire (East Midlands) 8.9%
South Hams (SW England) 8.9%
Rugby (West Midlands) 8.9%
East Devon (SW England) 8.8%
North Somerset (SW England) 8.8%
Stockport (NW England) 8.8%
Colchester (Eastern England) 8.8%
East Hertfordshire (Eastern England) 8.8%
West Northamptonshire (East Midlands) 8.8%
Surrey Heath (SE England) 8.7%
Cotswold (SW England) 8.7%
Spelthorne (SE England) 8.7%
Horsham (SE England) 8.7%
Stratford- on -Avon (West Midlands) 8.7%
Eastleigh (SE England) 8.7%
Wychavon (West Midlands) 8.6%
Brentwood (Eastern England) 8.6%
Wyre Forest (West Midlands) 8.5%
Solihull (West Midlands) 8.5%
Blaby (East Midlands) 8.5%
South Oxfordshire (SE England) 8.4%
Broadland (Eastern England) 8.4%
South Gloucestershire (SW England) 8.4%
Buckinghamshire (SE England) 8.4%
Harrow (London) 8.3%
Hinckley & Bosworth (East Midlands) 8.3%
Test Valley (SE England) 8.3%
Wandsworth (London) 8.2%
Mid Suffolk (Eastern England) 8.2%
Dacorum (Eastern England) 8.2%
Braintree (Eastern England) 8.2%
Sutton (London) 8.1%
Adur (SE England) 8.0%
Winchester (SE England) 8.0%
Warwick (West Midlands) 8.0%
Bath & North East Somerset (SW England) 8.0%
Bromsgrove (West Midlands) 7.9%
Stroud (SW England) 7.9%
Guildford (SE England) 7.9%
Central Bedfordshire (Eastern England) 7.8%
Merton (London) 7.8%
Tunbridge Wells (SE England) 7.8%
North Hertfordshire (Eastern England) 7.7%
Runnymede (SE England) 7.7%%
South Norfolk (Eastern England) 7.7%
Hammersmith & Fulham (London) 7.6%
Three Rivers (Eastern England) 7.5%
Tandridge (SE England) 7.5%
Barnet (London) 7.4%
Reigate & Banstead (SE England) 7.4%
Bromley (London) 7.4%
Cherwell (SE England) 7.4%
Chichester (SE England) 7.3%
Mid Sussex (SE England) 7.3%
Ribble Valley (NW England) 7.2%
Sevenoaks (SE England) 7.2%
West Oxfordshire (SE England) 7.1%
Woking (SE England) 7.1%
Harborough (East Midlands) 7.1%
Mole Valley (SE England) 7.1%
Windsor & Maidenhead (SE England) 7.0%
Oadby & Wigston (East Midlands) 7.0%
South Cambridgeshire (Eastern England) 6.9%
Wealden (SE England) 6.7%
Kingston upon Thames (London) 6.6%
East Cambridgeshire (Eastern England) 6.5%
Rushcliffe (East Midlands) 6.5%
Hart (SE England) 6.4%
Trafford (NW England) 6.1%
Waverley (SE England) 6.1%
St Albans (Eastern England) 6.0%
Elmbridge (SE England) 6.0%
Cambridge (Eastern England) 5.2%
Epsom & Ewell (SE England) 4.9%
Richmond upon Thames (London) 4.6%
Uttlesford (Eastern England) 4.3%
Year 6:
Sandwell (West Midlands) 30.7%
Knowsley (NW England) 30.1%
Wolverhampton (West Midlands) 30.0%
Southwark (London) 29.7%
Boston (East Midlands) 29.1%
Walsall (West Midlands) 28.4%
Tower Hamlets (London) 28.4%
Barking & Dagenham (London) 28.3%
Newham (London) 28.3%
Blackpool (NW England) 28.3%
Newcastle-under-Lyme (West Midlands) 28.2%
Hull (Yorkshire/Humber) 27.8%
Liverpool (NW England) 27.8%
Stoke-on-Trent (West Midlands) 27.5%
South Tyneside (NE England) 27.3%
Pendle (NW England) 27.2%
Nottingham (East Midlands) 27.1%
Sunderland (NE England) 27.1%
Ashfield (East Midlands) 27.0%
Birmingham (West Midlands) 27.0%
Manchester (NW England) 26.9%
Rotherham (Yorkshire/Humber) 26.7%
Peterborough (Eastern England) 26.7%
Doncaster (Yorkshire/Humber) 26.6%
Halton (NW England) 26.6%
Fenland (Eastern England) 26.4%
Enfield (London) 26.4%
Greenwich (London) 26.3%
Lincoln (East Midlands) 26.2%
North Lincolnshire (Yorkshire/Humber) 26.2%
North East Lincolnshire (Yorkshire/Humber) 26.1%
Bolsover (East Midlands) 26.1%
Rossendale (NW England) 26.0%
Barnsley (Yorkshire/Humber) 25.9%
Middlesbrough (NE England) 25.9%
Bradford (Yorkshire/Humber) 25.9%
South Holland (East Midlands) 25.8%
Salford (NW England) 25.7%
Mansfield (East Midlands) 25.7%
Hartlepool (NE England) 25.7%
Bassetlaw (East Midlands) 25.5%
Harlow (Eastern England) 25.5%
Gloucester (SW England) 25.5%
Luton (Eastern England) 25.5%
Great Yarmouth (Eastern England) 25.4%
Slough (SE England) 25.4%
Burnley (NW England) 25.3%
Derby (East Midlands) 25.2%
Lambeth (London) 25.2%
Rochdale (NW England) 25.2%
Gateshead (NE England) 25.1%
Bury (NW England) 25.1%
St Helens (NW England) 25.1%
County Durham (NE England) 25.0%
Oldham (NW England) 25.0%
Stockton- on -Tees (NE England) 25.0%
Thanet (SE England) 25.0%
Dudley (West Midlands) 24.9%
Gravesham (SE England) 24.9%
King’s Lynn & West Norfolk (Eastern England) 24.9%
Redcar & Cleveland (NE England) 24.9%
Hackney (London) 24.9%
Coventry (West Midlands) 24.8%
Haringey (London) 24.8%
Ipswich (Eastern England) 24.8%
Sefton (NW England) 24.7%
Brent (London) 24.7%
Dover (SE England) 24.7%
Nuneaton & Bedworth (West Midlands) 24.6%
Thurrock (Eastern England) 24.6%
Lewisham (London) 24.5%
Newcastle upon Tyne (NE England) 24.5%
Portsmouth (SE England) 24.5%
Redditch (West Midlands) 24.5%
Wigan (NW England) 24.4%
Gosport (SE England) 24.4%
Tendring (Eastern England) 24.2%
Rushmoor (SE England) 24.2%
Croydon (London) 24.2%
Westminster (London) 24.2%
Medway (SE England) 24.2%
Sheffield (Yorkshire/Humber) 24.1%
Tameside (NW England) 24.1%
Hyndburn (NW England) 24.0%
Leicester (East Midlands) 24.0%
Norwich (Eastern England) 23.9%
Swale (SE England) 23.9%
Wakefield (Yorkshire/Humber) 23.9%
Ealing (London) 23.9%
Telford & Wrekin (West Midlands) 23.9%
Blackburn with Darwen (NW England) 23.8%
Southampton (SE England) 23.8%
Dartford (SE England) 23.7%
Broxbourne (Eastern England) 23.7%
Northumberland (NE England) 23.7%
Kirklees (Yorkshire/Humber) 23.7%
Havering (London) 23.6%
Hounslow (London) 23.6%
Newark & Sherwood (East Midlands) 23.5%
Wirral (NW England) 23.4%
Chesterfield (East Midlands) 23.4%
Basildon (Eastern England) 23.3%
Bolton (NW England) 23.1%
Stevenage (Eastern England) 23.1%
Cumberland (NW England) 23.1%
Calderdale (Yorkshire/Humber) 23.1%
Redbridge (London) 23.1%
Plymouth (SW England) 23.0%
Wyre Forest (West Midlands) 23.0%
Leeds (Yorkshire/Humber) 22.8%
Reading (SE England) 22.7%
Amber Valley (East Midlands) 22.7%
East Riding of Yorkshire (Yorkshire/Humber) 22.7%
North Northamptonshire (East Midlands) 22.6%
Gedling (East Midlands) 22.6%
South Staffordshire (West Midlands) 22.6%
East Staffordshire (West Midlands) 22.6%
Breckland (Eastern England) 22.6%
North East Derbyshire (East Midlands) 22.5%
Bedford (Eastern England) 22.5%
Waltham Forest (London) 22.3%
North Tyneside (NE England) 22.3%
Harrow (London) 22.3%
Worcester (West Midlands) 22.2%
Islington (London) 22.2%
Maldon (Eastern England) 22.1%
Darlington (NE England) 22.1%
Isle of Wight (SE England) 22.1%
Crawley (SE England) 22.1%
South Derbyshire (East Midlands) 22.1%
Cheshire West & Chester (NW England) 22.1%
Castle Point (Eastern England) 22.0%
West Lindsey (East Midlands) 22.0%
Hastings (SE England) 22.0%
Bexley (London) 22.0%
Preston (NW England) 21.9%
Somerset (SW England) 21.9%
Wychavon (West Midlands) 21.9%
Camden (London) 21.8%
Tamworth (West Midlands) 21.7%
Canterbury (SE England) 21.7%
East Lindsey (East Midlands) 21.7%
Havant (SE England) 21.6%
Broxtowe (East Midlands) 21.6%
Milton Keynes (SE England) 21.6%
West Lancashire (NW England) 21.5%
South Ribble (NW England) 21.5%
Southend- on -Sea (Eastern England) 21.5%
South Kesteven (East Midlands) 21.5%
Torridge (SW England) 21.4%
Staffordshire Moorlands (West Midlands) 21.3%
Swindon (SW England) 21.3%
Hillingdon (London) 21.3%
Torbay (SW England) 21.2%
Lancaster (NW England) 21.1%
Watford (Eastern England) 21.1%
North Kesteven (East Midlands) 21.0%
Chorley (NW England) 20.9%
Bristol (SW England) 20.8%
Folkestone & Hythe (SE England) 20.8%
Rugby (West Midlands) 20.8%
Erewash (East Midlands) 20.8%
Worthing (SE England) 20.8%
Cannock Chase (West Midlands) 20.6%
Herefordshire (West Midlands) 20.5%
North Warwickshire (West Midlands) 20.5%
Eastbourne (SE England) 20.4%
North Norfolk (Eastern England) 20.4%
Forest of Dean (SW England) 20.4%
Warrington (NW England) 20.4%
Bournemouth, Christchurch & Poole (SW England) 20.4%
East Suffolk (Eastern England) 20.4%
Basingstoke & Deane (SE England) 20.4%
Cheshire East (NW England) 20.3%
Braintree (Eastern England) 20.2%
Lichfield (West Midlands) 20.2%
Shropshire (West Midlands) 20.1%
Ashford (SE England) 20.0%
Barnet (London) 20.0%
Hinckley & Bosworth (East Midlands) 20.0%
North West Leicestershire (East Midlands) 20.0%
West Northamptonshire (East Midlands) 19.9%
Teignbridge (SW England) 19.7%
Mid Devon (SW England) 19.7%
Malvern Hills (West Midlands) 19.7%
Cherwell (SE England) 19.7%
Solihull (West Midlands) 19.7%
Merton (London) 19.7%
Arun (SE England) 19.6%
Rother (SE England) 19.6%
Hertsmere (Eastern England) 19.6%
Chichester (SE England) 19.5%
Stafford (West Midlands) 19.5%
Adur (SE England) 19.4%
Rutland (East Midlands) 19.4%
Rochford (Eastern England) 19.4%
York (Yorkshire/Humber) 19.3%
North Yorkshire (Yorkshire/Humber) 19.3%
Blaby (East Midlands) 19.3%
Melton (East Midlands) 19.3%
Stockport (NW England) 19.1%
Sutton (London) 19.1%
Oxford (SE England) 19.0%
Wandsworth (London) 19.0%
Westmorland & Furness (NW England) 19.0%
Tewkesbury (SW England) 19.0%
Fylde (NW England) 18.9%
West Suffolk (Eastern England) 18.8%
South Gloucestershire (SW England) 18.8%
Test Valley (SE England) 18.7%
North Devon (SW England) 18.6%
Cornwall (SW England) 18.6%
Colchester (Eastern England) 18.5%
New Forest (SE England) 18.5%
Epping Forest (Eastern England) 18.5%
Wiltshire (SW England) 18.5%
Warwick (West Midlands) 18.3%
Lewes (SE England) 18.3%
Oadby & Wigston (East Midlands) 18.3%
Cotswold (SW England) 18.3%
Maidstone (SE England) 18.3%
Bracknell Forest (SE England) 18.3%
Spelthorne (SE England) 18.2%
Bromsgrove (West Midlands) 18.2%
East Hampshire (SE England) 18.2%
Stroud (SW England) 18.1%
Dacorum (Eastern England) 18.1%
Kensington & Chelsea (London) 18.0%
Charnwood (East Midlands) 18.0%
Babergh (Eastern England) 18.0%
Central Bedfordshire (Eastern England) 17.9%
South Norfolk (Eastern England) 17.9%
Chelmsford (Eastern England) 17.9%
Bromley (London) 17.8%
Huntingdonshire (Eastern England) 17.7%
Brighton & Hove (SE England) 17.7%
East Devon (SW England) 17.7%
North Somerset (SW England) 17.7%
Harborough (East Midlands) 17.4%
Trafford (NW England) 17.4%
Eastleigh (SE England) 17.4%
Hammersmith & Fulham (London) 17.3%
Buckinghamshire (SE England) 17.3%
Three Rivers (Eastern England) 17.2%
Stratford- on -Avon (West Midlands) 17.1%
Dorset (SW England) 17.0%
Wyre (NW England) 17.0%
West Oxfordshire (SE England) 17.0%
Welwyn Hatfield (Eastern England) 16.9%
Runnymede (SE England) 16.9%
Brentwood (Eastern England) 16.9%
Fareham (SE England) 16.8%
High Peak (East Midlands) 16.8%
Tandridge (SE England) 16.7%
Wokingham (SE England) 16.6%
West Devon (SW England) 16.5%
Vale of White Horse (SE England) 16.4%
Ribble Valley (NW England) 16.4%
Mid Suffolk (Eastern England) 16.3%
North Hertfordshire (Eastern England) 16.3%
Wealden (SE England) 16.3%
South Oxfordshire (SE England) 16.3%
West Berkshire (SE England) 16.2%
Derbyshire Dales (East Midlands) 16.1%
Cheltenham (SW England) 16.1%
Exeter (SW England) 15.9%
Rushcliffe (East Midlands) 15.8%
Tonbridge & Malling (SE England) 15.8%
Reigate & Banstead (SE England) 15.7%
Bath & North East Somerset (SW England) 15.5%
East Cambridgeshire (Eastern England) 15.5%
Windsor & Maidenhead (SE England) 15.4%
Sevenoaks (SE England) 15.3%
Tunbridge Wells (SE England) 15.3%
Woking (SE England) 15.2%
Broadland (Eastern England) 15.2%
Hart (SE England) 15.0%
Horsham (SE England) 14.9%
Winchester (SE England) 14.9%
East Hertfordshire (Eastern England) 14.8%
South Cambridgeshire (Eastern England) 14.8%
Kingston upon Thames (London) 14.6%
Mid Sussex (SE England) 14.6%
Surrey Heath (SE England) 14.5%
Guildford (SE England) 13.6%
Uttlesford (Eastern England) 13.2%
South Hams (SW England) 13.1%
Waverley (SE England) 13.1%
Elmbridge (SE England) 13.1%
Epsom & Ewell (SE England) 12.8%
Cambridge (Eastern England) 12.7%
Richmond upon Thames (London) 12.1%
St Albans (Eastern England) 12.0%
Mole Valley (SE England) 9.7%
Get daily headlines and breaking news emailed to you – it’s FREE