

Nov 8, 2025
IndexBox has just published a new report: United Kingdom – Waferboard – Market Analysis, Forecast, Size, Trends and Insights.
This article provides a comprehensive analysis of the United Kingdom’s waferboard market for 2024, with a forecast extending to 2035. In 2024, the market experienced a modest contraction in both volume (3.1M cubic meters, -3.7%) and value ($1.1B, -9.3%). Despite this recent dip, the market is forecast for a slight upward trend over the next decade, with volume projected to reach 3.2M cubic meters by 2035 (CAGR +0.2%) and value to reach $1.3B (CAGR +1.7%). Domestic production remained stable at 2.7M cubic meters, valued at $913M. The UK is a net importer of waferboard, with imports falling significantly to 425K cubic meters in 2024, primarily sourced from Belgium, Germany, and Portugal. The average import price rose to $427 per cubic meter. Exports were modest at 67K cubic meters, with Ireland being the dominant destination, and the average export price was $536 per cubic meter.
Key Findings
UK waferboard market volume is forecast for slight growth with a +0.2% CAGR to 3.2M cubic meters by 2035Market value is projected to increase at a +1.7% CAGR, reaching $1.3B by 2035Domestic production remained stable at 2.7M cubic meters while consumption was 3.1M cubic meters in 2024Imports fell sharply by -21.7% to 425K cubic meters, led by Belgium, Germany, and PortugalExports were modest at 67K cubic meters, with Ireland as the primary destination, accounting for 64% of exportsMarket Forecast
Driven by rising demand for waferboard in the UK, the market is expected to start an upward consumption trend over the next decade. The performance of the market is forecast to increase slightly, with an anticipated CAGR of +0.2% for the period from 2024 to 2035, which is projected to bring the market volume to 3.2M cubic meters by the end of 2035.
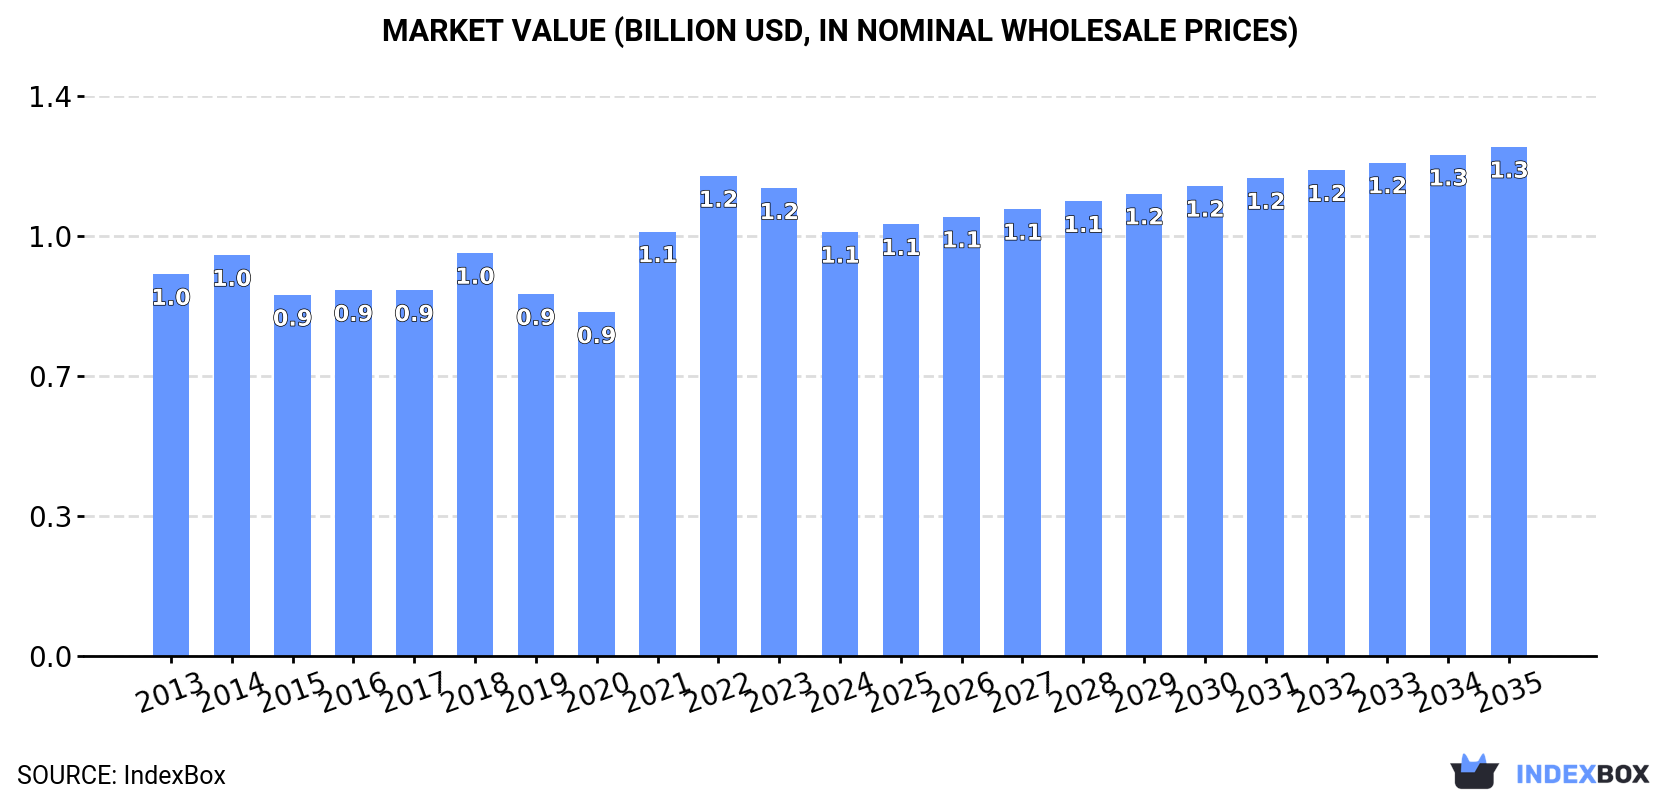
In value terms, the market is forecast to increase with an anticipated CAGR of +1.7% for the period from 2024 to 2035, which is projected to bring the market value to $1.3B (in nominal wholesale prices) by the end of 2035.
 ConsumptionUnited Kingdom’s Consumption of Waferboard
In 2024, the amount of waferboards consumed in the UK contracted modestly to 3.1M cubic meters, which is down by -3.7% on the previous year. Over the period under review, consumption showed a relatively flat trend pattern. The most prominent rate of growth was recorded in 2016 with an increase of 4.3%. Over the period under review, consumption hit record highs at 3.6M cubic meters in 2018; however, from 2019 to 2024, consumption remained at a lower figure.
The size of the waferboard market in the UK shrank to $1.1B in 2024, declining by -9.3% against the previous year. This figure reflects the total revenues of producers and importers (excluding logistics costs, retail marketing costs, and retailers’ margins, which will be included in the final consumer price). Overall, consumption, however, saw a slight increase. Waferboard consumption peaked at $1.2B in 2022; however, from 2023 to 2024, consumption stood at a somewhat lower figure.
ProductionUnited Kingdom’s Production of Waferboard
In 2024, approx. 2.7M cubic meters of waferboards were produced in the UK; remaining stable against the year before. Over the period under review, production showed a relatively flat trend pattern. The pace of growth was the most pronounced in 2015 when the production volume increased by 4.3%. As a result, production attained the peak volume of 2.8M cubic meters. From 2016 to 2024, production growth remained at a somewhat lower figure.
In value terms, waferboard production shrank to $913M in 2024 estimated in export price. Overall, production, however, recorded a relatively flat trend pattern. The growth pace was the most rapid in 2022 with an increase of 16%. As a result, production reached the peak level of $1B. From 2023 to 2024, production growth remained at a somewhat lower figure.
ImportsUnited Kingdom’s Imports of Waferboard
Waferboard imports into the UK fell significantly to 425K cubic meters in 2024, reducing by -21.7% compared with 2023 figures. Over the period under review, imports showed a relatively flat trend pattern. The most prominent rate of growth was recorded in 2016 with an increase of 30% against the previous year. Imports peaked at 827K cubic meters in 2018; however, from 2019 to 2024, imports stood at a somewhat lower figure.
In value terms, waferboard imports reduced to $182M in 2024. The total import value increased at an average annual rate of +1.4% over the period from 2013 to 2024; however, the trend pattern indicated some noticeable fluctuations being recorded throughout the analyzed period. The growth pace was the most rapid in 2021 when imports increased by 61%. Over the period under review, imports hit record highs at $237M in 2018; however, from 2019 to 2024, imports stood at a somewhat lower figure.
Imports By Country
Belgium (115K cubic meters), Germany (111K cubic meters) and Portugal (77K cubic meters) were the main suppliers of waferboard imports to the UK, together accounting for 71% of total imports. Spain, Ireland, France, Switzerland and Italy lagged somewhat behind, together comprising a further 22%.
From 2013 to 2024, the biggest increases were recorded for Switzerland (with a CAGR of +140.3%), while purchases for the other leaders experienced more modest paces of growth.
In value terms, Germany ($51M), Belgium ($41M) and Portugal ($27M) appeared to be the largest waferboard suppliers to the UK, with a combined 66% share of total imports. Spain, Italy, France, Ireland and Switzerland lagged somewhat behind, together accounting for a further 22%.
In terms of the main suppliers, Switzerland, with a CAGR of +135.0%, recorded the highest growth rate of the value of imports, over the period under review, while purchases for the other leaders experienced more modest paces of growth.
Import Prices By Country
In 2024, the average waferboard import price amounted to $427 per cubic meter, increasing by 17% against the previous year. In general, import price indicated notable growth from 2013 to 2024: its price increased at an average annual rate of +2.1% over the last eleven years. The trend pattern, however, indicated some noticeable fluctuations being recorded throughout the analyzed period. The pace of growth was the most pronounced in 2021 when the average import price increased by 28% against the previous year. The import price peaked in 2024 and is expected to retain growth in the immediate term.
Prices varied noticeably by country of origin: amid the top importers, the country with the highest price was Italy ($658 per cubic meter), while the price for Ireland ($249 per cubic meter) was amongst the lowest.
From 2013 to 2024, the most notable rate of growth in terms of prices was attained by France (+7.1%), while the prices for the other major suppliers experienced more modest paces of growth.
ExportsUnited Kingdom’s Exports of Waferboard
In 2024, the amount of waferboards exported from the UK dropped modestly to 67K cubic meters, leveling off at the year before. Over the period under review, exports showed a relatively flat trend pattern. The growth pace was the most rapid in 2017 with an increase of 71% against the previous year. As a result, the exports reached the peak of 109K cubic meters. From 2018 to 2024, the growth of the exports failed to regain momentum.
In value terms, waferboard exports amounted to $36M in 2024. The total export value increased at an average annual rate of +3.1% over the period from 2013 to 2024; however, the trend pattern indicated some noticeable fluctuations being recorded throughout the analyzed period. The most prominent rate of growth was recorded in 2017 with an increase of 45% against the previous year. As a result, the exports attained the peak of $36M. From 2018 to 2024, the growth of the exports failed to regain momentum.
Exports By Country
Ireland (43K cubic meters) was the main destination for waferboard exports from the UK, accounting for a 64% share of total exports. Moreover, waferboard exports to Ireland exceeded the volume sent to the second major destination, Germany (6.4K cubic meters), sevenfold. The third position in this ranking was taken by Belgium (4.2K cubic meters), with a 6.3% share.
From 2013 to 2024, the average annual growth rate of volume to Ireland was relatively modest. Exports to the other major destinations recorded the following average annual rates of exports growth: Germany (+19.9% per year) and Belgium (+3.3% per year).
In value terms, Ireland ($21M) remains the key foreign market for waferboards exports from the UK, comprising 60% of total exports. The second position in the ranking was held by Germany ($2.4M), with a 6.6% share of total exports. It was followed by the Netherlands, with a 3.5% share.
From 2013 to 2024, the average annual growth rate of value to Ireland stood at +2.4%. Exports to the other major destinations recorded the following average annual rates of exports growth: Germany (+26.2% per year) and the Netherlands (+10.6% per year).
Export Prices By Country
In 2024, the average waferboard export price amounted to $536 per cubic meter, remaining stable against the previous year. Over the period under review, export price indicated a temperate increase from 2013 to 2024: its price increased at an average annual rate of +3.6% over the last eleven-year period. The trend pattern, however, indicated some noticeable fluctuations being recorded throughout the analyzed period. Based on 2024 figures, waferboard export price decreased by -17.9% against 2022 indices. The growth pace was the most rapid in 2021 an increase of 42% against the previous year. The export price peaked at $653 per cubic meter in 2022; however, from 2023 to 2024, the export prices failed to regain momentum.
There were significant differences in the average prices for the major export markets. In 2024, amid the top suppliers, the country with the highest price was Ireland ($501 per cubic meter), while the average price for exports to Belgium ($229 per cubic meter) was amongst the lowest.
From 2013 to 2024, the most notable rate of growth in terms of prices was recorded for supplies to Germany (+5.2%), while the prices for the other major destinations experienced more modest paces of growth.