
Regional sea level rise and the exceptional 2023 event in AfricaLong-term acceleration in African sea level rise (1993–2023)
Satellite altimetry shows Africa’s regional mean geocentric sea level (RMSL) rose by 10.25 cm from 1993 to 2023, driven by a linear trend of 3.31 ± 0.04 mm/yr and an acceleration of 0.11 ± 0.02 mm/yr² (GIA-corrected; see Fig. 2a). Vertical land motion, while influencing relative SLR, does not affect altimetry-derived geocentric trends. This acceleration is comparable to the global rate (0.12 ± 0.05 mm/yr²)3,44. Notably, 2023 recorded the highest annual mean sea level to date. This increase is statistically significant, with a trend difference of 3.39 mm/yr between the first and last decades, and a notable 1.41 mm/yr difference between the last two decades (2003–2012 vs. 2013–2023). The rate of SLR
Fig. 2: Regional sea level variability and anomalies across Africa (1993–2023).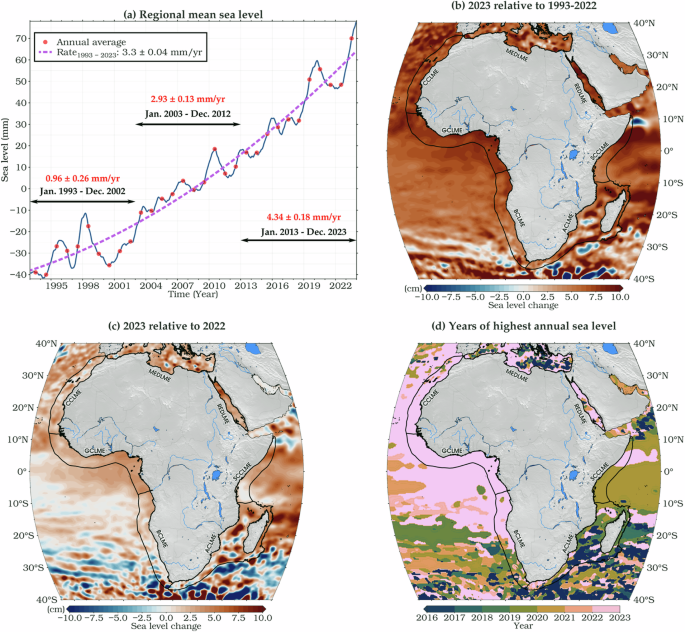
a Time series of regional monthly mean sea level for Africa derived from satellite altimetry. Annual means are shown by red markers, with a purple curve representing a second-order polynomial trend. b Annual mean sea level for 2023 expressed as anomalies relative to the 1993–2022 baseline. c Difference between 2023 and 2022 annual means. d Spatial distribution of the year with the peak annual sea level recorded during the altimetry period. In 2023, sea levels across much of Africa continued to rise, primarily driven by global warming and modulated by large-scale climate variability such as El Niño. The seven African LMEs are labeled as in Fig. 1.
has sharply increased, with cumulative SLRs (i.e., total increases over each decade) of approximately 0.92 cm (1993–2002), 2.82 cm (2003–2012), and 4.60 cm (2013–2023). The rate rose from 0.96 ± 0.26 mm/yr in the first decade to 4.34 ± 0.18 mm/yr in the last, a 4.54 ± 1.26-fold increase (Fig. 2a). Over the past two decades, the average rate (3.67 ± 0.16 mm/yr) was 1.2 times the long-term trend, highlighting ongoing acceleration since the early 1990s (Supplementary Fig. 1).
This acceleration reflects intensified contributions from thermal expansion due to ocean warming and increased individual mass contributions, including glacier melt, Greenland and Antarctic ice sheets, changes in land water storage, freshwater fluxes, and atmospheric water vapor content45. These regional changes coincide with a globally coherent climate shift that began in the early 2010s, as evidenced by synchronized transitions in oceanic and atmospheric parameters worldwide, further underscoring the systemic nature of the observed SLR44. This rise is further amplified by mass contributions from melting glaciers, Greenland and Antarctic ice sheets, and changes in land water storage46,47, as depicted in the trend curve of Fig. 2a. While the long-term trend is generally upward, it includes minor fluctuations—for example, a subtle 0.09 cm decrease between 2021 to 2022 (ranking 22nd among 31 annual changes), likely influenced by regional ocean circulation anomalies. This was followed by a rise of 1.97 cm from 2022 to 2023—the second-highest annual increase on record, surpassed only by the 1997–1998 El Niño-driven rise. This increase drove 2023 to the highest annual domain-averaged SLA of 10 cm, with peak monthly values in November (12.50 cm) and December (12.73 cm) ranking as the top two months over the 1993–2023 period (see Supplementary Fig. 2). Notably, the 2022–2023 increase significantly outpaced the global mean rise of 0.59 cm.
Complementing the temporal evolution, the spatial patterns in 2023 reveal an alarming extent of regional SLAs. Spatially, more than 95% of the African ocean surface exhibited elevated sea levels in 2023 compared to the 1993–2022 climatology — here defined as the average sea level over that 30-year period (Fig. 2b)—with more than 75% showing an increase relative to 2022. In 2023, monthly SLAs across Africa and its seven LMEs significantly exceeded the 1993–2022 climatology, with differences of 4.22–8.53 cm for Africa and up to 16.24 cm for the Somali Coastal Current (December). Other LMEs, including the Guinea Current (up to 8.67 cm, June), Benguela Current (up to 8.36 cm, December), and Mediterranean Sea (up to 11.22 cm, May), showed anomalies of 2.82–11.22 cm (Supplementary Fig. 2). Notably, 1.5% of the region experienced rises exceeding 10 cm, particularly in dynamic ocean systems such as the Agulhas Current (Fig. 2c). These localized hotspots of SLR are consistent with areas of strong mesoscale activity and boundary currents. By 2023, 38.6% of the regional ocean, especially in the Eastern Tropical Atlantic, reached its highest annual sea level on record, while 72.1% recorded peak levels during or after 2020 (Fig. 2d). This clustering of record-high sea level years since 2020 confirms that recent intensification is not isolated but rather part of a sustained spatial trend affecting large portions of the basin. This widespread occurrence of record-high sea levels in recent years points to a sustained and intensifying trend. These patterns align with global sea level trends, which show a 10.5 cm rise over the same period, but the accelerated rates and extreme annual increases in the African region amplify risks for coastal communities. The widespread elevation, affecting 95.8% of the region, underscores heightened coastal flooding risks, particularly in the Somali and Guinea Currents (Fig. 2b–d). These areas face heightened threats of inundation, salinization of freshwater resources, and loss of critical ecosystems.
Peak SLA years and the exceptional 2023 event
We assessed annual mean and peak monthly SLA, as well as their residuals, after removing the 1993–2023 GMSL trend (3.4 ± 0.3 mm/yr), as shown in the residuals time series in Fig. 3a. The analysis focused on five peak years: 1995, 1997, 2010, 2019, and 2023. Residuals were calculated by subtracting a linear GMSL trend fitted to satellite altimetry data for the African region, isolating spatially variable anomalies driven by regional oceanographic or climate processes. Peak months were identified as the months with the highest SLA per year. Notably, the 2023 values were exceptional. The annual mean SLA reached 67.95 mm, which was 19.24 mm higher than in 2019, and the December peak month SLA reached 77.65 mm, significantly exceeding 2019’s 56.66 mm, as illustrated in Fig. 3b. After removing the GMSL trend, the 2023 residuals remained outstanding: annual mean residuals were 14.13 mm, the highest of all years, and peak month residuals reached 22.32 mm, surpassing 1997’s value by 24.9%. Statistical tests, including Bonferroni-corrected t-tests48 (p < 0.0125 for 1997, 2010, 2019), supported the presence of persistent, regionally coherent anomalies, likely reflecting steric (temperature- and salinity-driven) or circulation-driven variability. Fig. 3b summarizes these metrics across peak years, underscoring 2023’s exceptional ranking in all categories and highlighting 2023’s dominance across all four metrics. Consequently, 2023 stands apart from years like 1997, which exhibited large residuals (16.64 mm) linked to the 1997–1998 El Niño, and 2019 Atlantic Niño, which showed high SLA (56.66 mm) but smaller residuals (14.53 mm). Trend analysis further supports this conclusion: SLA trends accelerated over the three decades, providing context for the residuals in Fig. 3a. This acceleration, combined with 2023’s large residuals, suggests contributions from both global and regional drivers, potentially linked to basin-scale climate variability, such as the 2023–2024 El Niño/Atlantic Niño or changes in coastal circulation. However, further analysis is needed to confirm these mechanisms. In conclusion, 2023 represents the most extreme regional SLA event in the satellite record for Africa, characterized by unprecedented magnitude, persistence after global signal removal, and strong regional forcing atop an accelerating background of global SLR.
Fig. 3: Residual sea level anomalies in Africa highlight the exceptional nature of 2023.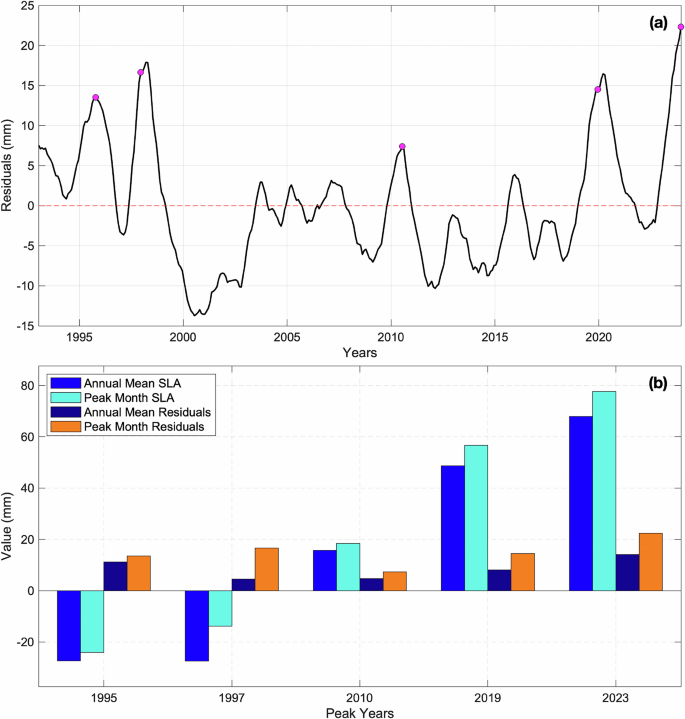
a Time series of SLA residuals after removing the 1993–2023 GMSL trend, with pink dots marking peak maxima. b Comparison of SLA and residual magnitudes for selected peak years. The year 2023 exhibits the largest anomalies in both SLA and residuals across the satellite record, persisting even after global trend removal.
Sea levels trends and its componentsRegional trends variability
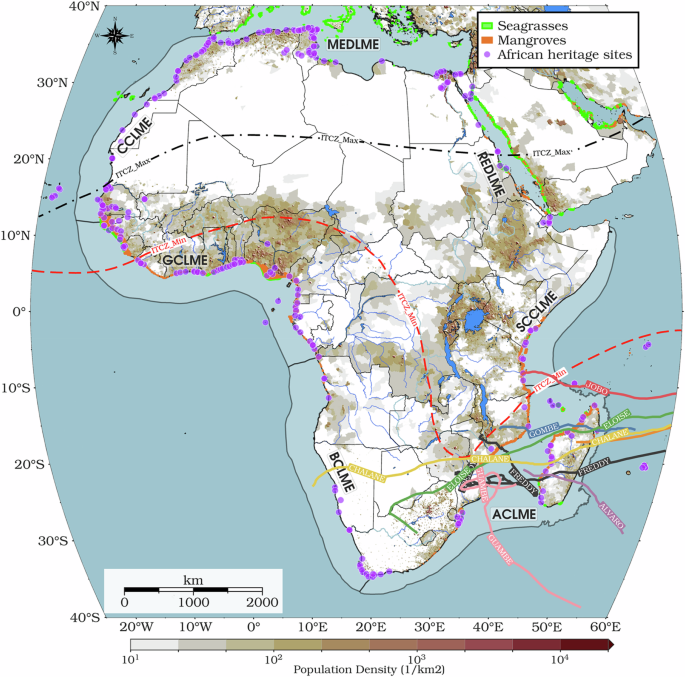
In this section, we analyze the spatial and long-term trend of the total SLA from 1993 to 2023, based on a reanalysis dataset that integrates altimetric, thermosteric, halosteric, and manometric components. This comprehensive approach captures the combined influence of these factors on sea level variability across the African region and its LMEs. We also quantify the relative contributions of the total steric effect and its individual components to overall sea level variability. As illustrated in Fig. 4a, the SLA trend map reveals significant spatial patterns, with a statistically significant (p < 0.05) trend in the RMSL. The color gradient (from blue to yellow) reflects the global mean SLR of 3.4 ± 0.3 mm/yr over the same period shown as a gray contour, which is used as a reference threshold44,49 to distinguish areas experiencing below- or above-average SLR compared to the global mean. Although the regional mean rate is similar to the GMSL, this average mask substantial spatial heterogeneity. Fig. 4a shows that much of the African oceanic region experiences sea-level anomaly (SLA) trends above the GMSL, particularly across several LMEs. Notably, the Guinea Current (GCLME), Canary Current (CCLME), Red Sea (REDLME), Somali Coastal Current (SCCLME), and the northern parts of the Benguela Current (BCLME) and Agulhas Current (ACLME) exhibit SLR rates exceeding the GMSL. These elevated rates may be linked to intensified wind-driven circulation or enhanced tropical thermosteric expansion. In contrast, the Mediterranean LME (MEDLME) (see Fig. 1) shows trends below the global mean.
Fig. 4: Spatial distribution of regional sea-level trends across Africa’s coastal LMEs from 1993 to 2023.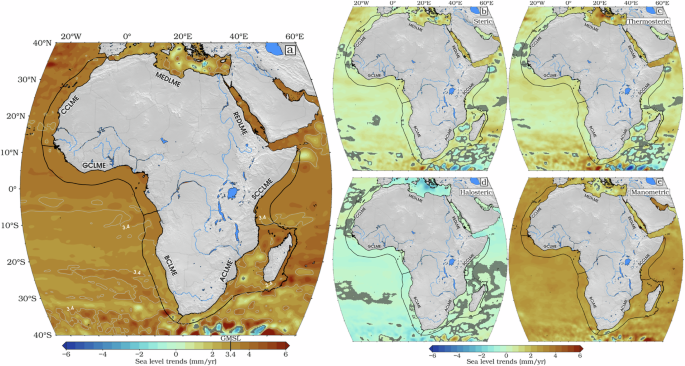
a Total sea-level trend; b total steric; c thermosteric; d halosteric; and e manometric (SLA minus steric) trends. GIA corrections were applied to both SLA and manometric trends. At each grid point, mean and seasonal cycles were removed prior to trend estimation. All trends are statistically significant at the 95% confidence level except in areas marked with gray dots. The seven African LMEs are labeled as in Fig. 1.
The trends in SLA across Africa’s seven LMEs, as shown in Fig. 4a, reflect a compound interplay between steric (thermosteric + halosteric) and manometric components, each contributing differently across regions. These components interact to create distinct spatial patterns in SLA, shaped by both local and large-scale oceanographic processes. In the equatorial and tropical LMEs-such as the GCLME, CCLME, SCCLME, and the REDLME-thermosteric expansion, driven by ocean warming, is the principal contributor to SLR. The steric component, which encompasses changes in seawater density due to temperature and salinity, accounts for 19.78% of the total SLA in the entire region, as depicted in Fig. 4b. Notably, the thermosteric signal alone contributes 27.90% of SLA and exceeds the total steric trend by 41.10% (see Fig. 4c), underscoring the dominant role of thermal expansion. This effect is especially pronounced along the equatorial Atlantic and Indian Ocean margins, where persistent high temperatures and seasonal upwelling fuel significant thermal expansion.
In contrast, subtropical regions such as the MEDLME display different dynamics. In the CCLME, thermosteric trends closely mirror SLA patterns, indicating that temperature-driven expansion remains important, as shown in Fig. 4a and Fig. 5 However, in the MEDLME, SLA variability aligns more closely with halosteric changes—those driven by salinity-evident in Fig. 4d. The halosteric signal strongly influences sea level trends in the MEDLME, where increased evaporation and reduced freshwater input elevate salinity, making it the dominant steric driver. The halosteric component, on average, exerts a modest but negative influence on SLA across most LMEs, contributing −8.13% (Fig. 4d). Negative halosteric trends are most notable in the MEDLME and broader North BCLME at the Congo River runoffs, likely linked to regional climate and hydrological patterns. Positive halosteric trends are mostly observed in the CCLME and ACLME, with localized positive trends in the GCLME, particularly off the coasts of Cameroon and Liberia, where major rivers discharge freshwater into the ocean, as highlighted in Fig. 4d. These regions, along with parts of the REDLME, Agulhas retroflection zone, and ACLME, experience enhanced steric SLR due to reduced water column density from riverine and estuarine runoff. Such freshwater inputs and regional circulation changes can locally offset the broader negative halosteric trend, highlighting the importance of hydrological variability in shaping regional sea level patterns. Dominating the SLA signal is the manometric component, which accounts for 80.23% of the total trend, as illustrated in Fig. 4e. Manometric sea level changes refer to variations caused by the redistribution of ocean mass, primarily from land ice melt, changes in terrestrial water storage, and large-scale shifts in the global water cycle. These changes are measured as the difference between total sea level changes (from satellite altimetry) and steric changes (from in situ temperature and salinity observations). In Africa, manometric trends generally range between 1.8 and 2.9 mm/yr in most LMEs. The highest values are observed in the SCCLME and GCLME, while lower rates (0.5–2 mm/yr) occur in the southernmost ACLME, MEDLME, and REDLME (Fig. 4e).
Fig. 5: Temporal evolution and decadal sea level components for Africa.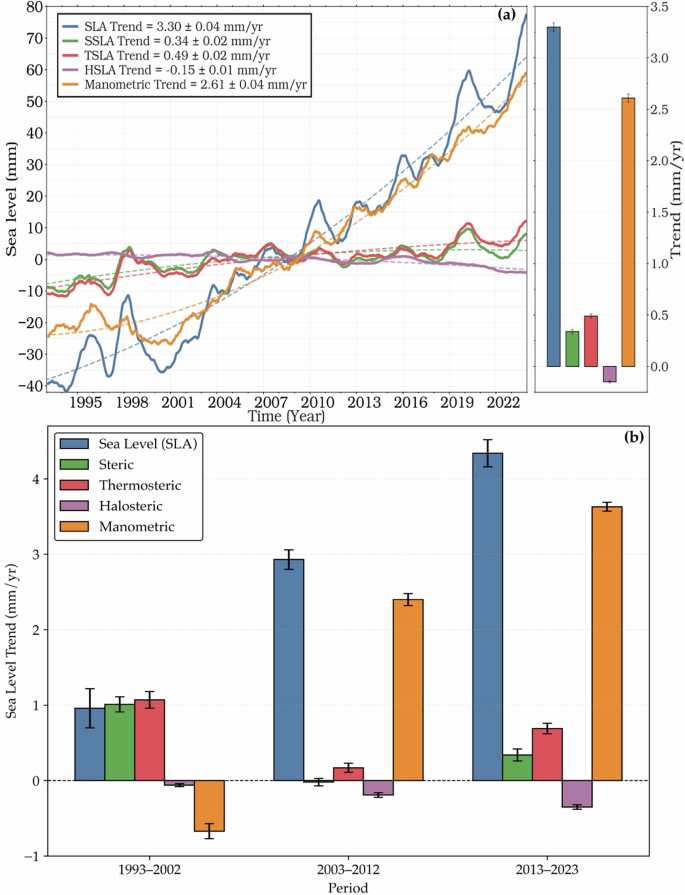
a Time series and linear trends of de-seasoned monthly anomalies of total SLA (blue), steric (SSLA; green), thermosteric (TSLA; red), halosteric (HSLA; purple), and manometric (orange) components from 1993 to 2023. Trend values for each component are indicated. All time series are smoothed using a 13-month low-pass filter to highlight interannual-to-decadal variability. b Decadal sea-level trends and component contributions for the African region, with bars showing trends (mm yr⁻¹) and error bars indicating uncertainties.
Figure 5a provides a comprehensive view of SLR trends over Africa by illustrating the evolution of the total SLA and its contributing components. The SLA (depicted by the blue line) shows a steady and significant upward trend of 3.30 ± 0.04 mm/yr since the early 1990s, closely aligning with the GMSL trend of 3.4 mm/yr. As shown in Fig. 5b, this regional trend masks a pronounced acceleration, increasing from 0.96 ± 0.26 mm/yr in 1993–2002 to 4.34 ± 0.18 mm/yr in 2013–2023, a more than fourfold increase, driven by two primary processes: steric changes, due to variations in seawater density (temperature and salinity), and manometric changes, linked to shifts in ocean mass from cryospheric and hydrological processes. The manometric contribution (orange line, Fig. 5a), with a trend of 2.61 ± 0.04 mm/yr, accounts for 79% of the SLA rise, dominating the total SLR. This is in line with Bellas-Manley et al.50, who found that the rise is primarily driven by mass inputs from global ice melt, especially Antarctic ice loss, which contributes up to 1.2 mm/yr through gravitational fingerprints in southern LMEs and Greenland’s more uniform effect, alongside changes in land water storage51. Manometric contributions have accelerated significantly, rising by 3.28 ± 0.11 mm/yr above 1993–2002 (Fig. 5b) levels, underscoring their pivotal role in shaping regional sea-level patterns. This acceleration closely tracks the intensified glacier melt reported by Dussaillant et al.52 with five of the last six years (2019, 2020, 2022, 2023, and 2024) exceeding 430 Gt/yr, reinforcing the substantial contribution of glaciers to the SLR acceleration observed along African coasts. The post‑2019 period of exceptional melt coincides with the smaller, but still positive, increment in manometric acceleration from the second to the third decade, indicating that while the largest step‑change occurred earlier (1993–2002 to 2003–2012), sustained high rates of glacier and ice‑sheet loss in recent years have maintained and reinforced elevated mass‑driven SLR trends across African LMEs. GIA has a negligible impact (<0.1 mm/yr) on African coasts, far from past ice sheet collapse regions. In contrast, the steric contribution (green line, Fig. 5a) is minor, with a trend of 0.34 ± 0.02 mm/yr, reflecting changes in seawater density. This is subdivided into thermosteric (temperature-driven) and halosteric (salinity-driven) components. The thermosteric anomaly (red line) exhibits a positive trend of 0.49 ± 0.02 mm/yr, indicating that ocean warming and thermal expansion are significant within the steric component. Conversely, the halosteric anomaly (purple line) shows a negative trend of −0.15 ± 0.01 mm/yr, suggesting that increasing salinity slightly counteracts SLR by increasing seawater density. The higher thermosteric trend compared to the total steric trend indicates that the halosteric component modestly offsets warming effects. While steric changes drive interannual variability, the manometric component, significantly driven by glacier melt as quantified by Dussaillant et al.52 dominates the accelerated SLR affecting African coastal regions.
Figure 5 clarify the relative contributions, highlighting the dominance of the manometric component, followed by the thermosteric contribution, with the halosteric effect remaining negative and minor. All components exhibit temporal variability, with short-term oscillations superimposed on long-term trends.
As shown in Fig. 5b, the African oceanic domains exhibit an increased trend over the observed last two decades, with the most recent decade marking an unprecedented increase in sea level, a signature of the strongest acceleration recorded to date. This regime shift aligns with the peak glacier mass loss documented by Dussaillant et al.52 particularly the 2023 record of 540 ± 69 Gt, contributing 1.5 mm to GMSL rise, which exacerbates regional SLR impacts on African coasts through enhanced ocean mass inputs. The steric components, in particular, show notable interannual variability, likely linked to climate phenomena such as ENSO and shifts in the ITCZ, which influence temperature and salinity distributions in the tropical ocean. Africa LMEs Sea level trends.
Atlantic Ocean LMEs
The CCLME, a productive eastern boundary upwelling system situated along northwest Africa in the Atlantic Ocean, exhibits a SLA trend of 3.30 ± 0.05 mm/yr over the study period Fig. 6a). This rise is primarily driven by mass (manometric) contributions of 2.63 ± 0.05 mm/yr, accounting for approximately 80% of the total and largely attributable to intensified land ice melt39,45. Steric contributions (0.66 ± 0.04 mm/yr), comprising about 20% of the SLA, include modest thermosteric expansion (0.47 ± 0.06 mm/yr) and a smaller positive halosteric signal (0.19 ± 0.03 mm/yr), the latter reflecting a salinity decrease primarily driven by increased continental runoff and possibly changes in precipitation, which overwhelms the salinizing effect of evaporation53,54. As a productive upwelling zone, the CCLME experiences moderated upper-ocean warming due to the persistent influx of cooler, nutrient-rich subsurface waters, which temper thermosteric expansion25,55. This upwelling-related cooling becomes more apparent in the decadal evolution of sea level trends. Between 1993–2002 (Fig. 9, Supplementary Table 1), SLA rose at 3.12 ± 0.30 mm/yr, driven largely by strong thermosteric expansion (2.07 ± 0.32 mm/yr). SLA peaked at 4.61 ± 0.31 mm/yr in 2003–2012, coinciding with an exceptional thermosteric contribution of 4.08 ± 0.23 mm/yr. However, in the most recent decade (2013–2023), although the SLA further increased to 4.69 ± 0.18 mm/yr, the thermosteric contribution dropped sharply to 0.45 ± 0.16 mm/yr—a decline of 1.60 mm/yr from the 1993–2002 (Fig. 9a) level-consistent with enhanced upwelling reducing heat retention in the upper ocean55. In parallel, mass contributions nearly doubled from 1.39 ± 0.18 mm/yr in 1993–2002 (Figs. 9a) to 3.12 ± 0.10 mm/yr in 2013–2023 (Fig. 9c), underscoring the increasing influence of land ice melt. Halosteric trends also shifted markedly from negative (−0.35 ± 0.04 mm/yr) to positive values (1.12 ± 0.07 mm/yr), reflecting a transition from salinity increase (which raises density and contributes negatively to sea level) to salinity decrease (which lowers density and contributes positively). This shift likely reflects enhanced freshwater input53. This shift supported a steric contribution of approximately 33% in the latest decade, with halosteric effects playing a more prominent role.
Fig. 6: Regional sea level budget components for the Atlantic LMEs.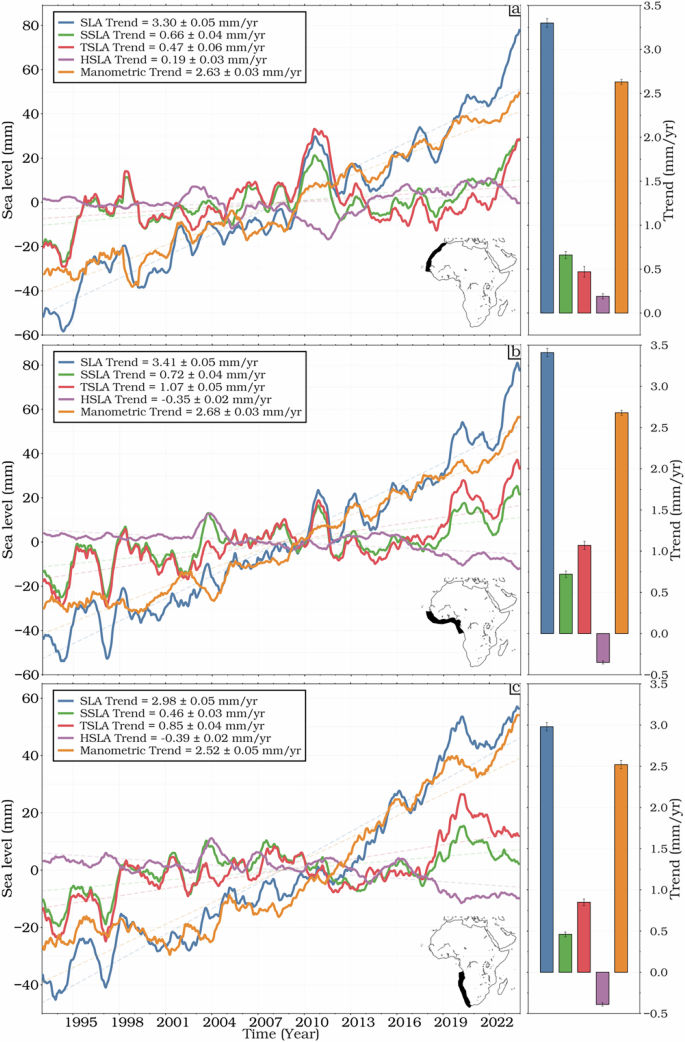
Temporal evolution and linear trends of de-seasoned monthly anomalies for a the Canary Current LME (CCLME), b the Guinea Current LME (GCLME), and c the Benguela Current LME (BCLME) from 1993–2023. Contributions shown are total Sea-Level Anomaly (SLA; blue line), steric (SSLA; green line), thermosteric (TSLA; red line), halosteric (HSLA; purple line), and manometric (orange line). All time series are smoothed with a 13-month low-pass filter.
Bordering the West African coast, the GCLME spans approximately 2 million km² and is characterized by seasonal upwelling, high freshwater input, and low-salinity surface waters25,56. Between 1993 and 2023, this region experienced a SLA trend of 3.41 ± 0.05 mm/yr, slightly above the global mean ranking it second among all LMEs (Fig. 6b).
This rise is predominantly driven by mass (manometric) contributions of 2.68 ± 0.03 mm/yr, representing about 79% of the total. Steric effects contribute 0.72 ± 0.04 mm/yr (21%) to the regional sea level trend in the GCLME. Of this, thermosteric expansion estimated at 1.07 ± 0.05 mm/yr reflects upper-ocean warming across the tropical Atlantic, amplified by seasonal upwelling that redistributes heat in the upper layers, while halosteric changes (−0.35 ± 0.02 mm/yr) indicate contraction driven by salinity increase (i.e., density increase causing volume reduction). These findings align with recent studies emphasizing the joint role of mass and steric components in driving SLR in river-dominated tropical LMEs57. A decadal breakdown reveals a marked acceleration: SLA increased from 2.00 ± 0.27 mm/yr in 1993–2002 (Fig. 9a) to 4.50 ± 0.19 mm/yr in 2013–2023 (Fig. 9c), a 2.25-fold rise. Initially, this was supported by modest contributions from mass (0.54 ± 0.11 mm/yr) and thermosteric (1.55 ± 0.30 mm/yr) components. During 2003–2012 (Fig. 9b), both peaked, with manometric input reaching 3.63 ± 0.11 mm/yr and thermosteric expansion at 1.41 ± 0.18 mm/yr. In the most recent decade, mass contributions stabilized at 2.88 ± 0.09 mm/yr, while thermosteric trends remained steady at 3.07 ± 0.18 mm/yr, reflecting sustained ocean warming. Concurrently, halosteric contributions became increasingly negative, reaching −1.45 ± 0.06 mm/yr in 2013–2023 (Fig. 9c) consistent with increased salinity, which raises water density and reduces the height of the water column, thus lowering sea level. This intensification, as the GCLME transitions toward the Benguela system, underscores the growing dominance of mass-related SLR, compounded by thermal expansion and freshwater influxes, which are both projected to intensify under ongoing climate change55,58.
The BCLME (Fig. 6c), stretching along the coasts of Angola, Namibia, and South Africa, is a wind-driven upwelling system and one of the world’s four major eastern boundary current upwelling regions59. From 1993 to 2023, the region recorded SLA trend of 2.98 ± 0.05 mm/yr (Fig. 6c), slightly below the GMSL. This rise is dominated by manometric (mass) contributions (2.52 ± 0.05 mm/yr), accounting for 85% of the total increase. A significant portion of the mass-driven rise is attributed to gravitational redistribution from Antarctic ice melt, which disproportionately affects the South Atlantic, and to regional upwelling dynamics that modulate local sea level55,57. Steric contributions remain modest (0.34 ± 0.03 mm/yr, 15%) due to the upwelling of cooler, nutrient-rich waters that suppress thermosteric expansion55. Thermosteric expansion is measured at 0.46 ± 0.03 mm/yr, but this is further reduced by slight halosteric contraction (−0.12 ± 0.02 mm/yr), indicating a net reduction in sea level contribution, likely driven by increased salinity due to enhanced evaporation or reduced freshwater input53. This balance of forces reflects the region’s sensitivity to both large-scale cryospheric changes (such as Antarctic meltwater) and local oceanographic processes (such as persistent upwelling)55. Decadal variability reveals a strong acceleration in SLA, rising from 2.13 ± 0.22 mm/yr in 1993–2002 (Figs. 9a) to 4.90 ± 0.17 mm/yr in 2013–2023 (Fig. 9c) more than doubling over the period, with a 2.3-fold increase. Early in the record, SLA was mainly driven by thermosteric expansion (2.65 ± 0.20 mm/yr) amid negligible or even negative manometric input (-0.23 ± 0.13 mm/yr). By the most recent decade, mass contributions surged 13-fold to 3.19 ± 0.10 mm/yr, reflecting intensified Antarctic meltwater input and the increasing dominance of mass-driven SLR in the region. Thermosteric trends also rose to 2.98 ± 0.16 mm/yr but were offset by strong halosteric contraction (−1.27 ± 0.09 mm/yr), driven by increased salinity, thereby reducing the net steric contribution to 15% of total SLR.
Indian Ocean LMEs
The ACLME, a warm western boundary current along South Africa’s east coast, presents a SLA trend of 3.00 ± 0.09 mm/yr (Fig. 7a), ranking sixth among the seven African LMEs analyzed, slightly above the BCLME. This long-term SLA trend is primarily driven by manometric contributions, which account for 2.30 ± 0.05 mm/yr (~77%). These mass-driven changes are attributed to regional ocean mass redistribution, influenced by the intense eddy activity characteristic of the ACLME. Steric contributions account for the remaining ~23% (0.70 ± 0.07 mm/yr), but their influence is comparatively modest. Within the steric component, thermosteric expansion ranges from 0.45 ± 0.03 to 0.67 ± 0.08 mm/yr, reflecting upper-ocean warming. However, this warming effect is dampened by persistent eddy-induced cooling and vertical mixing, which reduce the net thermal expansion60. Halosteric effects are minimal to slightly negative, ranging from −0.10 ± 0.02 to 0.02 ± 0.02 mm/yr (Fig. 7a), indicating weak salinity-driven contributions that marginally oppose thermal expansion. These effects further limit the overall steric contribution to the SLA trend. The region’s dynamic oceanography is characterized by strong decadal variability, driven by shifts in eddy activity, mass inflow, and upper-ocean heat content. During the period 1993–2002 (Fig. 9a), SLA exhibited a negative trend of −1.72 ± 0.65 mm/yr, driven primarily by strong cooling eddies and a large negative manometric contribution (−3.10 ± 0.20 mm/yr), while the thermosteric term was modestly positive (+1.45 ± 0.55 mm/yr) and the halosteric term slightly negative (−0.07 ± 0.06 mm/yr). These modest steric offsets were insufficient to counter the mass loss. This negative phase reflects reduced ocean mass input, linked to weakened current strength and shifts in regional atmospheric forcing, consistent with broader climate variability along the southeastern African coast.
Fig. 7: Regional sea level budget components for the Indian Ocean LMEs.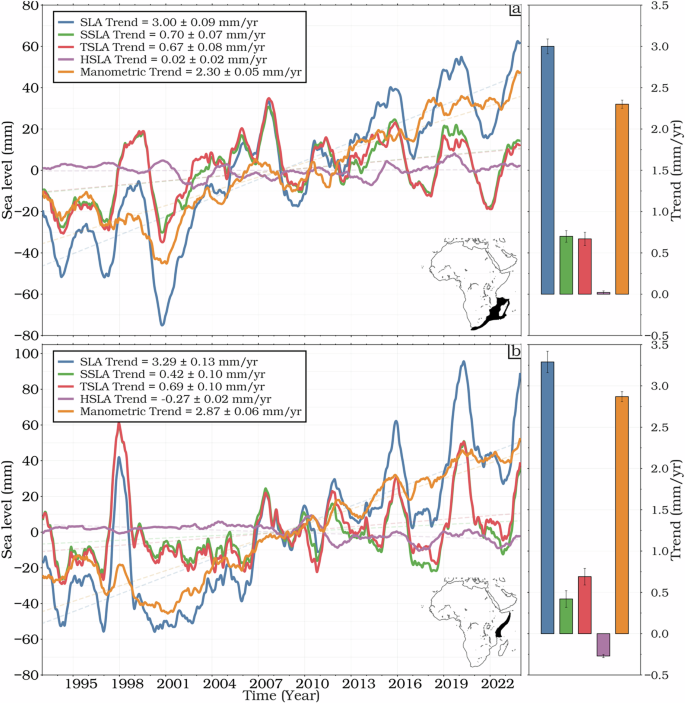
Temporal evolution of sea level budget components for a the Agulhas Current LME (ACLME) and b the Somali Coastal Current LME (SCCLME) from 1993 to 2023. Contributions shown are total Sea-Level Anomaly (SLA; blue line), steric (SSLA; green line), thermosteric (TSLA; red line), halosteric (HSLA; purple line), and manometric (orange line). All time series are smoothed with a 13-month low-pass filter.
In contrast, the period 2003–2012 saw a sharp rise in SLA, with trends reaching 2.81 ± 0.35 mm/yr (Fig. 9b). This increase was supported primarily by rising manometric contributions (2.81 ± 0.18 mm/yr), associated with intensified mass inflow into the region. This positive shift aligns with strengthened eddy activity and increased regional circulation, which enhanced ocean mass accumulation and contributed to upper-ocean warming despite persistent mixing. Between 2013 and 2023, SLA stabilized at 1.12 ± 0.39 mm/yr, with mass contributions (2.45 ± 0.13 mm/yr) continuing to dominate (Fig. 9c). However, thermosteric trends remained negative (−2.02 ± 0.32 mm/yr), suppressing steric input to just 23% of the total rise. This underscores the ACLME’s sensitivity to dynamic ocean processes, where local steric effects are frequently modulated by turbulent mixing and eddy variability.
Along East Africa’s Indian Ocean coast, the SCCLME unveils a SLA trend of 3.29 ± 0.13 mm/yr, ranking third among African LMEs (Fig. 7b). This trend is primarily driven by manometric contributions, which dominate the signal at 2.87 ± 0.06 mm/yr, accounting for 87% of the total rise. These mass-driven changes are largely attributed to global ice mass loss and monsoon-enhanced circulation, underscoring the critical role of ocean mass in shaping regional sea-level dynamics61,62. While smaller in magnitude, the steric contribution also plays a role in the SLA trend, with a net steric contribution of 0.42 ± 0.04 mm/yr. This is primarily driven by thermosteric expansion, which contributes 0.50 ± 0.04 mm/yr, reflecting modest ocean warming in the region. In contrast, halosteric effects are negligible, with a slight negative trend of –0.08 ± 0.02 mm/yr, indicating that increased salinity (density) slightly offsets the thermosteric expansion. This interplay between steric and manometric components highlights the dominance of mass-driven processes in the SCCLME, while steric contributions remain secondary. The sea-level budget also reveals pronounced decadal variability, reflecting the dynamic interplay of physical processes over time. During the period 1993–2002 (Fig. 9a), SLA trends were negative at –1.90 ± 0.88 mm/yr, driven by declines in both manometric (–2.97 ± 0.24 mm/yr) and thermosteric (1.01 ± 0.79 mm/yr) contributions. This period of reduced SLR coincided with weak monsoonal forcing63, which likely suppressed ocean circulation and upper-ocean heat content, reducing both mass and steric contributions. In contrast, the period 2003–2012 marked a sharp acceleration in SLA, with trends peaking at 5.92 ± 0.44 mm/yr (Fig. 9b). This dramatic increase is likely to be driven by strengthened monsoonal winds64 and enhanced ocean warming, as reflected in significant gains in both manometric (3.93 ± 0.12 mm/yr) and thermosteric (2.28 ± 0.43 mm/yr) contributions. The intensified monsoonal forcing during this decade likely enhanced upper-ocean heat content and circulation, amplifying both steric and mass-driven SLR. The most recent decade, 2013–2023, shows a sustained SLA trend of 4.72 ± 0.67 mm/yr (Fig. 9c), slightly lower than the previous decade but still elevated. This trend remains primarily driven by manometric contributions (3.44 ± 0.15 mm/yr), which continue to dominate the sea-level budget with an 87% share.
However, the thermosteric contribution decreased to 1.50 ± 0.25 mm/yr, reflecting a slight reduction in ocean warming compared to the previous decade. Despite this decline, the dominance of mass-driven processes persists, underscoring the critical role of global ice mass loss and monsoonal dynamics in shaping regional sea-level trends. Looking ahead, the anticipated succession of El Niño and La Niña phases is expected to intensify interannual variability in the SCCLME. These climate oscillations are likely to modulate monsoonal wind patterns, upwelling strength, and upper-ocean heat content, potentially amplifying both thermosteric and manometric contributions to regional SLR.
Semi-Enclosed Basin LMEs
The REDLME exhibits the highest SLA trend among African LMEs, measured at 3.91 ± 0.13 mm/yr (Fig. 8a). This pronounced trend is primarily driven by the manometric contribution (2.06 ± 0.08 mm/yr), which accounts for 53% of the total rise, while thermosteric expansion (1.84 ± 0.09 mm/yr) accounts for 47%. The confined bathymetry and limited water exchange of the Red Sea enhance heat retention, amplifying upper-ocean warming and contributing significantly to the observed thermosteric trends. In contrast, halosteric effects (0.01 ± 0.02 mm/yr) are negligible, indicating minimal salinity-driven density changes and limited impact on steric sea level variations in this region. Together, the steric contribution totals 1.85 ± 0.09 mm/yr, underscoring the combined influence of temperature and salinity on SLR in this region. The decadal variability of SLA in the Red Sea LME highlights the dynamic interplay between regional temperature, salinity, and mass-driven processes. During the period 1993–2002 (Fig. 9a), SLA exhibited a strongly negative trend of −7.14 ± 0.51 mm/yr, driven by significant declines in both thermosteric (−4.27 ± 0.27 mm/yr) and manometric (−3.25 ± 0.37 mm/yr) contributions. This period of negative trends reflects regional cooling and reduced mass inputs, likely linked to weakened trade winds65 and lower heat retention. In contrast, the period 2003–2012 (Fig. 9b) marked a dramatic reversal, with SLA peaking at 6.18 ± 0.59 mm/yr. This sharp increase was driven by thermosteric contributions (2.89 ± 0.60 mm/yr), reflecting intensified upper-ocean warming, and manometric contributions (2.66 ± 0.27 mm/yr), associated with wind-driven mass inflow. The warming trends during this decade highlight the Red Sea’s sensitivity to regional and global climate forcing, as its confined geography amplifies heat accumulation and limits heat dissipation. By the period 2013–2023 (Fig. 9c), SLA trends stabilized at 3.55 ± 0.43 mm/yr, with thermosteric expansion (3.23 ± 0.40 mm/yr) emerging as the dominant driver. During this time, manometric contributions dropped to 0.01 ± 0.42 mm/yr, indicating a reduced influence of mass-driven processes, such as wind-driven inflow or regional mass redistribution. The sustained thermosteric trends, however, underscore the persistent warming of the Red Sea’s water column, which continues to drive SLR in the absence of significant salinity-driven or mass-driven changes. The observed SLA trends in the Red Sea LME are closely tied to the region’s unique oceanographic conditions, limited water exchange, and sensitivity to atmospheric forcing. The strong connection between SLA and temperature trends in the water column highlights the critical role of heat retention in driving thermosteric expansion. While salinity trends remain minimal, their slight variability contributes to the overall steric balance. The decadal shifts in SLA further emphasize the influence of regional climate variability, including trade wind patterns and heat fluxes, on the Red Sea’s dynamic sea-level budget.
Fig. 8: Regional sea level budget components for the Red Sea and Mediterranean Sea LMEs.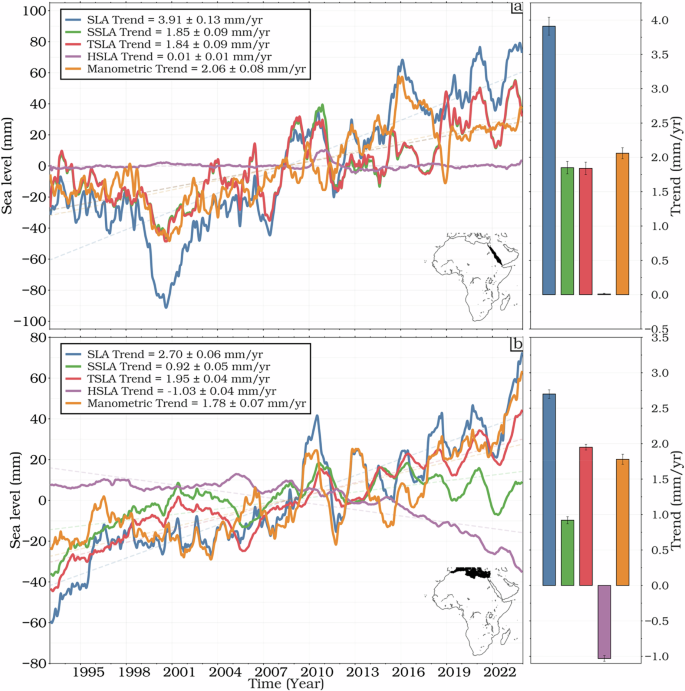
Temporal evolution of sea level budget components for a the Red Sea LME (REDLME) and b the Mediterranean Sea LME (MEDLME) from 1993 to 2023. Contributions shown are total Sea-Level Anomaly (SLA; blue line), steric (SSLA; green line), thermosteric (TSLA; red line), halosteric (HSLA; purple line), and manometric (orange line). All time series are smoothed with a 13-month low-pass filter.
Fig. 9: Decadal sea level budgets across African LMEs.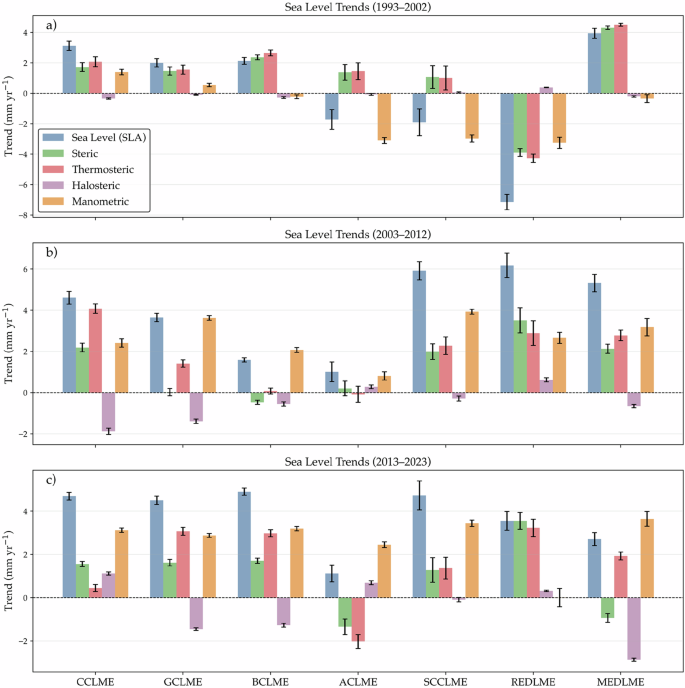
Histograms of decadal sea-level budgets for a 1993–2002, b 2003–2012, and c 2013–2023 across Africa’s LMEs.
The MEDLME, the northernmost of the African LMEs, exhibits the lowest SLA trend among them, with an average rise of 2.70 ± 0.06 mm/yr from 1993 to 2023 (Fig. 8b), representing the lowest trends across African LMEs during the analysis period (see Table 1). This reduced SLA trend is primarily attributed to strong negative halosteric effects (-1.03 ± 0.04 mm/yr) caused by reduced Nile River discharge and high evaporation rates, which increase salinity and density, thereby counteracting thermosteric expansion. In contrast, other African LMEs, such as the Red Sea (3.91 ± 0.13 mm/yr) and the Guinea Current (3.41 ± 0.05 mm/yr), exhibit higher SLA trends due to the dominance of mass-driven contributions and weaker salinity-driven suppression. The manometric contribution in the Mediterranean, which includes the effects of oceanic mass change and redistribution and changes in bottom pressure caused by ocean currents55, accounts for 1.78 ± 0.07 mm/yr, representing 66% of the total SLA trend. Groundwater extraction and tectonic activity may also contribute to the residual trend. Meanwhile, thermosteric expansion contributes 1.95 ± 0.04 mm/yr, but this is significantly offset by salinity-driven contraction, resulting in a net steric contribution of 0.92 ± 0.05 mm/yr (34%). Decadal trends reveal substantial variability in SLAs, reflecting the dynamic interplay of physical oceanographic processes. Between 1993 and 2002 (Fig. 9a), SLA rose at 3.94 ± 0.32 mm/yr, primarily driven by strong thermosteric expansion (4.50 ± 0.10 mm/yr) associated with upper-ocean warming66,67, while manometric contributions were minimal (−0.35 ± 0.26 mm/yr), underscoring the dominance of temperature-induced changes during this period. From 2003 to 2012 (Fig. 9b), SLA accelerated to 5.32 ± 0.42 mm/yr, coinciding with a significant rise in manometric contributions (3.18 ± 0.42 mm/yr) linked to ocean mass redistribution, bottom pressure changes, and wind-driven circulation68,69. Meanwhile, steric contributions weakened to 2.13 ± 0.22 mm/yr as emerging negative halosteric trends (−1.88 ± 0.15 mm/yr) began to offset thermosteric expansion. In the Mediterranean Sea, SLA deceleration was primarily driven by intensified salinity effects: negative halosteric trends, indicating increased salinity, reduced SLA by 0.82 mm/yr, thereby diminishing both thermosteric and manometric contributions66,70.
Table 1 SLA and contributing trends from 1993 to 2023 (mm/yr)
This highlights the Mediterranean as a key region for understanding salinity-driven suppression of SLR. During the most recent decade (2013–2023, Fig. 9c), SLA growth slowed to 2.71 ± 0.30 mm/yr, representing a 31% decrease from the 2003–2012 peak and 1.24 mm/yr below the early period’s rate. This decline reflects a shift in ocean dynamics, with steric contributions accounting for only 34% of the total SLA during this period. Negative steric trends (−0.93 ± 0.20 mm/yr), dominated by halosteric suppression (−2.86 ± 0.07 mm/yr), played a key role in this slowdown. While unusually large for a halosteric contribution, this value is supported by the data and may reflect intense regional salinification. Although manometric contributions increased to 3.64 ± 0.34 mm/yr, their effect was largely offset by the persistent influence of salinity. The Mediterranean’s low SLA trend is justified by its unique salinity-driven suppression of SLR, which distinguishes it from other African LMEs where mass-driven SLR typically dominates. For example, the Red Sea exhibits the highest SLA trend (3.91 ± 0.13 mm/yr, Fig. 8a) due to strong manometric contributions from ice melt and water mass redistribution, while the Guinea Current (3.41 ± 0.05 mm/yr, Fig. 6b) and Canary Current (3.30 ± 0.05 mm/yr, Fig. 6a) are similarly influenced by mass-driven processes. In contrast, the Mediterranean’s sensitivity to hydrological changes, including reduced riverine input, high evaporation, and regional climate variability, results in a distinct response characterized by salinity-driven contraction. The inclusion of manometric contributions, which encompass oceanic mass redistribution, bottom pressure changes, and local vertical land movements, helps disentangle the competing drivers of SLA in this region and reinforces the central role of salinity changes in modulating sea-level trends.
Ocean-atmosphere interactions and sea level variability in African LMEs
Climate modes drive large-scale patterns of sea level variability across ocean basins, as noted by Han et al.71. In the context of Africa’s seven LMEs, the influence of these modes varies between the open ocean and coastal regions, particularly along the EBUS of the Canary and Benguela Currents. SLAs along these eastern boundaries are predominantly influenced by remote and local wind forcing, which propagates through equatorial and coastal waveguides14,34. In contrast, SLAs in the interior of these LMEs are driven by open-ocean forcing that propagates westward from the eastern boundaries. Consequently, coastal sea level variability in African LMEs is expected to correlate strongly with climate modes that are prominent in the tropics and with atmospheric centers of action that modulate longshore winds and sea level pressure.
The regression of SLA with respect to climate indices is shown in Fig. 10 (the corresponding correlation map is provided in Supplementary Fig. 3). Starting with the Atlantic Niño (ATL3) in Fig. 10a, a strong positive regression emerges along both Atlantic and equatorial domains, especially along the Gulf of Guinea and extending westward. This pattern reflects the role of ATL3 in modulating SLA through SST anomalies, which drive thermal expansion and mass redistribution in the ocean. The influence of ATL3 is most pronounced in the GCLME, BCLME, and SCCLME, but it diminishes both northward toward the Canary and southward toward the Benguela Current, indicating a more localized impact of ATL3 on SLA variability, largely confined to the tropics. Transitioning to the Tropical North Atlantic (TNA) index in Fig. 10b, the regression map reveals pronounced positive anomalies along the northern tropical Atlantic, with significant effects extending into the Canary Current LME and the Mediterranean Sea. This underscores the importance of SST anomalies in the Tropical North Atlantic, which drive SLA variability through atmospheric teleconnections and oceanic processes such as wind-driven circulation and heat fluxes. However, the influence of TNA fades in the southern LMEs, including GCLME, BCLME, ACLMEs, and SCCLME, highlighting the regional specificity of this index and its primary relevance to the northern Atlantic margin with no impact on the REDLME. The Tropical Atlantic SST Gradient Index (TASI), shown in Fig. 10c, captures the meridional SST gradient in the Atlantic and exhibits a dipolar pattern, with positive regression coefficients in the northern Atlantic while not significant as the TNA and negative coefficients in the southern Atlantic. This spatial structure emphasizes the role of TASI in modulating SLA through changes in the interhemispheric SST gradient, which in turn affects wind patterns and ocean circulation. The Canary and Benguela Current LMEs are particularly sensitive to TASI, as these regions are directly influenced by shifts in the Atlantic dipole mode, while the Mediterranean LME and other LMEs remain less affected. Moving eastward, Fig. 10d presents the regression of SLA on the Indian Ocean Dipole (DMI). Here, strong positive coefficients dominate the western Indian Ocean, especially along the Somali Current LME and extending into the Agulhas Current LME. This dipolar pattern reflects the DMI’s capacity to drive SLA variability through SST changes and associated atmospheric circulation, with the Somali Current LME being especially responsive to the western Indian Ocean’s warming and mass redistribution. The Atlantic LMEs, by contrast, show minimal response to DMI, underscoring the basin-specific nature of this influence. The Western Tropical Indian Ocean (WTIO) index, depicted in Fig. 10e, further reinforces the dominance of the western Indian Ocean, with a pronounced positive regression along the Somali and Agulhas Current LMEs. The influence of WTIO even extends into the Red Sea Current outlets through the Gulf of Aden, highlighting the significant role of SST anomalies in this region in driving SLA variability through thermal expansion and changes in ocean circulation. However, the impact of WTIO diminishes toward the northern LMEs, such as the Mediterranean and Canary Currents, again reflecting the regional specificity of this index. A similar spatial pattern is observed for the Southwest Indian Ocean (SWIO) index in Fig. 10f, where sporadic positive regression coefficients are concentrated in the southwestern Indian Ocean. The Agulhas Current LME is particularly affected by SWIO, as this region is directly influenced by warming and mass redistribution in the southwestern Indian Ocean, mostly along the Madagascar coastal domain. In contrast, the Atlantic LMEs remain largely unaffected by SWIO, further emphasizing the spatial selectivity of Indian Ocean climate drivers. The influence of the central Pacific is captured by the Niño3.4 index in Fig. 10g, which shows a widespread impact across both the Indian Ocean and less impact on the Atlantic Ocean. Positive regression coefficients are evident in the western Indian Ocean close to the DMI patterns. This pattern reflects the teleconnections between the Pacific and other ocean basins, where changes in atmospheric circulation and oceanic processes driven by Pacific SST variability propagate their effects. The Somali and Red Sea Current LMEs are particularly sensitive to Niño3.4, while the Mediterranean and Agulhas LMEs remain less affected, indicating the reach but also the limits of Pacific influence. The Pacific Decadal Oscillation (PDO) (Fig. 10h) exhibits a notable large-scale influence on sea level variability, primarily across the Indian Ocean sector of the African LMEs. Positive regression coefficients are particularly evident in the Somali, Red Sea, and Agulhas Current LMEs, indicating that positive phases of the PDO typically associated with cooler SSTs in the western Pacific and warmer conditions in the eastern Pacific coincide with SLR in these regions. This response reflects enhanced Indian Ocean warming during positive PDO phases, which promotes upper-ocean thermal expansion and SLAs71,72. The Agulhas Current LME’s sensitivity may be linked to PDO-induced modulation of the Indian Ocean Walker circulation and subtropical gyre dynamics, influencing the transport and convergence of water masses along southeast Africa. In contrast, Atlantic LMEs, including the Guinea Current and Canary Current systems, show limited correlation with PDO, likely due to weaker atmospheric teleconnections between the Pacific and Atlantic basins in decadal timescales73. The Southern Annular Mode (SAM) (Fig. 10i), which reflects the north–south displacement of the westerly wind belt encircling Antarctica, shows no statistically significant impact on sea level trends across any African LMEs. This limited influence is consistent with previous findings that SAM-driven sea level variability is largely confined to southern extratropical latitudes, particularly the Southern Ocean and the high-latitude South Atlantic and Indian sectors74. As a result, the absence of significant regression patterns in African LMEs suggests that SAM’s dynamical effects on wind stress, Ekman transport, and associated mass redistribution do not strongly project onto the sea level variability of equatorial or subtropical African coastal systems.
Fig. 10: Relationship between African sea level and major climate indices.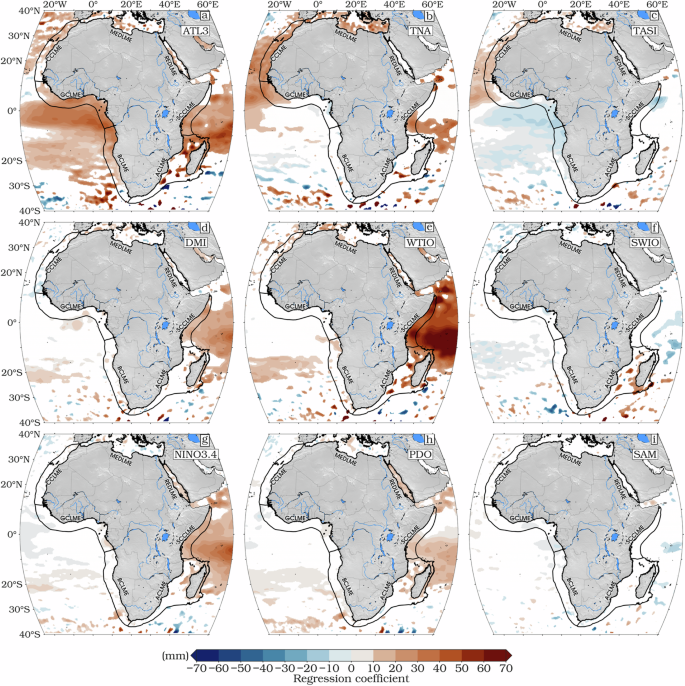
Linear regression coefficients (mm) of sea level over Africa and its LMEs with respect to a ATL3, b TNA, c TASI, d DMI, e WTIO, f SWIO, g NINO 3.4, h PDO, and i SAM. White areas (white dots) indicate regions where regression coefficients are not statistically significant at the 95% confidence level.