
Mice
All mice were handled in accordance with guidelines of the NIMH (ASP-SLCR-01) and NINDS (ASP 1344) Animal Care and Use Committees. Mice were housed throughout the experiment in a temperature- and humidity-controlled environment, with temperature maintained between 21–23 °C and relative humidity between 45–55%. Mice were of either sex and 2–8 months old for all the experiments. The experiments were repeated multiple times, and all were conducted in a blinded manner. All replication attempts were successful.
Male and female Opn4cre/cre mice showed no difference in phase shift magnitudes (Extended Data Fig. 1p; one-way ANOVA, P = 0.58). Opn4cre/cre and Opn4cre/+ mice exhibited similar behavioural phase shifts in response to chemogenetic activation of ipRGCs (Extended Data Fig. 1m–p; one-way ANOVA, P = 0.22). As a result, we combined the data from both genotypes for the phase shift quantifications in Fig. 1h and plotted as Opn4cre mice. In situations that only Opn4cre/+ mice were used we described their specific genotype.Opn4cre mice were crossed with Brn3bDTA mice to generate Opn4cre/+;Brn3bDTA/+ mice (we refer to these as Opn4cre;Brn3bDTA mice)9,28. Littermate Opn4cre/+;Brn3b+/+ mice were included in the Opn4cre group. A similar cross was used to generate Opn4cre/+;Adcyap1flox/flox mice (we refer to these as Opn4cre;Adcyap1fl mice)48.
The sOpn4flpO Knock-in mouse line was generated by the Jackson Laboratory using CRISPR–Cas9-based strategy. The line is in the C57BL/6J genetic background. A P2A-FlpO recombinase DNA sequence was inserted just prior to the stop codon of the mouse Opn4 gene (short isoform (sOpn4), 466 amino acids, Ensembl ID NSMUST00000168444.8). ipRGCs that express the Opn4 short-form transcript will produce both the sOpn4 protein (short-form) and the FlpO protein simultaneously (see Supplementary Fig. 1).
sOpn4flpO crossed with Brn3bcre mice (Jackson Strain 030357) or Ai65 mice (Jackson Strain 021875) to generate Brn3bcre; sOpn4flpO mice and sOpn4flpO;Ai65 mice (for different wavelength light electrophysiology experiment), respectively.
Wild-type (Jackson strain 101043) mice were used for sunlight, blue and violet light exposure. Except during the experiments, mice were housed in 12 h:12 h light:dark cycles. Food and water were provided ad libitum.
Intravitreal injections
Mice were anaesthetized with isoflurane (or a ketamine/xylazine mixture; 5:1 w/w; 1 mg ketamine per kg body weight, in case of ipRGC electrophysiological recordings) and placed in a stereotaxic frame. A digital injector (Nanojector III, Drummond Scientific Company) mounted to the stereotaxic frame was used to deliver the chemogenetic activation viral vectors to the eye via a glass needle. The glass needle was used to pierce the sclera of the eye posterior to the choroid boundary and lowered into the vitreal chamber. After viral delivery the needle was kept in place for ~30 s before being slowly removed from the eye. Mice were returned to their home cages for more than two weeks to allow for chemogenetic activator expression. 1.5 μl/eye of AAV2-hSyn-DIO-hM3D(Gq)-mCherry (a gift from B. Roth, RRID:Addgene_44361) was used for molecular and behavioural studies. To activate only BRN3B-positive ipRGCs, eye of Brn3bcre;sOpn4flpO mice were infected with pAAV-hSyn-con/fon-DREADD Gq-mCherry (Addgene #200661).
ipRGC chemogenetic activation
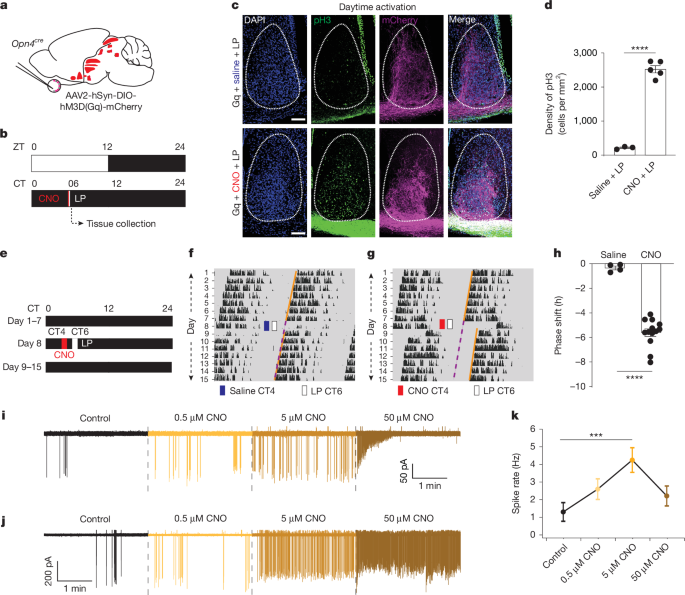
Mice were grasped by the scruff of their neck under dim red light and given intraperitoneal injections of either saline or CNO (1 mg kg−1) (Sigma-Aldrich, C0832-5MG). For immunohistochemistry experiments, mice received intraperitoneal injections at CT6. For subjective day phase shift experiments, mice were given the intraperitoneal injection at CT4 to reduce the possibility for CNO to persist in the blood plasma into the subjective night. In both cases, mice were immediately returned to their home cages and then exposed to bright overhead broad-spectrum LED (1.49 × 10¹³−1.94 × 10¹⁵ photons cm−2 s−1) at CT 6 for 15 min. For subjective night phase shift experiments, the intraperitoneal injection and light pulse times were at CT12 and CT14, respectively, to be consistent with subjective day experiments.
Stereotaxic brain injections
Gq-Opn4cre mice were anaesthetized with isoflurane and placed in a stereotaxic frame. A digital injector (Nanojector III, Drummond Scientific Company) mounted to the stereotaxic frame was used to deliver 100 nl of AAV8-hSyn-hM4D(Gi)-mCherry to the LGN bilaterally via a pulled glass needle (10 μl microcapillary tube, Sigma P0674). The needle was lowered through small holes drilled into the skull to the coordinates Bregma medial-lateral (ML) ±2.45 mm, anterior-posterior (AP) −2.60 mm, dorsal-ventral (DV) −3.50 mm and left in place for 10 min after viral delivery before being slowly removed from the brain. Mice were returned to their home cages for at least 2 weeks to allow for hM4D(Gi)-mCherry expression. AAV8-hSyn-hM4D(Gi)-mCherry was a gift from B. Roth (Addgene viral prep #50475-AAV8; RRID:Addgene_50475)
Wheel-running activity for phase measurements
Mice were singly housed in a cage with a running wheel under constant darkness. Mice voluntarily run on the wheel during the subjective night, their active phase, and wheel revolutions are recorded with Vital-View software (Mini Mitter) to measure circadian time. By definition, the daily onset of activity in mice is circadian time 12 (CT12), such that the subjective day is CT0–CT12, and the subjective night is CT12–CT24. The phase shift was calculated using ClockLab software (Actimetrics 6.0.53) by measuring the phase angle for seven days before and after the saline or CNO injections. The activity during the 24 h immediately after the injections were not included in the phase angle measurements.
Long duration light pulse
Mice were kept in darkness overnight and then exposed to bright overhead broad-spectrum LED (1.49 × 10¹³−1.94 × 10¹⁵ photons cm−2 s−1) during the subjective day for 1 h, 3 h and 6 h durations. These light pulses began at CT5, CT3 and CT0, respectively. All light pulses were timed to end at CT6 to keep the circadian phase consistent across groups.
Sunlight, blue light and violet light exposure
Mice were singly housed in a cage with a running wheel under constant darkness. On the day of the experiment the cage with mouse was taken out from the bay at CT6 and exposed to either a 15 min Sunlight pulse (1.36 × 10¹⁸ photons cm−2 s−1), blue light pulse (λmax = 470 nm; 1.88 × 10¹³–5 × 10¹⁴ photons cm−2 s−1; Light Source: ThorLabs M470L5; Driver: ThorLabs LEDD1B) or a violet light pulse (λmax = 375 nm; 2 × 10¹³–5.1 × 10¹⁴ photons cm−2 s−1; Light Source: Mightex P/N BLS-LCS-0385-04-22; LED Driver: Mightex M/N:SLA-1000-2). After exposure, the cage with mouse was promptly returned to its original location and placed back on the wheel.
For violet and blue light experiments, mice remained in their home cages with cage tops removed, and the cages were positioned directly under a fixed light source so that the beam centre aligned with the centre of the cage. For sunlight exposure, mice were placed at CT6 (around midday) in an open field in their home cages, which were fitted with a transparent plastic mesh top. The mesh top reduced the sunlight luminance by around 14%, with minimal influence on spectral content. During all light exposures, the mice displayed normal exploratory and locomotor behaviours.
It should be noted that intensities for behavioural experiments reflect corneal irradiance. Using measurements of steady state pupil sizes under experimentally matched conditions for the various LEDs and the following equation, retinal irradiance was estimated for each LED using the following attenuation factors49: violet (1.8 × 10¹³ photons cm−2 s−1), 0.028; blue (1 × 10¹³ photons cm−2 s−1), 0.041; white (1.3 × 10¹⁵ photons cm−2 s−1), 0.009.
$${I}_{{\rm{R}}}={I}_{{\rm{C}}}\tau \frac{{\rm{\pi }}{{D}_{\mathrm{pupil}}}^{2}}{4{A}_{\mathrm{retina}}},$$
where IR is retinal irradiance, IC is corneal irradiance, τ is optical medium transmittance (violet, 0.4; blue, 0.48; white, 0.6)50, Dpupil is pupil diameter (violet, 1.2 mm; blue, 1.3 mm; white, 0.56 mm) and Aretina is the retinal area of the mouse eye51 (~16 mm).
Spectral data
The spectrum of sunlight, blue sky and all LEDs were measured with a broadband spectrometer (Thorlabs CCS200) in terms of relative power and low pass filtered using the box filter in IgorPro 8.04 (Wavemetrics). The spectrum for the various photoreceptors were derived using the Govardovskii template52 with peak wavelengths of 360, 467, 493 and 508 nm for s-cones, melanopsin, rods and m-cones, respectively.
Immunohistochemistry
To examine peak H3 phosphorylation or FOS and mCherry expression mice were perfused with 4% paraformaldehyde (PFA) either 15 min (for H3 phosphorylation) or 75 min (for FOS) after the end of the light exposure. Brains were post-fixed in 4% PFA overnight and then placed in 30% sucrose in phosphate buffered saline (PBS) solution for two days. Brains were frozen and cut into 40 µm sections for immunohistochemistry. Brain sections were first washed in 0.5% Triton X-100 in PBS (PBST). Sections were blocked in 10% bovine serum albumin (BSA in PBST) for 1 h and incubated overnight at 4 °C in primary antibody diluted in 2.5% BSA. Primary antibodies used were rabbit pH3 mAb (1:1,000; Cell Signaling Technology, 3377S) or rabbit FOS mAb (1:1000; Cell Signaling Technology; 2250S) and goat anti-tdTomato (1:1,000, LSBio, LS-C340696). Sections were then washed in PBST and incubated for 2 h in secondary antibody diluted in 2.5% BSA. Secondary antibodies used were donkey anti-rabbit Alexa Fluor 488 nm (1:500; Invitrogen; A21206) and donkey anti-goat 555 nm (1:500, Invitrogen, A21432). Sections were mounted in Flouromount-G with DAPI (ThermoFisher, 00-4959-52).
For H3 phosphorylation, before blocking in 10% BSA, the sections underwent antigen retrieval at 80 °C for 30 min in sodium citrate buffer (10 mM sodium citrate, 0.05% Tween 20, pH 6.0). Sections were cooled down at room temperature for approximately 20 min and then transferred to PBST for washing.
Images of brain sections were taken on a confocal microscope (Nikon, Eclipse Ti2). Images in the manuscript represent the maximal projections of a z-stack taken through an entire 40-μm-thick coronal brain section. Any contrast or brightness adjustments were applied to the entire image in Fiji53. To calculate the density of H3 phosphorylation or FOS in the SCN, the number of H3 phosphorylation or FOS-positive cells were divided by the total area of one lobe of the SCN. The SCN area was measured by outlining the lobe visible in the DAPI channel. Image measurements were done in Fiji (ImageJ2 v.2.16.0/1.54g).
Single-cell electrophysiology
Mice were dark-adapted overnight before experiments. Retina dissection and preparation, single-cell recording, and data analysis were done by closely following the method as described54. Following euthanasia, retinas were dissected under infrared light (940 nm) and mounted photoreceptor side down on the recording chamber. Tissues were perfused with oxygenated Ames medium (285 mOsm, 7–9 ml min−1) maintained at a temperature of 30–32 °C. Tdtomato-positive ipRGCs were visualized with two-photon laser excitation at 1,040 nm or 1,064 nm, ~3 mW post-objective laser power. M1 ipRGCs were identified by dendritic stratification in the OFF IPL. Recordings were made with an electronic amplifier (MultiClamp 700B, Molecular Devices) and signals were collected at a sample rate of 10 kHz and filtered at 4 kHz. The electrodes were filled with the same Ames medium as used in the bath, except for the recordings shown in Extended Data Fig. 1q, which used (in mM): 123 KCH3SO3, 10 HEPES, 1 MgCl2, 1 NaCl, 2 EGTA, 7 Phosphocreatine di(tris), 4 Mg-ATP, and 0.5 Na-GTP at 265–270 mOsm, pH = 7.4 with KOH. Light stimuli were presented using a customized 912 × 1,140-pixel digital projector (DLPLCR4500; Texas Instruments) driven by a 375 nm, 470 nm or white LED (ThorLabs) at a frame rate of 60 Hz55. Light intensities were adjusted to desired levels using a motorized neutral density filter wheel (FW102C, Thorlabs) and routed through the microscope (Scientifica Hyperscope or Zeiss LSM510) condenser, which was adjusted so that images were in focus at the level of the photoreceptors. For experiments comparing 375 and 470 nm activation of M1s (Extended Data Fig. 4c–h), a staircase of 1 min increment steps7 was presented with a single LED. After the first staircase, the prep was returned to darkness for 3–10 min to allow for recovery, followed by the same staircase protocol using the alternate LED. To control for history dependence, we alternated the LED ordering in different recordings, and report the key statistics split by LED order in Extended Data Fig. 4i–k. For chemogenetic activation, CNO (0.5, 5 and 50 µM) was added in the perfusion solution. We attempted to washout CNO at the end of these experiments but were unable to achieve recovery. It is possible that our inability to achieve recovery reflects the metabotropic nature of the underlying mechanisms and a slow washout of high concentration CNO. Post-recording visual inspection of the recorded cells revealed smooth and transparent membranes indicating that CNO had not killed the cells.
All electrophysiological data were analysed in MATLAB, using a custom written open-source package (http://www.github.com/SchwartzNU/SymphonyAnalysis). Spike traces were highpass filtered (cutoff frequency = 0.05 Hz) to remove baseline drift and spikes were detected using a z-score of six as a threshold. Spikes were then binned and converted to firing rates. For peak spike rate measurements data was binned into 1 s bins. Figures were constructed in IgorPro 8.04 (Wavemetrics).
Statistics
The statistical tests used are listed in the main text and figure legends. All graphs show individual mice and report the mean ± s.e.m. Plots and analysis were done with Prism (GraphPad Prism v.9.4.1) and Igor Pro 8.04 (Wavemetrics).
Reporting summary
Further information on research design is available in the Nature Portfolio Reporting Summary linked to this article.