
Jan 19, 2026
IndexBox has just published a new report: United Kingdom – Non-Sugary Non-Alcoholic Beverages excluding Milky Drinks and Juices – Market Analysis, Forecast, Size, Trends And Insights.
The UK market for non-sugary non-alcoholic beverages (excluding milky drinks and juices) is forecast to grow at a decelerating pace, with volume projected to reach 926M litres by 2035 at a 1.5% CAGR, and value to hit $1.6B at a 2.9% CAGR. In 2024, consumption was 788M litres, heavily reliant on imports of 854M litres, primarily from the Netherlands, Germany, and Belgium. Domestic production is small and declining, at 34M litres. Exports surged to 100M litres in 2024, mainly to Ireland. The market is characterized by a significant gap between high domestic consumption and low local production, filled by substantial imports.
Key Findings
Market forecast to grow to 926M litres by 2035, but growth decelerating to a 1.5% volume CAGRUK consumption heavily import-dependent, with 854M litres imported versus 34M litres produced domestically in 2024Top import sources are the Netherlands, Germany, and Belgium, accounting for 49% of volumeExports saw a sharp 91% increase in 2024, with Ireland as the primary destination taking 50% of volumeAverage import price declined to $1.5 per litre while export price fell to $1.7 per litre in 2024Market Forecast
Driven by increasing demand for non-sugary non-alcoholic beverages excluding milky drinks and juices in the UK, the market is expected to continue an upward consumption trend over the next decade. Market performance is forecast to decelerate, expanding with an anticipated CAGR of +1.5% for the period from 2024 to 2035, which is projected to bring the market volume to 926M litres by the end of 2035.
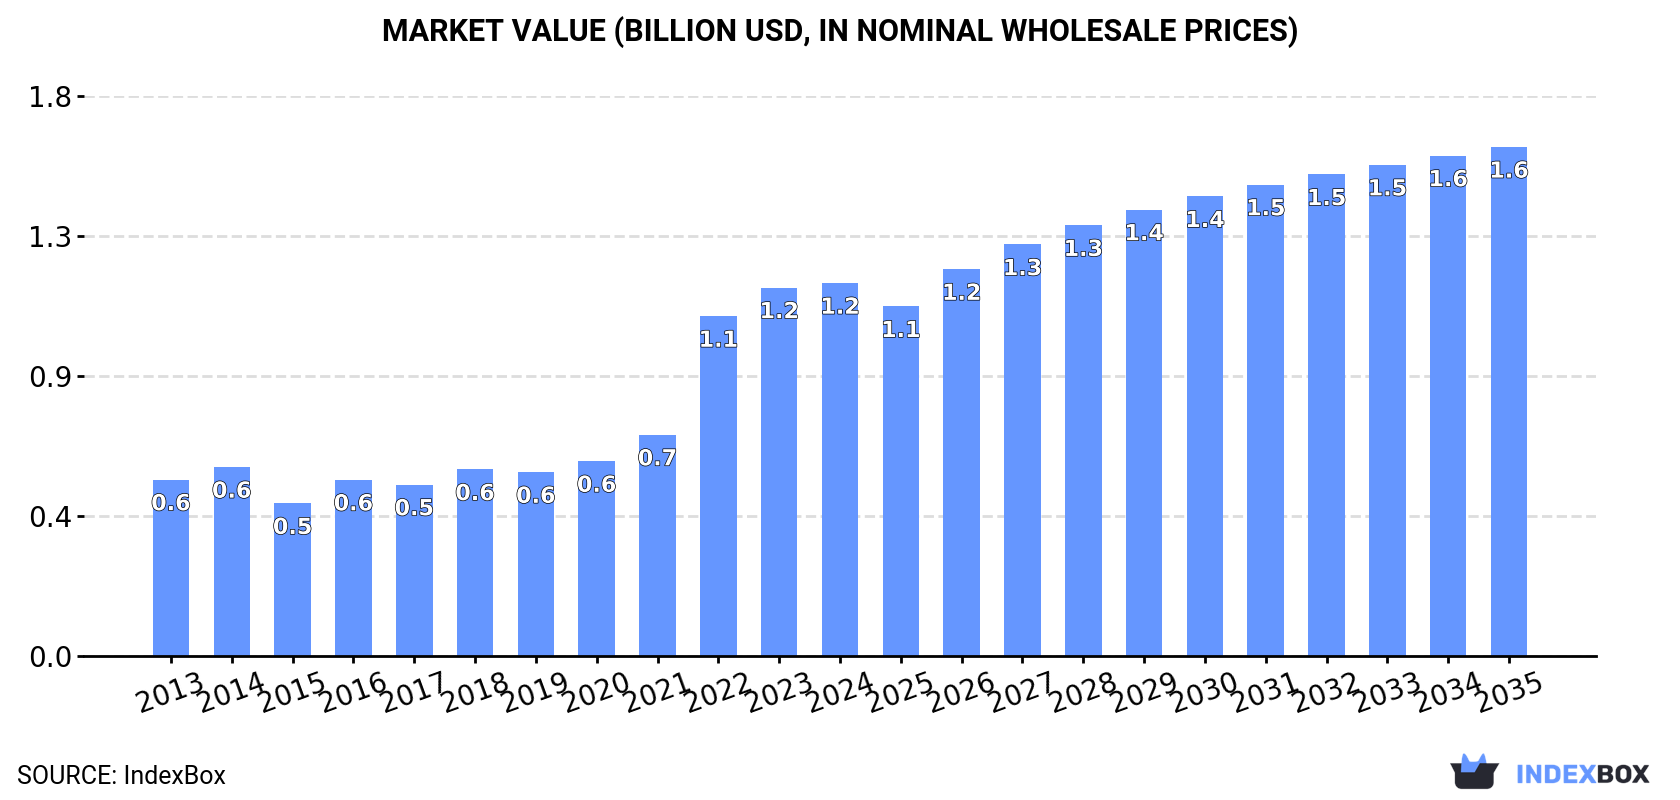
In value terms, the market is forecast to increase with an anticipated CAGR of +2.9% for the period from 2024 to 2035, which is projected to bring the market value to $1.6B (in nominal wholesale prices) by the end of 2035.
 ConsumptionUnited Kingdom’s Consumption of Non-Sugary Non-Alcoholic Beverages excluding Milky Drinks and Juices
In 2024, consumption of non-sugary non-alcoholic beverages excluding milky drinks and juices in the UK was estimated at 788M litres, increasing by 7.5% on the year before. Overall, consumption recorded a resilient increase. As a result, consumption reached the peak volume of 909M litres. From 2023 to 2024, the growth of the consumption of remained at a lower figure.
The revenue of the market for non-sugary non-alcoholic beverages excluding milky drinks and juices in the UK reached $1.2B in 2024, remaining stable against the previous year. This figure reflects the total revenues of producers and importers (excluding logistics costs, retail marketing costs, and retailers’ margins, which will be included in the final consumer price). Over the period under review, consumption recorded a prominent increase. Over the period under review, the market hit record highs in 2024 and is likely to see gradual growth in the immediate term.
ProductionUnited Kingdom’s Production of Non-Sugary Non-Alcoholic Beverages excluding Milky Drinks and Juices
In 2024, after four years of decline, there was growth in production of non-sugary non-alcoholic beverages excluding milky drinks and juices, when its volume increased by 1.5% to 34M litres. Over the period under review, production, however, recorded a slight decline. The pace of growth appeared the most rapid in 2018 when the production volume increased by 38%. Over the period under review, production of hit record highs at 48M litres in 2019; however, from 2020 to 2024, production failed to regain momentum.
In value terms, production of non-sugary non-alcoholic beverages excluding milky drinks and juices shrank to $56M in 2024 estimated in export price. In general, production, however, saw a relatively flat trend pattern. The growth pace was the most rapid in 2018 when the production volume increased by 36% against the previous year. Over the period under review, production of reached the maximum level at $69M in 2022; however, from 2023 to 2024, production stood at a somewhat lower figure.
ImportsUnited Kingdom’s Imports of Non-Sugary Non-Alcoholic Beverages excluding Milky Drinks and Juices
In 2024, the amount of non-sugary non-alcoholic beverages excluding milky drinks and juices imported into the UK rose remarkably to 854M litres, growing by 14% on the previous year. Overall, imports recorded prominent growth. The pace of growth appeared the most rapid in 2022 when imports increased by 86%. As a result, imports reached the peak of 920M litres. From 2023 to 2024, the growth of imports of remained at a lower figure.
In value terms, imports of non-sugary non-alcoholic beverages excluding milky drinks and juices rose notably to $1.3B in 2024. In general, imports recorded prominent growth. The most prominent rate of growth was recorded in 2022 with an increase of 50%. Over the period under review, imports of attained the maximum in 2024 and are likely to continue growth in the immediate term.
Imports By Country
The Netherlands (188M litres), Germany (125M litres) and Belgium (106M litres) were the main suppliers of imports of non-sugary non-alcoholic beverages excluding milky drinks and juices to the UK, with a combined 49% share of total imports. Ireland, Spain, Denmark, France, Italy, Sweden and Poland lagged somewhat behind, together accounting for a further 39%.
From 2013 to 2024, the most notable rate of growth in terms of purchases, amongst the main suppliers, was attained by Spain (with a CAGR of +33.6%), while imports for the other leaders experienced more modest paces of growth.
In value terms, the Netherlands ($328M), Germany ($243M) and Belgium ($114M) appeared to be the largest non-sugary non-alcoholic beverages excluding milky drinks and juices suppliers to the UK, together accounting for 54% of total imports. France, Denmark, Spain, Italy, Ireland, Sweden and Poland lagged somewhat behind, together accounting for a further 32%.
Spain, with a CAGR of +34.9%, saw the highest growth rate of the value of imports, among the main suppliers over the period under review, while purchases for the other leaders experienced more modest paces of growth.
Import Prices By Country
In 2024, the average import price for non-sugary non-alcoholic beverages excluding milky drinks and juices amounted to $1.5 per litre, waning by -6.4% against the previous year. Over the period under review, the import price recorded a mild decrease. The most prominent rate of growth was recorded in 2023 when the average import price increased by 34%. The import price peaked at $1.8 per litre in 2013; however, from 2014 to 2024, import prices failed to regain momentum.
Prices varied noticeably by country of origin: amid the top importers, the country with the highest price was France ($2 per litre), while the price for Ireland ($693 per thousand litres) was amongst the lowest.
From 2013 to 2024, the most notable rate of growth in terms of prices was attained by France (+5.7%), while the prices for the other major suppliers experienced more modest paces of growth.
ExportsUnited Kingdom’s Exports of Non-Sugary Non-Alcoholic Beverages excluding Milky Drinks and Juices
In 2024, the amount of non-sugary non-alcoholic beverages excluding milky drinks and juices exported from the UK soared to 100M litres, growing by 91% compared with 2023. Over the period under review, exports, however, showed a relatively flat trend pattern. Over the period under review, the exports of attained the maximum at 110M litres in 2015; however, from 2016 to 2024, the exports failed to regain momentum.
In value terms, exports of non-sugary non-alcoholic beverages excluding milky drinks and juices skyrocketed to $168M in 2024. Overall, exports continue to indicate a relatively flat trend pattern. Over the period under review, the exports of attained the peak figure at $178M in 2014; however, from 2015 to 2024, the exports failed to regain momentum.
Exports By Country
Ireland (50M litres) was the main destination for exports of non-sugary non-alcoholic beverages excluding milky drinks and juices from the UK, accounting for a 50% share of total exports. Moreover, exports of non-sugary non-alcoholic beverages excluding milky drinks and juices to Ireland exceeded the volume sent to the second major destination, Germany (7.7M litres), sevenfold. The United States (6.8M litres) ranked third in terms of total exports with a 6.8% share.
From 2013 to 2024, the average annual growth rate of volume to Ireland amounted to +6.0%. Exports to the other major destinations recorded the following average annual rates of exports growth: Germany (-1.9% per year) and the United States (+16.7% per year).
In value terms, Ireland ($59M) remains the key foreign market for non-sugary non-alcoholic beverages excluding milky drinks and juices exports from the UK, comprising 35% of total exports. The second position in the ranking was held by the United States ($21M), with a 12% share of total exports. It was followed by Germany, with a 6% share.
From 2013 to 2024, the average annual growth rate of value to Ireland amounted to +2.6%. Exports to the other major destinations recorded the following average annual rates of exports growth: the United States (+20.4% per year) and Germany (-3.5% per year).
Export Prices By Country
In 2024, the average export price for non-sugary non-alcoholic beverages excluding milky drinks and juices amounted to $1.7 per litre, shrinking by -24.7% against the previous year. Over the period under review, the export price, however, saw a relatively flat trend pattern. The growth pace was the most rapid in 2022 an increase of 34%. As a result, the export price reached the peak level of $2.2 per litre. From 2023 to 2024, the average export prices remained at a lower figure.
Prices varied noticeably by country of destination: amid the top suppliers, the country with the highest price was China ($4.2 per litre), while the average price for exports to Belgium ($813 per thousand litres) was amongst the lowest.
From 2013 to 2024, the most notable rate of growth in terms of prices was recorded for supplies to Austria (+7.8%), while the prices for the other major destinations experienced more modest paces of growth.
Source: IndexBox Market Intelligence Platform
This report provides a comprehensive view of the non-alcoholic beverage, not containing milk industry in the United Kingdom, tracking demand, supply, and trade flows across the national value chain. It explains how demand across key channels and end-use segments shapes consumption patterns, while also mapping the role of input availability, production efficiency, and regulatory standards on supply.
Beyond headline metrics, the study benchmarks prices, margins, and trade routes so you can see where value is created and how it moves between domestic suppliers and international partners. The analysis is designed to support strategic planning, market entry, portfolio prioritization, and risk management in the non-alcoholic beverage, not containing milk landscape in the United Kingdom.
Quick navigation
Key findings
Domestic demand is shaped by both household and industrial usage, with trade flows linking local supply to imports and exports.
Pricing dynamics reflect unit values, freight costs, exchange rates, and regulatory shifts that affect sourcing decisions.
Supply depends on input availability and production efficiency, creating a distinct national cost curve.
Market concentration varies by segment, creating different competitive landscapes and entry barriers.
The 2035 outlook highlights where capacity investment and demand growth are most aligned within the country.
Report scope
The report combines market sizing with trade intelligence and price analytics for the United Kingdom. It covers both historical performance and the forward outlook to 2035, allowing you to compare cycles, structural shifts, and policy impacts.
Market size and growth in value and volume terms
Consumption structure by end-use segments
Production capacity, output, and cost dynamics
Trade flows, exporters, importers, and balances
Price benchmarks, unit values, and margin signals
Competitive context and market entry conditions
Product coverageProdcom 11071950 – z Non-alcoholic beverages not containing milk fat (excluding sweetened or unsweetened mineral, aerated or flavoured waters)Prodcom 11071970 – Non-alcoholic beverages containing milk fatProdcom 110000Z1 – Non-alcoholic beverages, not containing milk, milk products and fats derived therefrom (excl. water, fruit or vegetable juices)Prodcom 11051010 – Non-alcoholic beer and beer containing . 0.5% alcoholCountry coverageCountry profile and benchmarks
This report provides a consistent view of market size, trade balance, prices, and per-capita indicators for the United Kingdom. The profile highlights demand structure and trade position, enabling benchmarking against regional and global peers.
Methodology
The analysis is built on a multi-source framework that combines official statistics, trade records, company disclosures, and expert validation. Data are standardized, reconciled, and cross-checked to ensure consistency across time series.
International trade data (exports, imports, and mirror statistics)
National production and consumption statistics
Company-level information from financial filings and public releases
Price series and unit value benchmarks
Analyst review, outlier checks, and time-series validation
All data are normalized to a common product definition and mapped to a consistent set of codes. This ensures that comparisons across time are aligned and actionable.
Forecasts to 2035
The forecast horizon extends to 2035 and is based on a structured model that links non-alcoholic beverage, not containing milk demand and supply to macroeconomic indicators, trade patterns, and sector-specific drivers. The model captures both cyclical and structural factors and reflects known policy and technology shifts in the United Kingdom.
Historical baseline: 2012-2025
Forecast horizon: 2026-2035
Scenario-based sensitivity to income growth, substitution, and regulation
Capacity and investment outlook for major producing companies
Each projection is built from national historical patterns and the broader regional context, allowing the report to show where growth is concentrated and where risks are elevated.
Price analysis and trade dynamics
Prices are analyzed in detail, including export and import unit values, regional spreads, and changes in trade costs. The report highlights how seasonality, freight rates, exchange rates, and supply disruptions influence pricing and margins.
Price benchmarks by country and sub-region
Export and import unit value trends
Seasonality and calendar effects in trade flows
Price outlook to 2035 under baseline assumptions
Profiles of market participants
Key producers, exporters, and distributors are profiled with a focus on their operational scale, geographic footprint, product mix, and market positioning. This helps identify competitive pressure points, partnership opportunities, and routes to differentiation.
Business focus and production capabilities
Geographic reach and distribution networks
Cost structure and pricing strategy indicators
Compliance, certification, and sustainability context
How to use this report
Quantify domestic demand and identify the most attractive segments
Evaluate export opportunities and prioritize target destinations
Track price dynamics and protect margins
Benchmark performance against leading competitors
Build evidence-based forecasts for investment decisions
This report is designed for manufacturers, distributors, importers, wholesalers, investors, and advisors who need a clear, data-driven picture of non-alcoholic beverage, not containing milk dynamics in the United Kingdom.
FAQ
What is included in the non-alcoholic beverage, not containing milk market in the United Kingdom?
The market size aggregates consumption and trade data, presented in both value and volume terms.
How are the forecasts to 2035 built?
The projections combine historical trends with macroeconomic indicators, trade dynamics, and sector-specific drivers.
Does the report cover prices and margins?
Yes, it includes export and import unit values, regional spreads, and a pricing outlook to 2035.
Which benchmarks are included?
The report benchmarks market size, trade balance, prices, and per-capita indicators for the United Kingdom.
Can this report support market entry decisions?
Yes, it highlights demand hotspots, trade routes, pricing trends, and competitive context.