
JWST characterization of the JADES-ID1 protocluster
Here we overview several key aspects of the JWST analysis. Specifically, we summarize the method used to define the JADES-ID1 centroid, quantify the statistical significance of its galaxy overdensity and present tests that rule out the presence of any substantial low-redshift foreground structures.
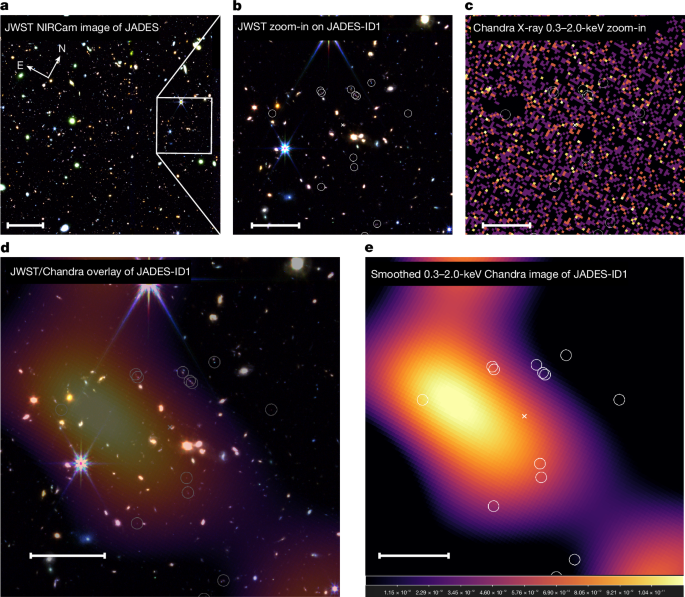
To define the centre of JADES-ID1 (ref. 8), we construct two-dimensional galaxy overdensity maps in narrow-redshift slices using the DETECTIFz algorithm59, which uses Monte Carlo realizations of the redshift probability distribution function of each galaxy. We then identify the slice with the highest overdensity peak, z = 5.68 for JADES-ID1, and use the coordinates of that peak as the protocluster centre.
Next we quantify the rarity of the JWST-identified overdensity around JADES-ID1 by comparing it with field fluctuations. Within a projected radius of 42″ (≈250 kpc) around the JADES-ID1 centroid, the local galaxy overdensity is measured as δgal = 3.9 relative to the mean density across the JADES field in the same redshift slice8. Focusing on the inner 21″ (≈125 kpc) region, which is coincident with our X-ray aperture, the overdensity rises to δgal = 4.5. This is comparable with or exceeds those of previously confirmed protoclusters at similar redshifts7. To assess the statistical significance of this overdensity, we compared these values to the mean field density over 5.44 < z < 6.08 within a spherical volume of radius 410 kpc. Accounting for an approximately 30% cosmic variance, which is appropriate for the typical ultraviolet luminosities of candidate members8,60, we performed 106 Monte Carlo realizations. The chance of obtaining the observed overdensity of the observed galaxies by random fluctuation is 1.4 × 10⁻⁵, corresponding to a roughly 4.2σ detection. We note that our field baseline includes cluster members, so both δgal and its significance are slight underestimates relative to a purely field reference. This confirms that, at z ≈ 5.7, such a strong overdensity is exceptionally rare.
Although ref. 8 identifies a clear overdensity at z ≈ 5.68, we further verify that no other substantial structures exist at lower redshifts. To do this, we investigated the photometric galaxy catalogues based on JWST and Hubble Space Telescope (HST) observations in the JADES field. We measured the galaxy surface density within a 40″ × 40″ box centred on the X-ray emission peak, corresponding to the extent of the detected emission from the JADES-ID1 protocluster. We binned galaxies in redshift slices with width of Δz = 0.3 in the redshift range z = 0–6.6 and derived the surface density in each bin. To correct for redshift-dependent selection biases (most notably the increased completeness at lower redshifts), we carried out the same measurement in a large background region within the JADES footprint, while excluding the 40″ × 40″ region with the X-ray detection. The difference between the galaxy surface density at the position of the X-ray excess and the field average exhibits a single significant peak in the z = 5.25–6.23 redshift bin. There are no comparable galaxy overdensities at any other redshift bins. This result demonstrates the absence of any substantial foreground structure along the line of sight of the JADES-ID1 protocluster.
The halo detection probabilities presented in the main part of this paper are based on the cosmic mean density field. To estimate how local density fluctuations could bias these results, we estimate the variance of the matter density over a JADES-sized volume. We find σ(R) ≈ 0.059, which corresponds to a 6% typical fluctuation between different patches of this size. Although a 6% overdense field would allow structure to grow more rapidly, the chance of finding a 1013 M⊙ halo would increase only from about 4 × 10⁻⁵ to about 3 × 10⁻⁴.
Chandra data analysis
To examine the presence and physical properties of the hot ICM associated with the protocluster JADES-ID1, we analysed 99 Chandra ACIS-I observations that cover the CDFS. The CDFS represents the deepest X-ray field ever observed. The list of analysed Chandra observations is given in Extended Data Table 1. We performed most of the data analysis using standard CIAO tools, specifically, we used the latest version of CIAO (4.17) and the Calibration Database (CALDB 4.11.6). The main steps of the X-ray data analysis followed those outlined in our previous studies61,62. Below, we outline the main steps of the X-ray analysis.
The first step of the analysis was to reprocess each individual observation using the chandra_repro tool, thereby applying the latest calibration products. Next we identified and filtered high-background periods from the observations using the lc_clean routine by applying a 3σ threshold to remove fluctuations in the light curves. Because ACIS-I observations are not highly sensitive to solar flares, this step only reduced the exposure time by approximately 2%. The total cleaned exposure time of the dataset was 6.55 Ms.
Because we analyse and combine a large set of observations, small differences exist in the alignment between the individual Chandra observations. To account for this effect, we correct the absolute astrometry using the wcs_match and wcs_update tools. This step ensures that point sources are accurately aligned and exhibit a sharp point spread function, thereby minimizing contamination of the extended emission. To perform the astrometry correction, we cross-matched the positions of X-ray point sources in individual observations with the coordinates of guide stars in the same field. Using the coordinates of the X-ray–optical source pairs, we applied frame transformations for each Chandra observation, including transformations for rotation, scale and translation. We set the deepest observation, ObsID 8594, as the reference coordinate system. For the subsequent analysis, we used these astrometry-corrected event files.
The next step in the analysis was to combine the individual X-ray observations. For this, we used the merge_obs tool, which coadded the data, resulting in a merged event file with 6.55 Ms exposure time. This process also generated energy-filtered images in the 0.3–2.0-keV (soft) and 3–7-keV (hard) bands. In our analysis, we use the 0.3–2.0-keV range as our soft band because it maximizes sensitivity to a few-keV thermal plasma at z ≈ 5.7. Because most observations were taken relatively early in the Chandra mission, molecular contamination is minimal63,64, allowing us to extend reliably down to 0.3 keV. For the hard band, we use the 3–7-keV band, thereby avoiding the 2–3-keV energy range in which the Au L fluorescence line complex dominates65,66. This hard band is sensitive to unresolved active galactic nuclei (AGN), very hot ICM at high redshift or ICM emission from nearby clusters. We generated exposure maps for both energy ranges using this tool. These maps account for vignetting, molecular contamination, gaps between charge-coupled devices and the filtering of bad pixels. To construct the exposure maps, we assumed an optically thin thermal plasma model (APEC in XSPEC) with a galactic column density of NH = 6.8 × 1019 cm−2, a kT = 2 keV temperature and Z = 0.3 Z⊙ solar abundance. The count images were then divided by the exposure maps, producing the exposure-corrected images used in the analysis.
To study the extended emission associated with JADES-ID1, we must ensure that bright X-ray point sources do not contaminate the extended emission from the protocluster. Therefore, we searched for resolved X-ray point sources (mostly originating from the cosmic X-ray background) using the wavdetect tool. We searched for sources using the wavelet scales of 1.0, 1.414, 2.0, 2.828, 4.0, 5.657 and 8.0, which allows the detection of sources on a wide range of spatial scales and a significance threshold of 10−6. Furthermore, we set the ellsigma parameter to 5. To carry out a comprehensive masking of all point sources, we cross-referenced our source list with the CDFS point source list presented in ref. 28. We found that some of their faintest sources, detected using a lower significance threshold, fell below our initial detection criteria, so we added these to our point source catalogue. We then visually inspected the source regions and, for especially bright sources, enlarged the exclusion regions to fully encompass their point spread function wings. We note that, within the inner 21″ of JADES-ID1, only one moderately bright and two faint point sources are detected (Extended Data Fig. 1). The detected point source regions were excluded from the merged images. Given the sharp Chandra point spread function, our large exclusion regions account for ≳96% of the counts from each point source, implying that any residual counts have a negligible impact on the detected diffuse emission. Moreover, because spillover counts from point sources contribute similarly to both the source and the background regions, it does not bias our measurements in any notable way.
Because the X-ray emission from JADES-ID1 is relatively faint, precisely accounting for the background components is essential. The Chandra background comprises several components: the vignetted sky emission (Milky Way foreground and unresolved cosmic X-ray background) and the non-vignetted particle background. To separate these components, we generated two sets of exposure maps. One of them is a ‘full’ map including mirror vignetting and all ACIS detector corrections, whereas the other is a ‘detector-only’ map that does not include the vignetting term. We then split the total background accordingly and applied the full map to the sky component and the detector-only map to the particle component. In the deep CDFS field, Chandra resolves about 90% of the cosmic X-ray background, so we find that particle background accounts for about 77% of the 0.3–2.0-keV band and about 95% of the 3–7-keV band background.
To verify that the X-ray detection associated with JADES-ID1 is not driven by a small subset of observations, we split the CDFS Chandra data into two groups in two complementary ways. First, we divided the observations chronologically into two sets with approximately equal total exposure times. Owing to the build-up of the molecular contaminant on the ACIS optical blocking filter (which absorbs soft X-rays63,64) and the soft, redshifted spectrum of the JADES-ID1 protocluster, the earlier dataset contains approximately 65% of the net counts, whereas the later one includes about 35%. Second, we randomly split the observations into two groups once again with approximately equal exposure times. In this case, as both subsets have the same average molecular contamination level, the net counts split roughly evenly between them. These tests demonstrate that the detected X-ray signal is not driven by a handful of observations or by temporal variation but arises uniformly across the Chandra dataset. This supports the conclusion that the X-ray emission associated with JADES-ID1 originates from a genuine, extended ICM.
X-ray hardness ratios
Owing to the relatively low number of net X-ray counts and the limited signal-to-noise ratios associated with the JADES-ID1 protocluster, it is not feasible to fit a full X-ray spectrum. Instead, we measure a hardness ratio to gain insight into the spectral properties of the emission. We define HR = S/H, in which S and H are the net counts obtained in the 0.3–1.2-keV and 1.2–2.0-keV bands, respectively.
We estimate the hardness ratio and its associated uncertainties using the Bayesian Estimation of Hardness Ratios (BEHR) code67, which uses a Bayesian framework designed for low-count data. For JADES-ID1, this yields \({\rm{HR}}=1.8{4}_{-1.84}^{+1.96}\). We note that the BEHR code evaluates the uncertainties through 106 draws of Gibbs sampling that take into account the background counts.
To explore how the measured hardness ratio constrains the ICM temperature, we generated synthetic hardness ratio values using APEC models and using the exposure-averaged response files. When deriving the hardness ratio values, we covered a temperature range kT = 1–10 keV and a metallicity range Z = 0–1 Z⊙. Within the kT ≈ 1–6 keV range, the hardness ratio is only weakly sensitive to metallicity. On the other hand, the hardness ratio is more sensitive to temperature: hotter plasmas yield stronger emission above 1.2 keV (rest frame 8 keV) and hence produce lower hardness ratio values. The upper limit of the measured HR ≈ 3.8 suggests that the ICM temperature is at least kT ≈ 2.5 keV, although a higher temperature is also possible. This is consistent with our X-ray luminosity-based estimates, but the large hardness ratio uncertainties do not allow tighter constraints on either temperature or metallicity. Hotter ICM temperatures may imply additional heating from the continuing mergers and other non-thermal processes (such as turbulent motions), both of which are expected in dynamically assembling clusters.
Excluding alternative origins of the X-ray emission
Although the diffuse X-ray properties of JADES-ID1 consistently demonstrate that it originates from hot ICM, we have tested, and ruled out, potential non-thermal or point source origin of this emission.
First, we cross-matched all resolved X-ray point sources with the positions of the candidate JADES-ID1 members within the source aperture (Extended Data Fig. 1). None of these high-redshift galaxies coincides with a resolved Chandra point source, implying that these galaxies do not host luminous AGN. Next, to investigate whether a population of fainter, individually undetected AGN is responsible for the diffuse emission, we stacked the Chandra counts at the location of each z ≈ 5.7 galaxy within the source aperture. To do this, we extract the source counts using a 1″ radius aperture and a local 3″–6″ annulus for background. This source region encircles about 90% of the source counts at the position of JADES-ID1. This analysis results in stacked net counts of −0.2 ± 8.2 in the 0.3 – 2.0-keV band and −10.9 ± 9.2 counts in the 3–7-keV band. We note that the non-detection of high-redshift AGN is consistent with previous analyses showing that most high-redshift galaxies are X-ray faint68,69,70, with only rare exceptions62,71. Thus, the absence of detection both individually and in stack firmly rules out any substantial contribution from either resolved or unresolved AGN.
A recent study72 suggested that inverse-Compton (IC) scattering of cosmic microwave background photons off radio galaxy electrons can effectively mimic the X-ray appearance of a high-redshift galaxy cluster. To test this scenario for JADES-ID1, we examined the MeerKAT 1.28-GHz map of the CDFS field73.
At the location of the X-ray peak, we find no notable radio emission above the noise level. Using a typical intracluster magnetic field74,75 of 4 μG (2 μG), IC scattering sufficient to reproduce the observed X-ray flux would imply a 1.4 GHz radio surface brightness that exceeds the MeerKAT detection limit by more than an order of magnitude (>12σ (about 4σ) per MeerKAT beam), which is not observed. We do, however, identify a faint radio point source 11.5″ offset from the X-ray peak with a flux density of 13.7 ± 1.4 μJy. This radio source is coincident with a galaxy at z = 1.173 (CANDELS J033230.91-274649.5)76 and not with any of the z ≈ 5.7 potential cluster members. At this position, a faint X-ray point source is detected, which has been excised from the analysis of the diffuse emission. We do not expect substantial X-ray IC emission from the radio lobes of this galaxy. Even if we (incorrectly) attribute the entire radio flux at z = 5.7, we expect only about 5 (about 15) IC X-ray counts in either the soft or the hard bands, far below the observed X-ray signal. Thus, IC emission cannot account for the observed soft X-ray emission.
Taken together, the absence of any X-ray point source coinciding with a JADES-ID1 cluster member, the non-detection from the stacking analysis and the inconsistency between predicted IC flux emission and the observed flux as well all demonstrate that neither AGN nor IC scattering can explain the extended soft X-ray emission. Therefore, the only viable explanation remains thermal bremsstrahlung from a few-keV ICM at z ≈ 5.7 associated with the JADES-ID1 protocluster.
Detection significance map
The detection of extended X-ray emission in the 0.3–2.0-keV band, along with the declining surface brightness profile and the 3–7-keV band non-detection all provide strong evidence for the presence of hot ICM associated with JADES-ID1.
Combining all of this information, we construct a likelihood map to quantify the probability of hot intracluster gas associated with JADES-ID1 (Fig. 3). We define the combined likelihood for a high-redshift cluster as follows,
$${L}={{S}}_{{\rm{s}}}(r < {6}^{{\prime\prime} })\times {({{S}}_{{\rm{s}}}(6 < r < 2{0}^{{\prime\prime} })\times {{S}}_{{\rm{s}}}(0 < r < {6}^{{\prime\prime} })}^{0.5}\times {{C}}_{{\rm{h}}}(\, < {6}^{{\prime\prime} }),$$
(1)
in which \({S}\) is the Poisson survival function and \({C}\) is the cumulative distribution function. The subscripts s and h denote the soft and hard bands, respectively. The first part, \({{S}}_{{\rm{s}}}(r < {6}^{{\prime\prime} })\), defines the probability of detecting counts within 6″ above the background level (50″–75″). The second part, \({{S}}_{{\rm{s}}}({6}^{{\prime\prime} } < r < 2{0}^{{\prime\prime} })\) describes the detection of counts between 6″ and 20″ but the background is assumed to be the 20″–30″ region. The third part, \({{S}}_{{\rm{s}}}({0}^{{\prime\prime} } < r < {6}^{{\prime\prime} })\), analogous to the second part, describes the excess counts in the inner 6″ but used the 6″–20″ region as background. Together, the second and third parts will detect a rising profile towards the centre. The last part, \({{C}}_{{\rm{h}}}(\, < {6}^{{\prime\prime} })\) brings in the probability of having hard band counts within 6″ consistent with the background (50″–75″). We note that, for the β-model shown in Fig. 2, the choice of 0″–6″ and 6″–20″ bins maximizes the signal-to-noise ratio and also makes it equal in the two bins.
For plotting purposes, we show the combined likelihood converted into a significance, using the inverse survival function. This map reveals that the combined likelihood of a statistical fluctuation with these parameters is 2.6 × 10⁻⁷, which corresponds to a 5.0σ detection. This indicates that the diffuse X-ray emission most likely originates from hot ICM associated with JADES-ID1. In Fig. 3, JADES-ID1 is the most notable detection. Specifically, this is the only region that satisfies all of our X-ray criteria (a soft band detection, a hard band non-detection and a declining surface brightness profile) and is cospatial with the independently identified JWST galaxy overdensity. All other apparent ‘hotspots’ on this map either lie outside the z ≈ 5.7 redshift slice or fail one or more of the X-ray criteria required to identify a high-redshift galaxy cluster, indicating that these regions are statistical fluctuations or correspond to lower-redshift structures tracing the large-scale structure of the universe.