
Feb 6, 2026
IndexBox has just published a new report: United Kingdom – Frozen Fish And Seafood – Market Analysis, Forecast, Size, Trends And Insights.
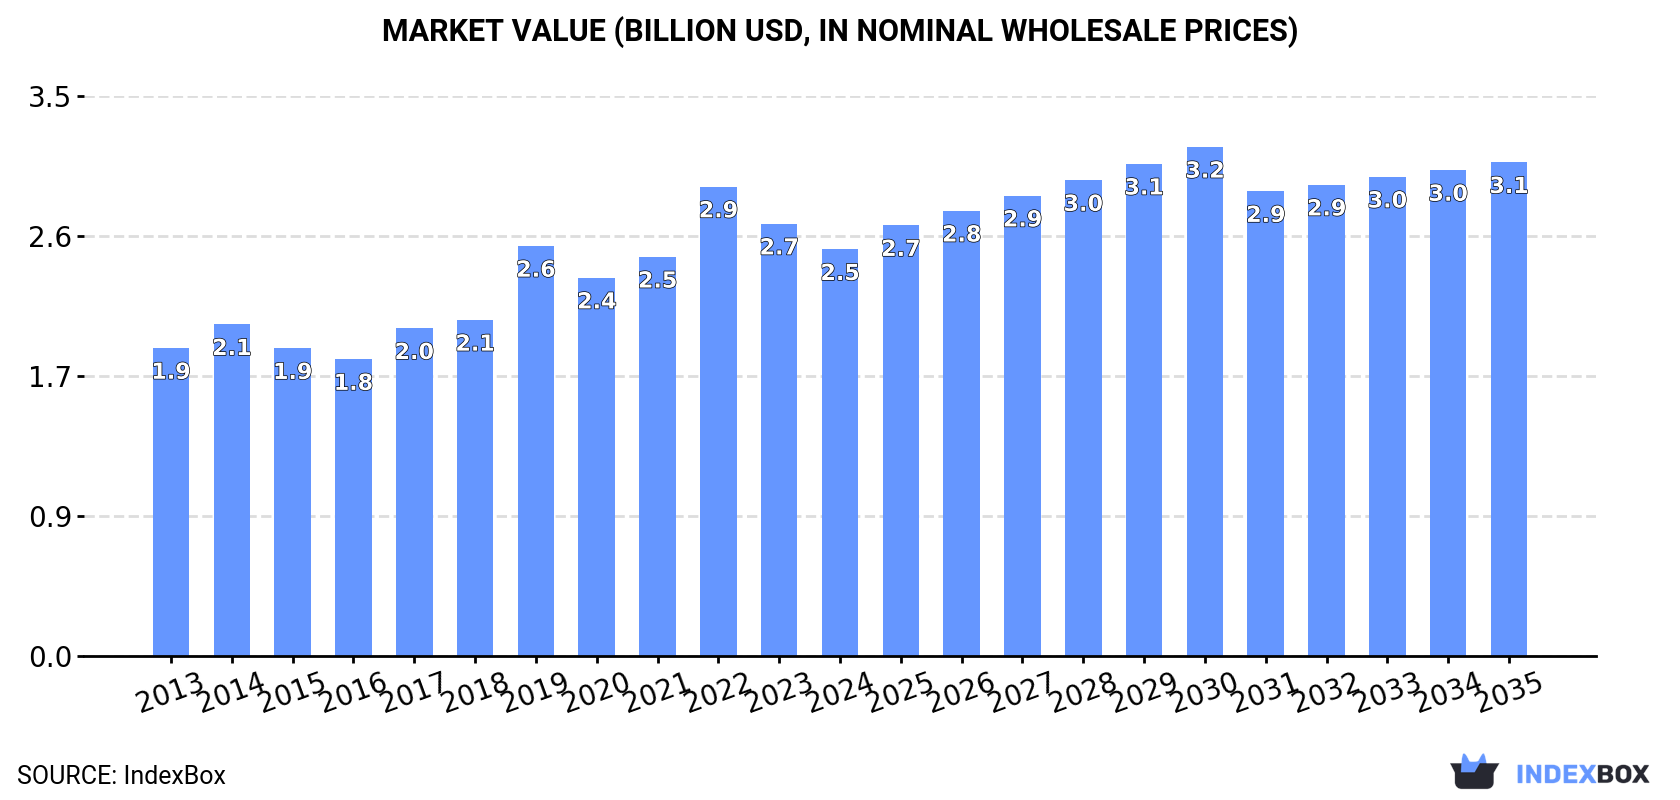
The UK frozen fish and seafood market saw a contraction in 2024, with consumption at 403K tons and market value at $2.5B. However, driven by sustained demand, the market is forecast to grow at a CAGR of +1.5% in volume and +1.8% in value through 2035, reaching 475K tons and $3.1B. Frozen fish fillets dominate both consumption and production. The UK is a net importer, with China, Iceland, and Norway as key suppliers, while exports are primarily frozen whole fish sent to the Netherlands and France. Import prices are significantly higher than export prices, reflecting differences in product mix and quality.
Key Findings
Market forecast to grow to 475K tons and $3.1B by 2035, with CAGRs of +1.5% and +1.8% respectivelyFrozen fish fillet is the dominant category, comprising over 80% of consumption volumeThe UK is a net importer, relying heavily on supplies from China, Iceland, and NorwayExport unit value ($3,123/ton) is less than half the import unit value ($6,704/ton)Frozen whole fish constitutes the majority of exports by volume, while frozen crustaceans command the highest export priceMarket Forecast
Driven by increasing demand for frozen fish and seafood in the UK, the market is expected to continue an upward consumption trend over the next decade. Market performance is forecast to accelerate, expanding with an anticipated CAGR of +1.5% for the period from 2024 to 2035, which is projected to bring the market volume to 475K tons by the end of 2035.
In value terms, the market is forecast to increase with an anticipated CAGR of +1.8% for the period from 2024 to 2035, which is projected to bring the market value to $3.1B (in nominal wholesale prices) by the end of 2035.
 ConsumptionUnited Kingdom’s Consumption of Frozen Fish and Seafood
Frozen fish and seafood consumption in the UK shrank to 403K tons in 2024, declining by -2.7% compared with 2023. In general, consumption, however, saw a relatively flat trend pattern. As a result, consumption attained the peak volume of 425K tons. From 2020 to 2024, the growth of the consumption remained at a lower figure.
The size of the frozen fish and seafood market in the UK shrank to $2.5B in 2024, falling by -5.9% against the previous year. This figure reflects the total revenues of producers and importers (excluding logistics costs, retail marketing costs, and retailers’ margins, which will be included in the final consumer price). The market value increased at an average annual rate of +2.6% from 2013 to 2024; the trend pattern indicated some noticeable fluctuations being recorded throughout the analyzed period. Frozen fish and seafood consumption peaked at $2.9B in 2022; however, from 2023 to 2024, consumption failed to regain momentum.
Consumption By Type
Frozen fish fillet (437K tons) constituted the product with the largest volume of consumption, comprising approx. 82% of total volume. Moreover, frozen fish fillet exceeded the figures recorded for the second-largest type, frozen crustaceans (57K tons), eightfold. The third position in this ranking was held by frozen whole fish (35K tons), with a 6.6% share.
From 2013 to 2024, the average annual rate of growth in terms of the volume of frozen fish fillet consumption stood at +4.8%. With regard to the other consumed products, the following average annual rates of growth were recorded: frozen crustaceans (+3.7% per year) and frozen whole fish (-5.3% per year).
In value terms, frozen fish fillet ($2.3B) led the market, alone. The second position in the ranking was taken by frozen crustaceans ($525M). It was followed by frozen whole fish.
From 2013 to 2024, the average annual growth rate of the value of frozen fish fillet market stood at +5.9%. With regard to the other consumed products, the following average annual rates of growth were recorded: frozen crustaceans (+2.7% per year) and frozen whole fish (-0.1% per year).
ProductionUnited Kingdom’s Production of Frozen Fish and Seafood
After two years of growth, production of frozen fish and seafood decreased by -1% to 291K tons in 2024. In general, production saw a relatively flat trend pattern. The most prominent rate of growth was recorded in 2017 when the production volume increased by 10% against the previous year. As a result, production reached the peak volume of 324K tons. From 2018 to 2024, production growth failed to regain momentum.
In value terms, frozen fish and seafood production reduced modestly to $907M in 2024 estimated in export price. Overall, production continues to indicate a relatively flat trend pattern. The most prominent rate of growth was recorded in 2022 when the production volume increased by 18% against the previous year. As a result, production attained the peak level of $1.1B. From 2023 to 2024, production growth remained at a lower figure.
Production By Type
Frozen fish fillet (297K tons) constituted the product with the largest volume of production, accounting for 70% of total volume. Moreover, frozen fish fillet exceeded the figures recorded for the second-largest type, frozen whole fish (98K tons), threefold. Frozen crustaceans (20K tons) ranked third in terms of total production with a 4.8% share.
From 2013 to 2024, the average annual rate of growth in terms of the volume of frozen fish fillet production totaled +8.8%. With regard to the other produced products, the following average annual rates of growth were recorded: frozen whole fish (-4.6% per year) and frozen crustaceans (+2.7% per year).
In value terms, frozen fish fillet ($1.3B) led the market, alone. The second position in the ranking was taken by frozen crustaceans ($207M). It was followed by frozen whole fish.
From 2013 to 2024, the average annual rate of growth in terms of the value of frozen fish fillet production amounted to +9.0%. With regard to the other produced products, the following average annual rates of growth were recorded: frozen crustaceans (+3.3% per year) and frozen whole fish (-2.2% per year).
ImportsUnited Kingdom’s Imports of Frozen Fish and Seafood
In 2024, supplies from abroad of frozen fish and seafood increased by 3.9% to 272K tons, rising for the third consecutive year after two years of decline. Overall, imports, however, recorded a relatively flat trend pattern. The most prominent rate of growth was recorded in 2019 when imports increased by 16%. As a result, imports attained the peak of 309K tons. From 2020 to 2024, the growth of imports remained at a lower figure.
In value terms, frozen fish and seafood imports reached $1.8B in 2024. The total import value increased at an average annual rate of +1.5% from 2013 to 2024; the trend pattern remained relatively stable, with only minor fluctuations being observed throughout the analyzed period. The most prominent rate of growth was recorded in 2022 when imports increased by 15%. As a result, imports reached the peak of $1.9B. From 2023 to 2024, the growth of imports failed to regain momentum.
Imports By Country
In 2024, China (62K tons) constituted the largest supplier of frozen fish and seafood to the UK, with a 23% share of total imports. Moreover, frozen fish and seafood imports from China exceeded the figures recorded by the second-largest supplier, Vietnam (30K tons), twofold. The third position in this ranking was held by Norway (29K tons), with an 11% share.
From 2013 to 2024, the average annual growth rate of volume from China was relatively modest. The remaining supplying countries recorded the following average annual rates of imports growth: Vietnam (+4.1% per year) and Norway (+2.5% per year).
In value terms, the largest frozen fish and seafood suppliers to the UK were China ($319M), Iceland ($225M) and Norway ($186M), with a combined 40% share of total imports. Vietnam, India, Turkey, Ecuador, the United States, Faroe Islands, Russia, Myanmar, Germany and Denmark lagged somewhat behind, together accounting for a further 37%.
Turkey, with a CAGR of +20.5%, saw the highest growth rate of the value of imports, in terms of the main suppliers over the period under review, while purchases for the other leaders experienced more modest paces of growth.
Imports By Type
In 2024, frozen fish fillet (147K tons) constituted the largest type of frozen fish and seafood supplied to the UK, with a 54% share of total imports. Moreover, frozen fish fillet exceeded the figures recorded for the second-largest type, frozen whole fish (59K tons), twofold. Frozen crustaceans (48K tons) ranked third in terms of total imports with an 18% share.
From 2013 to 2024, the average annual rate of growth in terms of the volume of frozen fish fillet imports totaled -1.2%. With regard to the other supplied products, the following average annual rates of growth were recorded: frozen whole fish (+2.2% per year) and frozen crustaceans (+0.5% per year).
In value terms, frozen fish fillet ($1B) constituted the largest type of frozen fish and seafood supplied to the UK, comprising 57% of total imports. The second position in the ranking was held by frozen crustaceans ($444M), with a 24% share of total imports. It was followed by frozen whole fish, with a 13% share.
From 2013 to 2024, the average annual rate of growth in terms of the value of frozen fish fillet imports stood at +2.1%. With regard to the other supplied products, the following average annual rates of growth were recorded: frozen crustaceans (-0.5% per year) and frozen whole fish (+4.6% per year).
Import Prices By Type
The average frozen fish and seafood import price stood at $6,704 per ton in 2024, which is down by -3.1% against the previous year. Over the last eleven-year period, it increased at an average annual rate of +2.0%. The most prominent rate of growth was recorded in 2014 an increase of 14% against the previous year. Over the period under review, average import prices hit record highs at $7,551 per ton in 2022; however, from 2023 to 2024, import prices failed to regain momentum.
There were significant differences in the average prices amongst the major supplied products. In 2024, the product with the highest price was frozen crustaceans ($9,158 per ton), while the price for frozen fish meat ($3,254 per ton) was amongst the lowest.
From 2013 to 2024, the most notable rate of growth in terms of prices was attained by molluscs (+4.0%), while the prices for the other products experienced more modest paces of growth.
Import Prices By Country
In 2024, the average frozen fish and seafood import price amounted to $6,704 per ton, reducing by -3.1% against the previous year. Over the period from 2013 to 2024, it increased at an average annual rate of +2.0%. The pace of growth was the most pronounced in 2014 when the average import price increased by 14% against the previous year. The import price peaked at $7,551 per ton in 2022; however, from 2023 to 2024, import prices failed to regain momentum.
Prices varied noticeably by country of origin: amid the top importers, the country with the highest price was Turkey ($11,776 per ton), while the price for Myanmar ($4,366 per ton) was amongst the lowest.
From 2013 to 2024, the most notable rate of growth in terms of prices was attained by Faroe Islands (+5.9%), while the prices for the other major suppliers experienced more modest paces of growth.
ExportsUnited Kingdom’s Exports of Frozen Fish and Seafood
In 2024, overseas shipments of frozen fish and seafood increased by 13% to 159K tons, rising for the second consecutive year after six years of decline. In general, exports, however, continue to indicate a pronounced downturn. The growth pace was the most rapid in 2014 with an increase of 18%. As a result, the exports reached the peak of 250K tons. From 2015 to 2024, the growth of the exports remained at a somewhat lower figure.
In value terms, frozen fish and seafood exports expanded notably to $498M in 2024. Overall, exports, however, continue to indicate a noticeable downturn. The pace of growth was the most pronounced in 2016 when exports increased by 19%. Over the period under review, the exports attained the maximum at $719M in 2014; however, from 2015 to 2024, the exports remained at a lower figure.
Exports By Country
The Netherlands (38K tons) was the main destination for frozen fish and seafood exports from the UK, with a 24% share of total exports. Moreover, frozen fish and seafood exports to the Netherlands exceeded the volume sent to the second major destination, France (17K tons), twofold. The third position in this ranking was taken by Lithuania (11K tons), with a 7.1% share.
From 2013 to 2024, the average annual rate of growth in terms of volume to the Netherlands amounted to -2.4%. Exports to the other major destinations recorded the following average annual rates of exports growth: France (-0.2% per year) and Lithuania (+25.1% per year).
In value terms, France ($104M), the Netherlands ($94M) and Spain ($30M) were the largest markets for frozen fish and seafood exported from the UK worldwide, together accounting for 46% of total exports. Lithuania, Vietnam, Germany, China, Japan, the United States, Ukraine, the Philippines, Ireland and Nigeria lagged somewhat behind, together accounting for a further 31%.
The Philippines, with a CAGR of +38.6%, recorded the highest rates of growth with regard to the value of exports, in terms of the main countries of destination over the period under review, while shipments for the other leaders experienced more modest paces of growth.
Exports By Type
Frozen whole fish (122K tons) was the largest type of frozen fish and seafood exported from the UK, with a 77% share of total exports. Moreover, frozen whole fish exceeded the volume of the second product type, frozen crustaceans (12K tons), tenfold. Frozen fish meat (12K tons) ranked third in terms of total exports with a 7.3% share.
From 2013 to 2024, the average annual growth rate of the volume of frozen whole fish exports totaled -1.7%. With regard to the other exported products, the following average annual rates of growth were recorded: frozen crustaceans (-5.6% per year) and frozen fish meat (+5.8% per year).
In value terms, frozen whole fish ($261M) remains the largest type of frozen fish and seafood exported from the UK, comprising 52% of total exports. The second position in the ranking was taken by frozen crustaceans ($126M), with a 25% share of total exports. It was followed by molluscs (scallops, mussels, cuttle fish, squid and octopus), with a 12% share.
From 2013 to 2024, the average annual rate of growth in terms of the value of frozen whole fish exports totaled +1.4%. With regard to the other exported products, the following average annual rates of growth were recorded: frozen crustaceans (-5.0% per year) and molluscs (scallops, mussels, cuttle fish, squid and octopus) (-1.7% per year).
Export Prices By Type
In 2024, the average frozen fish and seafood export price amounted to $3,123 per ton, reducing by -4.1% against the previous year. In general, the export price, however, saw a relatively flat trend pattern. The growth pace was the most rapid in 2022 an increase of 20% against the previous year. As a result, the export price reached the peak level of $3,928 per ton. From 2023 to 2024, the average export prices remained at a lower figure.
Prices varied noticeably by the product type; the product with the highest price was frozen crustaceans ($10,274 per ton), while the average price for exports of frozen fish meat ($2,047 per ton) was amongst the lowest.
From 2013 to 2024, the most notable rate of growth in terms of prices was recorded for the following types: frozen whole fish (+3.2%), while the prices for the other products experienced more modest paces of growth.
Export Prices By Country
In 2024, the average frozen fish and seafood export price amounted to $3,123 per ton, which is down by -4.1% against the previous year. Overall, the export price, however, recorded a relatively flat trend pattern. The most prominent rate of growth was recorded in 2022 an increase of 20% against the previous year. As a result, the export price reached the peak level of $3,928 per ton. From 2023 to 2024, the average export prices failed to regain momentum.
There were significant differences in the average prices for the major foreign markets. In 2024, amid the top suppliers, the country with the highest price was Ireland ($11,225 per ton), while the average price for exports to the Philippines ($1,615 per ton) was amongst the lowest.
From 2013 to 2024, the most notable rate of growth in terms of prices was recorded for supplies to the Netherlands (+8.4%), while the prices for the other major destinations experienced more modest paces of growth.
Source: IndexBox Market Intelligence Platform
This report provides a comprehensive view of the frozen fish and seafood industry in the United Kingdom, tracking demand, supply, and trade flows across the national value chain. It explains how demand across key channels and end-use segments shapes consumption patterns, while also mapping the role of input availability, production efficiency, and regulatory standards on supply.
Beyond headline metrics, the study benchmarks prices, margins, and trade routes so you can see where value is created and how it moves between domestic suppliers and international partners. The analysis is designed to support strategic planning, market entry, portfolio prioritization, and risk management in the frozen fish and seafood landscape in the United Kingdom.
Quick navigation
Key findings
Domestic demand is shaped by both household and industrial usage, with trade flows linking local supply to imports and exports.
Pricing dynamics reflect unit values, freight costs, exchange rates, and regulatory shifts that affect sourcing decisions.
Supply depends on input availability and production efficiency, creating a distinct national cost curve.
Market concentration varies by segment, creating different competitive landscapes and entry barriers.
The 2035 outlook highlights where capacity investment and demand growth are most aligned within the country.
Report scope
The report combines market sizing with trade intelligence and price analytics for the United Kingdom. It covers both historical performance and the forward outlook to 2035, allowing you to compare cycles, structural shifts, and policy impacts.
Market size and growth in value and volume terms
Consumption structure by end-use segments
Production capacity, output, and cost dynamics
Trade flows, exporters, importers, and balances
Price benchmarks, unit values, and margin signals
Competitive context and market entry conditions
Product coverageProdcom 10201330 – Frozen whole salt water fishProdcom 10201360 – Frozen whole fresh water fishProdcom 10201600 – Frozen fish livers and roesProdcom 10201500 – Frozen fish meat without bones (excluding fillets)Prodcom 10201400 – Frozen fish filletsProdcom 10203100 – Frozen crustaceans, frozen flours, meals and pellets of crustaceans, fit for human consumptionProdcom 10203200 – Molluscs (scallops, mussels, cuttle fish, squid and octopus), frozen, dried, smoked, salted or in brineCountry coverageCountry profile and benchmarks
This report provides a consistent view of market size, trade balance, prices, and per-capita indicators for the United Kingdom. The profile highlights demand structure and trade position, enabling benchmarking against regional and global peers.
Methodology
The analysis is built on a multi-source framework that combines official statistics, trade records, company disclosures, and expert validation. Data are standardized, reconciled, and cross-checked to ensure consistency across time series.
International trade data (exports, imports, and mirror statistics)
National production and consumption statistics
Company-level information from financial filings and public releases
Price series and unit value benchmarks
Analyst review, outlier checks, and time-series validation
All data are normalized to a common product definition and mapped to a consistent set of codes. This ensures that comparisons across time are aligned and actionable.
Forecasts to 2035
The forecast horizon extends to 2035 and is based on a structured model that links frozen fish and seafood demand and supply to macroeconomic indicators, trade patterns, and sector-specific drivers. The model captures both cyclical and structural factors and reflects known policy and technology shifts in the United Kingdom.
Historical baseline: 2012-2025
Forecast horizon: 2026-2035
Scenario-based sensitivity to income growth, substitution, and regulation
Capacity and investment outlook for major producing companies
Each projection is built from national historical patterns and the broader regional context, allowing the report to show where growth is concentrated and where risks are elevated.
Price analysis and trade dynamics
Prices are analyzed in detail, including export and import unit values, regional spreads, and changes in trade costs. The report highlights how seasonality, freight rates, exchange rates, and supply disruptions influence pricing and margins.
Price benchmarks by country and sub-region
Export and import unit value trends
Seasonality and calendar effects in trade flows
Price outlook to 2035 under baseline assumptions
Profiles of market participants
Key producers, exporters, and distributors are profiled with a focus on their operational scale, geographic footprint, product mix, and market positioning. This helps identify competitive pressure points, partnership opportunities, and routes to differentiation.
Business focus and production capabilities
Geographic reach and distribution networks
Cost structure and pricing strategy indicators
Compliance, certification, and sustainability context
How to use this report
Quantify domestic demand and identify the most attractive segments
Evaluate export opportunities and prioritize target destinations
Track price dynamics and protect margins
Benchmark performance against leading competitors
Build evidence-based forecasts for investment decisions
This report is designed for manufacturers, distributors, importers, wholesalers, investors, and advisors who need a clear, data-driven picture of frozen fish and seafood dynamics in the United Kingdom.
FAQ
What is included in the frozen fish and seafood market in the United Kingdom?
The market size aggregates consumption and trade data, presented in both value and volume terms.
How are the forecasts to 2035 built?
The projections combine historical trends with macroeconomic indicators, trade dynamics, and sector-specific drivers.
Does the report cover prices and margins?
Yes, it includes export and import unit values, regional spreads, and a pricing outlook to 2035.
Which benchmarks are included?
The report benchmarks market size, trade balance, prices, and per-capita indicators for the United Kingdom.
Can this report support market entry decisions?
Yes, it highlights demand hotspots, trade routes, pricing trends, and competitive context.