
Feb 6, 2026
IndexBox has just published a new report: United Kingdom – Dairy Produce – Market Analysis, Forecast, Size, Trends and Insights.
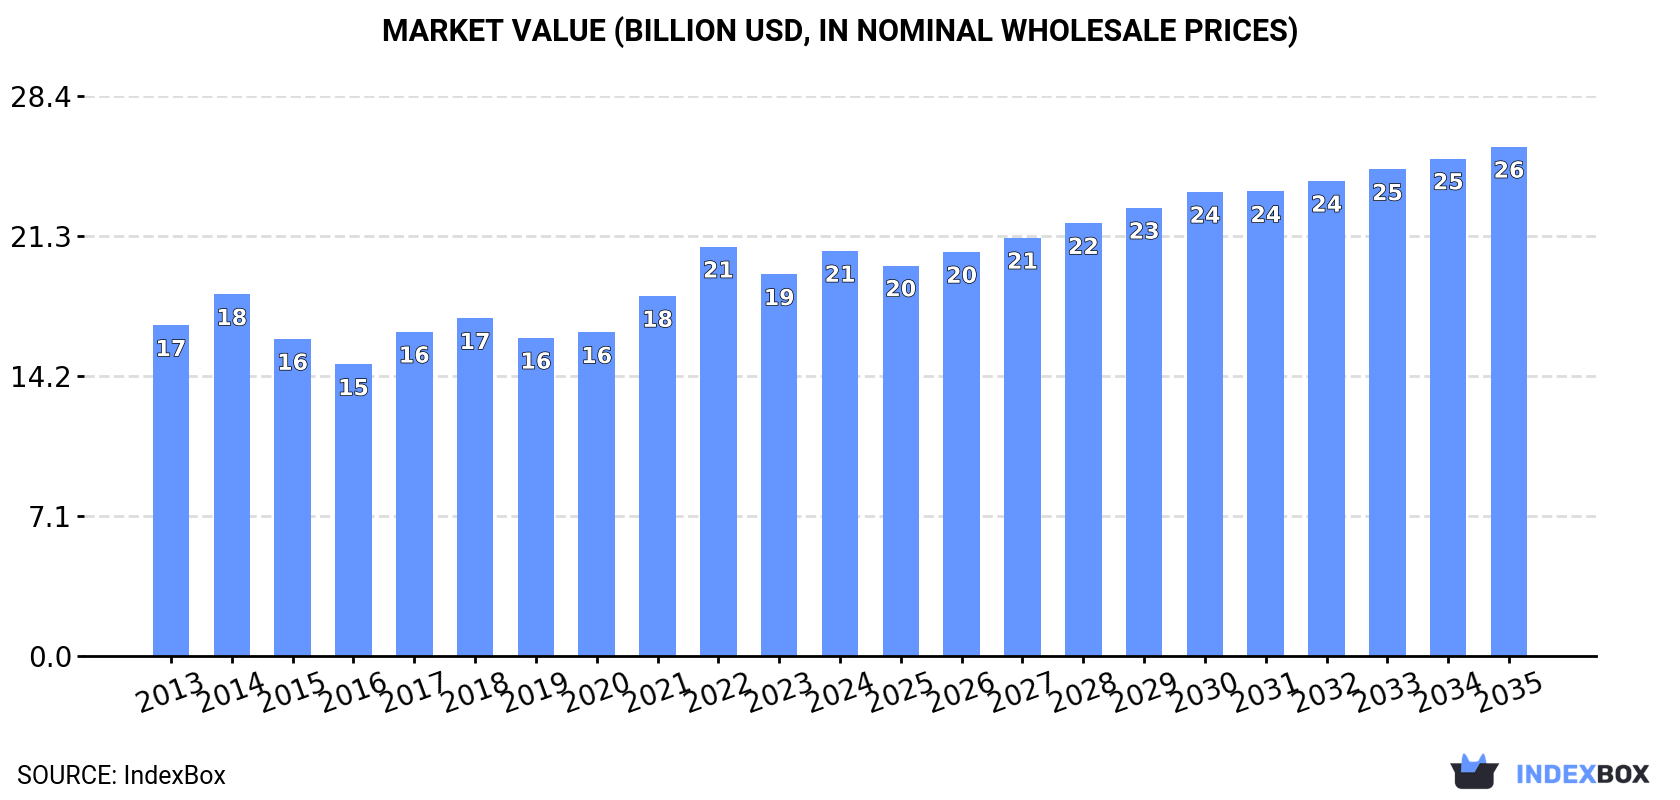
The UK dairy market is forecast to grow slowly, with volume reaching 22M tons (CAGR +0.3%) and value reaching $25.8B (CAGR +2.1%) by 2035. In 2024, consumption was 21M tons valued at $20.5B, dominated by whole fresh milk (72% volume). Production was similar at 21M tons ($18.9B value). The UK is a net importer (1.2M tons, $4.3B), primarily of cheese from Ireland and France, while exports (1.2M tons, $2.2B) are led by whole fresh milk and high-value cheese.
Key Findings
UK dairy market forecast for slow growth: volume to 22M tons (+0.3% CAGR) and value to $25.8B (+2.1% CAGR) by 2035Whole fresh milk dominates domestic consumption (72% volume) and production (74% volume)Cheese is the highest-value import ($2.7B, 62% of import value) and export ($1.1B, 51% of export value)Ireland is the largest import source by volume, while Italy commands the highest import price per tonThe UK maintains a trade deficit in dairy, with import value nearly double export valueMarket Forecast
Driven by increasing demand for dairy produce in the UK, the market is expected to continue an upward consumption trend over the next decade. Market performance is forecast to decelerate, expanding with an anticipated CAGR of +0.3% for the period from 2024 to 2035, which is projected to bring the market volume to 22M tons by the end of 2035.
In value terms, the market is forecast to increase with an anticipated CAGR of +2.1% for the period from 2024 to 2035, which is projected to bring the market value to $25.8B (in nominal wholesale prices) by the end of 2035.
 ConsumptionUnited Kingdom’s Consumption of Dairy
In 2024, consumption of dairy produce in the UK amounted to 21M tons, flattening at 2023 figures. The total consumption volume increased at an average annual rate of +1.1% from 2013 to 2024; the trend pattern remained consistent, with somewhat noticeable fluctuations being recorded throughout the analyzed period. Over the period under review, consumption hit record highs at 21M tons in 2021; however, from 2022 to 2024, consumption failed to regain momentum.
The value of the dairy produce market in the UK totaled $20.5B in 2024, picking up by 6.1% against the previous year. This figure reflects the total revenues of producers and importers (excluding logistics costs, retail marketing costs, and retailers’ margins, which will be included in the final consumer price). The market value increased at an average annual rate of +1.9% from 2013 to 2024; the trend pattern indicated some noticeable fluctuations being recorded in certain years. As a result, consumption attained the peak level of $20.7B. From 2023 to 2024, the growth of the market remained at a lower figure.
Consumption By Type
Whole fresh milk (15M tons) constituted the product with the largest volume of consumption, accounting for 72% of total volume. Moreover, whole fresh milk exceeded the figures recorded for the second-largest type, skim milk (3.6M tons), fourfold. Cheese (1.1M tons) ranked third in terms of total consumption with a 5.2% share.
From 2013 to 2024, the average annual rate of growth in terms of the volume of whole fresh milk consumption amounted to +1.0%. With regard to the other consumed products, the following average annual rates of growth were recorded: skim milk (+0.7% per year) and cheese (+2.6% per year).
In value terms, whole fresh milk ($7.5B), cheese ($6.1B) and skim milk ($3.3B) appeared to be the products with the highest levels of market value in 2024, together comprising 82% of the total market. Yoghurt and fermented milk, butter and dairy spreads, powdered milk, evaporated and condensed milk, cream fresh and ghee lagged somewhat behind, together accounting for a further 18%.
Cream fresh, with a CAGR of +6.8%, recorded the highest growth rate of market size among the main consumed products over the period under review, while market for the other products experienced more modest paces of growth.
ProductionUnited Kingdom’s Production of Dairy
In 2024, production of dairy produce in the UK dropped to 21M tons, approximately mirroring 2023. The total output volume increased at an average annual rate of +1.3% over the period from 2013 to 2024; the trend pattern remained relatively stable, with only minor fluctuations being observed in certain years. The pace of growth appeared the most rapid in 2014 with an increase of 7.4%. Over the period under review, production attained the peak volume at 21M tons in 2021; however, from 2022 to 2024, production stood at a somewhat lower figure.
In value terms, dairy produce production rose markedly to $18.9B in 2024 estimated in export price. The total output value increased at an average annual rate of +2.3% over the period from 2013 to 2024; the trend pattern indicated some noticeable fluctuations being recorded throughout the analyzed period. The most prominent rate of growth was recorded in 2022 with an increase of 20% against the previous year. As a result, production attained the peak level of $20B. From 2023 to 2024, production growth remained at a somewhat lower figure.
Production By Type
Whole fresh milk (16M tons) constituted the product with the largest volume of production, accounting for 74% of total volume. Moreover, whole fresh milk exceeded the figures recorded for the second-largest type, skim milk (3.5M tons), fourfold. The third position in this ranking was taken by cheese (842K tons), with a 4% share.
From 2013 to 2024, the average annual growth rate of the volume of whole fresh milk production totaled +1.1%. With regard to the other produced products, the following average annual rates of growth were recorded: skim milk (+0.8% per year) and cheese (+5.3% per year).
In value terms, the most produced types of dairy produce in the UK were whole fresh milk ($7.9B), cheese ($4.6B) and skim milk ($3.4B), with a combined 84% share of the total output. Butter and dairy spreads, yoghurt and fermented milk, powdered milk, evaporated and condensed milk, ghee and cream fresh lagged somewhat behind, together accounting for a further 16%.
In terms of the main produced products, powdered milk, with a CAGR of +5.1%, recorded the highest growth rate of market size over the period under review, while production for the other products experienced more modest paces of growth.
ImportsUnited Kingdom’s Imports of Dairy
In 2024, overseas purchases of dairy produce were finally on the rise to reach 1.2M tons after five years of decline. Overall, imports, however, saw a relatively flat trend pattern. Imports peaked at 1.4M tons in 2018; however, from 2019 to 2024, imports failed to regain momentum.
In value terms, dairy produce imports expanded sharply to $4.3B in 2024. Over the period under review, imports showed a relatively flat trend pattern. The most prominent rate of growth was recorded in 2017 with an increase of 12%. Imports peaked in 2024 and are likely to see steady growth in the immediate term.
Imports By Country
In 2024, Ireland (398K tons) constituted the largest dairy produce supplier to the UK, with a 34% share of total imports. Moreover, dairy produce imports from Ireland exceeded the figures recorded by the second-largest supplier, France (152K tons), threefold. Germany (147K tons) ranked third in terms of total imports with a 13% share.
From 2013 to 2024, the average annual growth rate of volume from Ireland was relatively modest. The remaining supplying countries recorded the following average annual rates of imports growth: France (-6.6% per year) and Germany (-1.5% per year).
In value terms, Ireland ($1B), France ($595M) and Italy ($445M) were the largest dairy produce suppliers to the UK, together accounting for 49% of total imports. Germany, Denmark, Greece, the Netherlands, Belgium and Poland lagged somewhat behind, together comprising a further 39%.
In terms of the main suppliers, Greece, with a CAGR of +12.1%, saw the highest rates of growth with regard to the value of imports, over the period under review, while purchases for the other leaders experienced more modest paces of growth.
Imports By Type
Cheese (450K tons), yoghurt and fermented milk (307K tons) and whole fresh milk (208K tons) were the main products of dairy produce imports to the UK, together comprising 83% of total imports. Butter and dairy spreads, evaporated and condensed milk, cream fresh, powdered milk, skim milk and ghee lagged somewhat behind, together comprising a further 17%.
From 2013 to 2024, the biggest increases were recorded for cream fresh (with a CAGR of +4.2%), while purchases for the other products experienced more modest paces of growth.
In value terms, cheese ($2.7B) constituted the largest type of dairy produce supplied to the UK, comprising 62% of total imports. The second position in the ranking was taken by yoghurt and fermented milk ($668M), with a 16% share of total imports. It was followed by butter and dairy spreads, with an 8.6% share.
From 2013 to 2024, the average annual rate of growth in terms of the value of cheese imports totaled +1.5%. With regard to the other supplied products, the following average annual rates of growth were recorded: yoghurt and fermented milk (+1.3% per year) and butter and dairy spreads (-1.9% per year).
Import Prices By Type
The average dairy produce import price stood at $3,666 per ton in 2024, approximately equating the previous year. Over the period from 2013 to 2024, it increased at an average annual rate of +1.7%. The pace of growth appeared the most rapid in 2022 an increase of 20%. Over the period under review, average import prices reached the maximum in 2024 and is expected to retain growth in years to come.
Prices varied noticeably by the product type; the product with the highest price was ghee ($8,778 per ton), while the price for skim milk ($246 per ton) was amongst the lowest.
From 2013 to 2024, the most notable rate of growth in terms of prices was attained by cream fresh (+6.9%), while the prices for the other products experienced more modest paces of growth.
Import Prices By Country
The average dairy produce import price stood at $3,666 per ton in 2024, approximately reflecting the previous year. Over the last eleven years, it increased at an average annual rate of +1.7%. The pace of growth appeared the most rapid in 2022 when the average import price increased by 20%. Over the period under review, average import prices reached the peak figure in 2024 and is expected to retain growth in years to come.
Prices varied noticeably by country of origin: amid the top importers, the country with the highest price was Italy ($9,291 per ton), while the price for Ireland ($2,603 per ton) was amongst the lowest.
From 2013 to 2024, the most notable rate of growth in terms of prices was attained by France (+4.1%), while the prices for the other major suppliers experienced more modest paces of growth.
ExportsUnited Kingdom’s Exports of Dairy
After two years of growth, shipments abroad of dairy produce decreased by -1% to 1.2M tons in 2024. The total export volume increased at an average annual rate of +2.6% from 2013 to 2024; however, the trend pattern indicated some noticeable fluctuations being recorded in certain years. The pace of growth was the most pronounced in 2017 with an increase of 19% against the previous year. Over the period under review, the exports hit record highs at 1.4M tons in 2019; however, from 2020 to 2024, the exports stood at a somewhat lower figure.
In value terms, dairy produce exports stood at $2.2B in 2024. The total export value increased at an average annual rate of +1.9% from 2013 to 2024; however, the trend pattern indicated some noticeable fluctuations being recorded in certain years. The pace of growth was the most pronounced in 2017 with an increase of 24% against the previous year. The exports peaked at $2.2B in 2022; afterwards, it flattened through to 2024.
Exports By Country
The Netherlands (61K tons), Ireland (44K tons) and Belgium (25K tons) were the main destinations of dairy produce exports from the UK, together comprising 11% of total exports. France, Poland, the United States, Egypt, Denmark, Germany and Spain lagged somewhat behind, together accounting for a further 6.9%.
From 2013 to 2024, the most notable rate of growth in terms of shipments, amongst the main countries of destination, was attained by Egypt (with a CAGR of +69.0%), while the other leaders experienced more modest paces of growth.
In value terms, the Netherlands ($206M), France ($122M) and Ireland ($106M) constituted the largest markets for dairy produce exported from the UK worldwide, together comprising 20% of total exports. The United States, Belgium, Germany, Spain, Denmark, Poland and Egypt lagged somewhat behind, together comprising a further 18%.
Among the main countries of destination, Egypt, with a CAGR of +58.5%, recorded the highest rates of growth with regard to the value of exports, over the period under review, while shipments for the other leaders experienced more modest paces of growth.
Exports By Type
Whole fresh milk (739K tons) was the largest type of dairy produce exported from the UK, with a 63% share of total exports. Moreover, whole fresh milk exceeded the volume of the second product type, cheese (197K tons), fourfold. Powdered milk (66K tons) ranked third in terms of total exports with a 5.6% share.
From 2013 to 2024, the average annual rate of growth in terms of the volume of whole fresh milk exports stood at +3.2%. With regard to the other exported products, the following average annual rates of growth were recorded: cheese (+4.2% per year) and powdered milk (-2.6% per year).
In value terms, cheese ($1.1B) remains the largest type of dairy produce exported from the UK, comprising 51% of total exports. The second position in the ranking was held by whole fresh milk ($390M), with an 18% share of total exports. It was followed by powdered milk, with a 9.5% share.
From 2013 to 2024, the average annual rate of growth in terms of the value of cheese exports amounted to +4.6%. With regard to the other exported products, the following average annual rates of growth were recorded: whole fresh milk (+3.2% per year) and powdered milk (-4.2% per year).
Export Prices By Type
In 2024, the average dairy produce export price amounted to $1,895 per ton, increasing by 2.6% against the previous year. In general, the export price, however, saw a relatively flat trend pattern. The most prominent rate of growth was recorded in 2022 when the average export price increased by 20%. Over the period under review, the average export prices reached the peak figure at $2,042 per ton in 2013; however, from 2014 to 2024, the export prices stood at a somewhat lower figure.
There were significant differences in the average prices for the major types of exported product. In 2024, the product with the highest price was ghee ($8,588 per ton), while the average price for exports of skim milk ($400 per ton) was amongst the lowest.
From 2013 to 2024, the most notable rate of growth in terms of prices was recorded for the following types: ghee (+3.1%), while the prices for the other products experienced more modest paces of growth.
Export Prices By Country
The average dairy produce export price stood at $1,895 per ton in 2024, with an increase of 2.6% against the previous year. Overall, the export price, however, showed a relatively flat trend pattern. The most prominent rate of growth was recorded in 2022 an increase of 20%. Over the period under review, the average export prices reached the peak figure at $2,042 per ton in 2013; however, from 2014 to 2024, the export prices remained at a lower figure.
There were significant differences in the average prices for the major foreign markets. In 2024, amid the top suppliers, the country with the highest price was the United States ($9,443 per ton), while the average price for exports to Ireland ($2,407 per ton) was amongst the lowest.
From 2013 to 2024, the most notable rate of growth in terms of prices was recorded for supplies to Ireland (+7.9%), while the prices for the other major destinations experienced more modest paces of growth.
Source: IndexBox Market Intelligence Platform
This report provides a comprehensive view of the dairy produce industry in the United Kingdom, tracking demand, supply, and trade flows across the national value chain. It explains how demand across key channels and end-use segments shapes consumption patterns, while also mapping the role of input availability, production efficiency, and regulatory standards on supply.
Beyond headline metrics, the study benchmarks prices, margins, and trade routes so you can see where value is created and how it moves between domestic suppliers and international partners. The analysis is designed to support strategic planning, market entry, portfolio prioritization, and risk management in the dairy produce landscape in the United Kingdom.
Quick navigation
Key findings
Domestic demand is shaped by both household and industrial usage, with trade flows linking local supply to imports and exports.
Pricing dynamics reflect unit values, freight costs, exchange rates, and regulatory shifts that affect sourcing decisions.
Supply depends on input availability and production efficiency, creating a distinct national cost curve.
Market concentration varies by segment, creating different competitive landscapes and entry barriers.
The 2035 outlook highlights where capacity investment and demand growth are most aligned within the country.
Report scope
The report combines market sizing with trade intelligence and price analytics for the United Kingdom. It covers both historical performance and the forward outlook to 2035, allowing you to compare cycles, structural shifts, and policy impacts.
Market size and growth in value and volume terms
Consumption structure by end-use segments
Production capacity, output, and cost dynamics
Trade flows, exporters, importers, and balances
Price benchmarks, unit values, and margin signals
Competitive context and market entry conditions
Product coverageFCL 888 – Skim Milk of CowsFCL 1130 – Camel milkFCL 882 – Cow milk, whole (fresh)FCL 1020 – Goat milkFCL 982 – Sheep milkFCL 951 – Buffalo milkFCL 897 – Dry Whole Cow MilkFCL 898 – Dry Skim Cow MilkFCL 889 – Whole Milk, CondensedFCL 894 – Whole Milk, EvaporatedFCL 895 – Skim Milk, EvaporatedFCL 896 – Skim Milk, CondensedFCL 891 – YoghurtFCL 983 – Butter and Ghee of Sheep MilkFCL 1022 – Butter of Goat MilkFCL 952 – Butter of Buffalo MilkFCL 886 – Butter of Cow MilkFCL 887 – Ghee from Cow MilkFCL 953 – Ghee, from Buffalo MilkFCL 901 – Cheese from Whole Cow MilkFCL 904 – Cheese from Skimmed Cow MilkFCL 905 – Whey CheeseFCL 907 – Processed CheeseFCL 955 – Cheese of Buffalo MilkFCL 984 – Cheese of Sheep MilkFCL 1021 – Cheese of Goat MilkFCL 885 – Cream, FreshFCL 893 – Buttermilk, Curdled Milk, Acidified MilkFCL 899 – Dry ButtermilkFCL 892 – Yoghurt, Concentrated or UnconcentCountry coverageCountry profile and benchmarks
This report provides a consistent view of market size, trade balance, prices, and per-capita indicators for the United Kingdom. The profile highlights demand structure and trade position, enabling benchmarking against regional and global peers.
Methodology
The analysis is built on a multi-source framework that combines official statistics, trade records, company disclosures, and expert validation. Data are standardized, reconciled, and cross-checked to ensure consistency across time series.
International trade data (exports, imports, and mirror statistics)
National production and consumption statistics
Company-level information from financial filings and public releases
Price series and unit value benchmarks
Analyst review, outlier checks, and time-series validation
All data are normalized to a common product definition and mapped to a consistent set of codes. This ensures that comparisons across time are aligned and actionable.
Forecasts to 2035
The forecast horizon extends to 2035 and is based on a structured model that links dairy produce demand and supply to macroeconomic indicators, trade patterns, and sector-specific drivers. The model captures both cyclical and structural factors and reflects known policy and technology shifts in the United Kingdom.
Historical baseline: 2012-2025
Forecast horizon: 2026-2035
Scenario-based sensitivity to income growth, substitution, and regulation
Capacity and investment outlook for major producing companies
Each projection is built from national historical patterns and the broader regional context, allowing the report to show where growth is concentrated and where risks are elevated.
Price analysis and trade dynamics
Prices are analyzed in detail, including export and import unit values, regional spreads, and changes in trade costs. The report highlights how seasonality, freight rates, exchange rates, and supply disruptions influence pricing and margins.
Price benchmarks by country and sub-region
Export and import unit value trends
Seasonality and calendar effects in trade flows
Price outlook to 2035 under baseline assumptions
Profiles of market participants
Key producers, exporters, and distributors are profiled with a focus on their operational scale, geographic footprint, product mix, and market positioning. This helps identify competitive pressure points, partnership opportunities, and routes to differentiation.
Business focus and production capabilities
Geographic reach and distribution networks
Cost structure and pricing strategy indicators
Compliance, certification, and sustainability context
How to use this report
Quantify domestic demand and identify the most attractive segments
Evaluate export opportunities and prioritize target destinations
Track price dynamics and protect margins
Benchmark performance against leading competitors
Build evidence-based forecasts for investment decisions
This report is designed for manufacturers, distributors, importers, wholesalers, investors, and advisors who need a clear, data-driven picture of dairy produce dynamics in the United Kingdom.
FAQ
What is included in the dairy produce market in the United Kingdom?
The market size aggregates consumption and trade data, presented in both value and volume terms.
How are the forecasts to 2035 built?
The projections combine historical trends with macroeconomic indicators, trade dynamics, and sector-specific drivers.
Does the report cover prices and margins?
Yes, it includes export and import unit values, regional spreads, and a pricing outlook to 2035.
Which benchmarks are included?
The report benchmarks market size, trade balance, prices, and per-capita indicators for the United Kingdom.
Can this report support market entry decisions?
Yes, it highlights demand hotspots, trade routes, pricing trends, and competitive context.