
Feb 22, 2026
IndexBox has just published a new report: United Kingdom – Knitting Machines – Market Analysis, Forecast, Size, Trends And Insights.
This article provides a comprehensive analysis of the United Kingdom’s knitting machines market in 2024, with forecasts to 2035. It details a significant one-year surge in consumption and production in 2024, though long-term trends show a market still recovering from a peak in 2013. The market is forecast to grow slowly in volume (CAGR +0.8%) and value (CAGR +1.3%) through 2035. The report also examines trade, noting a sharp decline in imports and a dramatic collapse in export volume, alongside skyrocketing average export prices due to a shift in product mix. Key suppliers include China, Germany, and Japan, while the United States is the leading export destination.
Key Findings
UK market consumption and production spiked dramatically in 2024 but remain well below 2013 peaksThe market is forecast for modest growth to 2035 with a +0.8% volume and +1.3% value CAGRImports have fallen sharply, with Japan, Germany, and Taiwan (Chinese) being the leading value suppliersExports collapsed in volume by -98.4% in 2024, but average unit price surged over 4,400%The United States is the primary export destination by volume and value, followed by Turkey and FranceMarket Forecast
Driven by rising demand for knitting machines in the UK, the market is expected to start an upward consumption trend over the next decade. The performance of the market is forecast to increase slightly, with an anticipated CAGR of +0.8% for the period from 2024 to 2035, which is projected to bring the market volume to 46K units by the end of 2035.
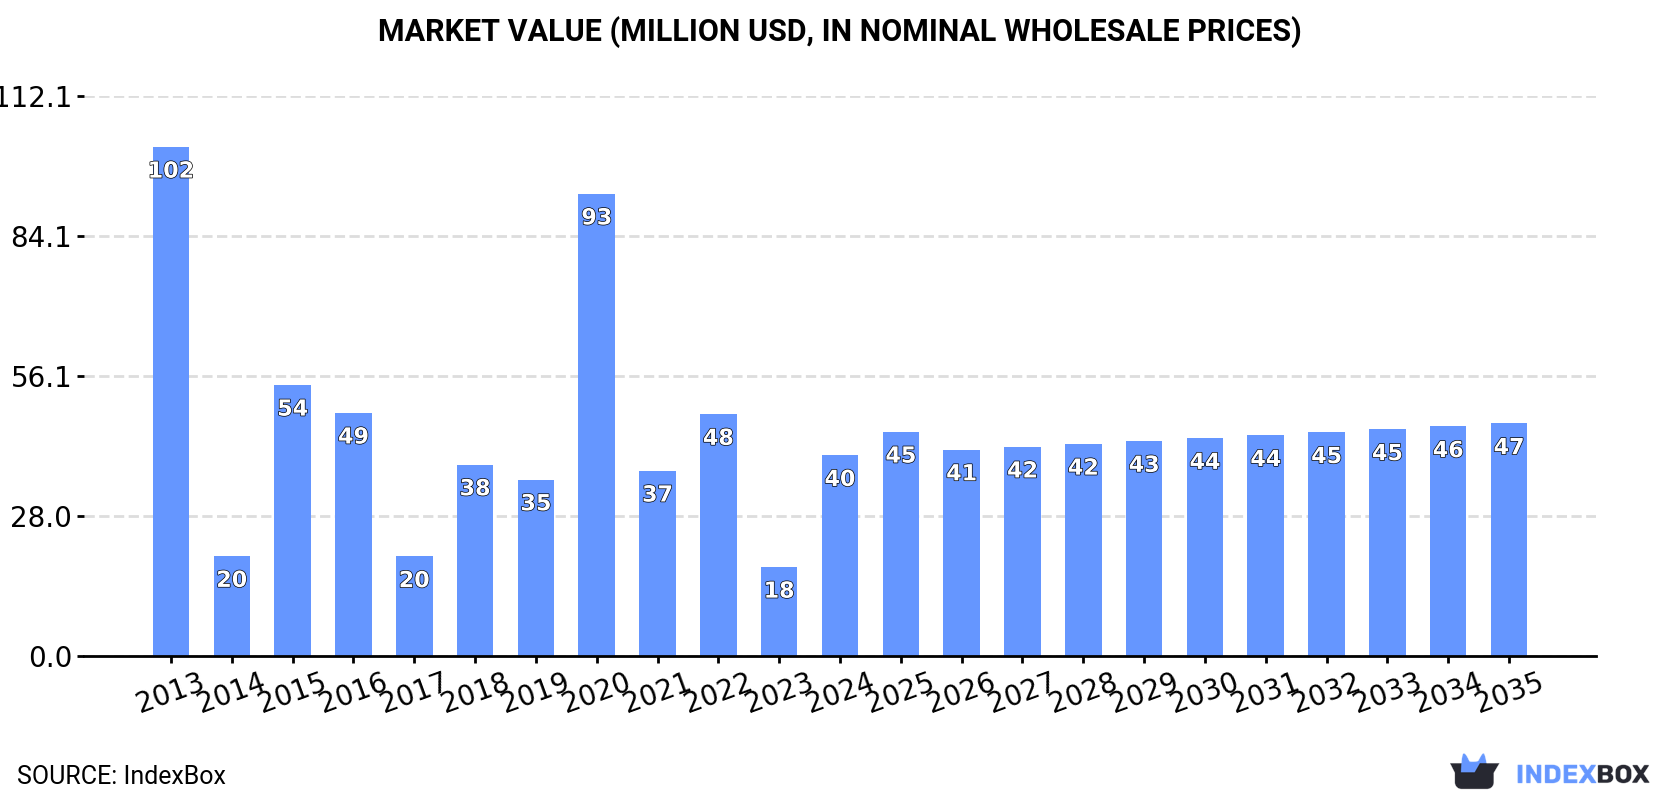
In value terms, the market is forecast to increase with an anticipated CAGR of +1.3% for the period from 2024 to 2035, which is projected to bring the market value to $47M (in nominal wholesale prices) by the end of 2035.
 ConsumptionUnited Kingdom’s Consumption of Knitting Machines
In 2024, the amount of knitting machineses consumed in the UK skyrocketed to 42K units, picking up by 120% compared with 2023 figures. In general, consumption, however, recorded a abrupt decline. Over the period under review, consumption reached the maximum volume at 132K units in 2013; however, from 2014 to 2024, consumption failed to regain momentum.
The size of the knitting machines market in the UK surged to $40M in 2024, rising by 125% against the previous year. This figure reflects the total revenues of producers and importers (excluding logistics costs, retail marketing costs, and retailers’ margins, which will be included in the final consumer price). Overall, consumption, however, continues to indicate a abrupt curtailment. Knitting machines consumption peaked at $102M in 2013; however, from 2014 to 2024, consumption failed to regain momentum.
ProductionUnited Kingdom’s Production of Knitting Machines
In 2024, the amount of knitting machineses produced in the UK soared to 29K units, growing by 50% on the previous year’s figure. Over the period under review, production, however, showed a abrupt curtailment. The most prominent rate of growth was recorded in 2022 when the production volume increased by 3,904,700% against the previous year. Knitting machines production peaked at 106K units in 2013; however, from 2014 to 2024, production stood at a somewhat lower figure.
In value terms, knitting machines production surged to $336M in 2024 estimated in export price. In general, production, however, continues to indicate a abrupt curtailment. The most prominent rate of growth was recorded in 2022 with an increase of 4,646,313% against the previous year. Knitting machines production peaked at $880M in 2013; however, from 2014 to 2024, production stood at a somewhat lower figure.
ImportsUnited Kingdom’s Imports of Knitting Machines
In 2024, overseas purchases of knitting machineses decreased by -24.3% to 13K units, falling for the fourth year in a row after three years of growth. Overall, imports recorded a abrupt slump. The most prominent rate of growth was recorded in 2016 when imports increased by 108%. As a result, imports attained the peak of 98K units. From 2017 to 2024, the growth of imports remained at a somewhat lower figure.
In value terms, knitting machines imports declined dramatically to $23M in 2024. Over the period under review, imports saw a perceptible contraction. The pace of growth was the most pronounced in 2022 when imports increased by 76% against the previous year. As a result, imports reached the peak of $36M. From 2023 to 2024, the growth of imports remained at a lower figure.
Imports By Country
China (2.9K units), Germany (2.8K units) and Japan (2.2K units) were the main suppliers of knitting machines imports to the UK, with a combined 58% share of total imports. Vietnam, Turkey, Taiwan (Chinese) and the United States lagged somewhat behind, together comprising a further 38%.
From 2013 to 2024, the biggest increases were recorded for Vietnam (with a CAGR of +9.2%), while purchases for the other leaders experienced a decline.
In value terms, Japan ($6.1M) constituted the largest supplier of knitting machineses to the UK, comprising 27% of total imports. The second position in the ranking was taken by Germany ($2.7M), with a 12% share of total imports. It was followed by Taiwan (Chinese), with a 12% share.
From 2013 to 2024, the average annual growth rate of value from Japan totaled -5.7%. The remaining supplying countries recorded the following average annual rates of imports growth: Germany (-8.6% per year) and Taiwan (Chinese) (+9.4% per year).
Import Prices By Country
The average knitting machines import price stood at $1.7 thousand per unit in 2024, with an increase of 10% against the previous year. Overall, the import price recorded a prominent increase. The growth pace was the most rapid in 2022 an increase of 175% against the previous year. Over the period under review, average import prices hit record highs in 2024 and is likely to continue growth in the immediate term.
There were significant differences in the average prices amongst the major supplying countries. In 2024, amid the top importers, the country with the highest price was Taiwan (Chinese) ($2.9 thousand per unit), while the price for Turkey ($394 per unit) was amongst the lowest.
From 2013 to 2024, the most notable rate of growth in terms of prices was attained by China (+26.0%), while the prices for the other major suppliers experienced more modest paces of growth.
ExportsUnited Kingdom’s Exports of Knitting Machines
In 2024, knitting machines exports from the UK reduced sharply to 295 units, with a decrease of -98.4% on 2023 figures. Over the period under review, exports saw a sharp descent. The pace of growth was the most pronounced in 2019 with an increase of 167%. The exports peaked at 53K units in 2014; however, from 2015 to 2024, the exports stood at a somewhat lower figure.
In value terms, knitting machines exports dropped sharply to $8.9M in 2024. In general, exports saw a abrupt decline. The pace of growth was the most pronounced in 2014 with an increase of 30% against the previous year. As a result, the exports reached the peak of $29M. From 2015 to 2024, the growth of the exports remained at a lower figure.
Exports By Country
The United States (155 units) was the main destination for knitting machines exports from the UK, with a 53% share of total exports. Moreover, knitting machines exports to the United States exceeded the volume sent to the second major destination, Germany (57 units), threefold. Lithuania (12 units) ranked third in terms of total exports with a 4.1% share.
From 2013 to 2024, the average annual growth rate of volume to the United States amounted to -26.8%. Exports to the other major destinations recorded the following average annual rates of exports growth: Germany (-30.0% per year) and Lithuania (-32.5% per year).
In value terms, the United States ($1.4M) remains the key foreign market for knitting machineses exports from the UK, comprising 15% of total exports. The second position in the ranking was held by Turkey ($655K), with a 7.3% share of total exports. It was followed by France, with a 5.1% share.
From 2013 to 2024, the average annual rate of growth in terms of value to the United States amounted to +2.7%. Exports to the other major destinations recorded the following average annual rates of exports growth: Turkey (-12.0% per year) and France (-10.9% per year).
Export Prices By Country
The average knitting machines export price stood at $30 thousand per unit in 2024, surging by 4,465% against the previous year. Over the period under review, the export price enjoyed a significant expansion. As a result, the export price reached the peak level and is likely to continue growth in the immediate term.
There were significant differences in the average prices for the major external markets. In 2024, amid the top suppliers, the country with the highest price was Turkey ($328 thousand per unit), while the average price for exports to South Korea ($1.3 thousand per unit) was amongst the lowest.
From 2013 to 2024, the most notable rate of growth in terms of prices was recorded for supplies to Ireland (+67.4%), while the prices for the other major destinations experienced more modest paces of growth.
Source: IndexBox Market Intelligence Platform
This report provides a comprehensive view of the knitting machines industry in the United Kingdom, tracking demand, supply, and trade flows across the national value chain. It explains how demand across key channels and end-use segments shapes consumption patterns, while also mapping the role of input availability, production efficiency, and regulatory standards on supply.
Beyond headline metrics, the study benchmarks prices, margins, and trade routes so you can see where value is created and how it moves between domestic suppliers and international partners. The analysis is designed to support strategic planning, market entry, portfolio prioritization, and risk management in the knitting machines landscape in the United Kingdom.
Quick navigation
Key findings
Domestic demand is shaped by both household and industrial usage, with trade flows linking local supply to imports and exports.
Pricing dynamics reflect unit values, freight costs, exchange rates, and regulatory shifts that affect sourcing decisions.
Supply depends on input availability and production efficiency, creating a distinct national cost curve.
Market concentration varies by segment, creating different competitive landscapes and entry barriers.
The 2035 outlook highlights where capacity investment and demand growth are most aligned within the country.
Report scope
The report combines market sizing with trade intelligence and price analytics for the United Kingdom. It covers both historical performance and the forward outlook to 2035, allowing you to compare cycles, structural shifts, and policy impacts.
Market size and growth in value and volume terms
Consumption structure by end-use segments
Production capacity, output, and cost dynamics
Trade flows, exporters, importers, and balances
Price benchmarks, unit values, and margin signals
Competitive context and market entry conditions
Product coverageProdcom 28941430 – Circular knitting machinesProdcom 28941450 – Flat knitting machines, stitch-bonding machines and warp knitting machinesProdcom 28941470 – Machines for making gimped yarn, tulle, lace, embroidery, t rimmings, braid or net, and machines for tuftingCountry coverageCountry profile and benchmarks
This report provides a consistent view of market size, trade balance, prices, and per-capita indicators for the United Kingdom. The profile highlights demand structure and trade position, enabling benchmarking against regional and global peers.
Methodology
The analysis is built on a multi-source framework that combines official statistics, trade records, company disclosures, and expert validation. Data are standardized, reconciled, and cross-checked to ensure consistency across time series.
International trade data (exports, imports, and mirror statistics)
National production and consumption statistics
Company-level information from financial filings and public releases
Price series and unit value benchmarks
Analyst review, outlier checks, and time-series validation
All data are normalized to a common product definition and mapped to a consistent set of codes. This ensures that comparisons across time are aligned and actionable.
Forecasts to 2035
The forecast horizon extends to 2035 and is based on a structured model that links knitting machines demand and supply to macroeconomic indicators, trade patterns, and sector-specific drivers. The model captures both cyclical and structural factors and reflects known policy and technology shifts in the United Kingdom.
Historical baseline: 2012-2025
Forecast horizon: 2026-2035
Scenario-based sensitivity to income growth, substitution, and regulation
Capacity and investment outlook for major producing companies
Each projection is built from national historical patterns and the broader regional context, allowing the report to show where growth is concentrated and where risks are elevated.
Price analysis and trade dynamics
Prices are analyzed in detail, including export and import unit values, regional spreads, and changes in trade costs. The report highlights how seasonality, freight rates, exchange rates, and supply disruptions influence pricing and margins.
Price benchmarks by country and sub-region
Export and import unit value trends
Seasonality and calendar effects in trade flows
Price outlook to 2035 under baseline assumptions
Profiles of market participants
Key producers, exporters, and distributors are profiled with a focus on their operational scale, geographic footprint, product mix, and market positioning. This helps identify competitive pressure points, partnership opportunities, and routes to differentiation.
Business focus and production capabilities
Geographic reach and distribution networks
Cost structure and pricing strategy indicators
Compliance, certification, and sustainability context
How to use this report
Quantify domestic demand and identify the most attractive segments
Evaluate export opportunities and prioritize target destinations
Track price dynamics and protect margins
Benchmark performance against leading competitors
Build evidence-based forecasts for investment decisions
This report is designed for manufacturers, distributors, importers, wholesalers, investors, and advisors who need a clear, data-driven picture of knitting machines dynamics in the United Kingdom.
FAQ
What is included in the knitting machines market in the United Kingdom?
The market size aggregates consumption and trade data, presented in both value and volume terms.
How are the forecasts to 2035 built?
The projections combine historical trends with macroeconomic indicators, trade dynamics, and sector-specific drivers.
Does the report cover prices and margins?
Yes, it includes export and import unit values, regional spreads, and a pricing outlook to 2035.
Which benchmarks are included?
The report benchmarks market size, trade balance, prices, and per-capita indicators for the United Kingdom.
Can this report support market entry decisions?
Yes, it highlights demand hotspots, trade routes, pricing trends, and competitive context.