
An interactive map shows the nation’s fly-tipping hotspots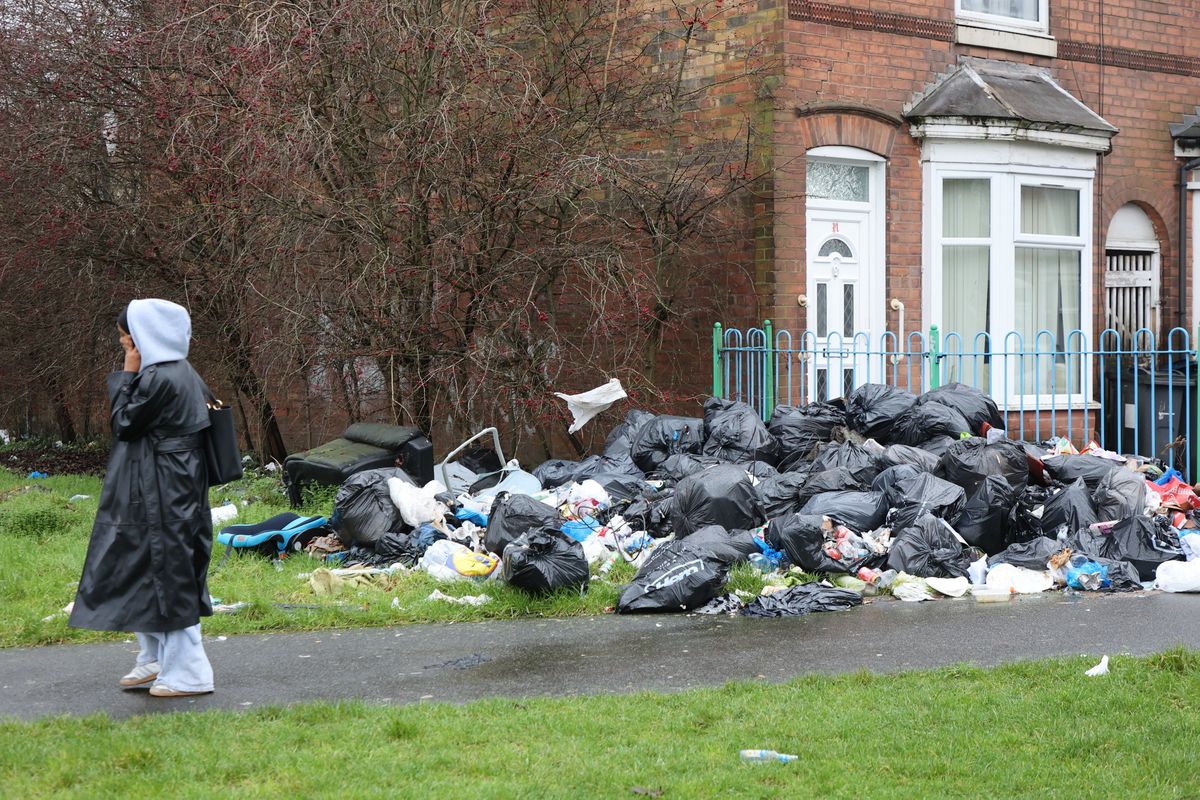
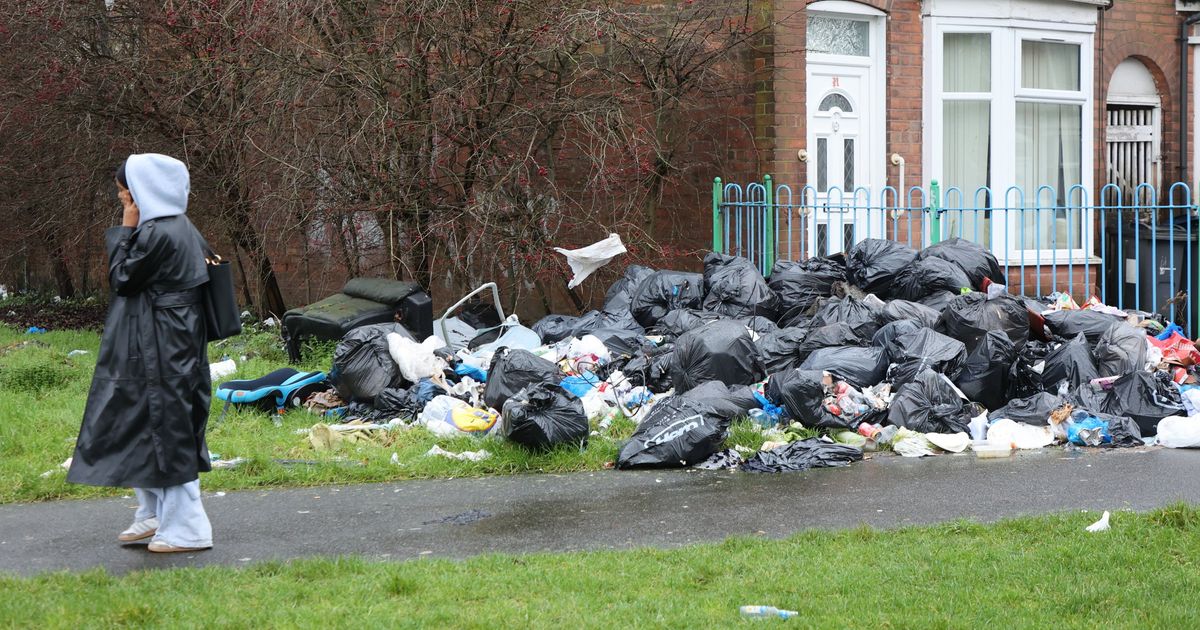
Henry Barber Park in Bordesley Green(Image: Anita Maric / SWNS)
An interactive map has shown which areas in England have the worst fly-tippers, with Birmingham named among the top spots.
In the year ending March 2025, local authorities in England dealt with 1.25 million fly tipping incidents – a 9% rise on the previous year.
That included 777,000 collections of household waste ranging from bin bags to old furniture and carpets, 7,000 of animal carcasses, 70,000 dumps of commercial waste, and 3,000 involving asbestos.
READ MORE: Secret to getting the best of BirminghamLive’s stories
The highest number of fly-tipping incidents per capita was seen in London boroughs.
But Birmingham suffered most from large-scale fly-tipping incidents. A total of 3,462 incidents involving tipper trucks and multiple or significant dumps or waste cost Birmingham, taxpayers £2.10 million in cleanup costs.
That’s the equivalent of £1.78 from the pockets of everyone who lives in the city on large-scale cleanups alone.
Croydon in South London saw the highest volume of fly-tipping last year, with 53,000 separate incidents. That included 1,585 large-scale incidents, which are when a tipper lorry load of rubbish or more is dumped.
But Camden had the highest number of fly-tipping incidents compared to the population size. A total of 36,126 incidents added up to the equivalent of 167 for every 1,000 residents. That’s the equivalent of one illegal dump per six people.
Croydon was next with 130 incidents per 1,000 people, and then Hackney (116).
Outside the capital, Nottingham had the biggest rubbish problem, with 26,138 separate incidents, or 79 for every 1,000 residents, followed by Great Yarmouth (77), and Boston in Lincolnshire (66).
Taxpayers in Leeds had the next-highest bill from industrial-scale fly-tipping (£1.63 per person), followed by Wirral (£1.33).
Defra has not published the cleanup costs for overall fly-tipping incidents, only the large-scale dumps.
You can see how badly your area is affected by fly-tipping and how it compares to the rest of England, using our interactive map.
Nearly two-thirds of fly-tipping (62%) involved household waste, which ranges from black bags of day-to-day rubbish to old furniture, carpets and bric-a-brac from loft and shed clearances.
Fly-tipping most commonly occurs on pavements and roads, accounting for more than a third of cases (37%), according to the figures, and almost a third of incidents (31%) were the size of a small van load, while 27% were the equivalent to a car boot or less.
However, 52,000 cases involved an amount of rubbish that was equivalent to a tipper lorry load or more, an 11% increase, costing councils in England £19.26 million to clear up.
In addition to the figures from local authorities, the Environment Agency dealt with 98 incidents of large-scale illegal dumping last year, Defra said.
In response, councils issued 572,000 enforcement actions, an 8% increase on the previous year, and 69,000 fixed penalty notices, a 9% rise.
However, the number of court fines fell by 9% to 1,250, and the combined value of those fines dropped from £730,000 to £673,000.
Councils also seized 139 vehicles last year.
New guidance has been published by Defra to help councils seize and crush more vehicles used for fly-tipping, or repurpose them for clean-up operations, along with advice on how to take cases to court.
Councils are also being urged to name and shame fly-tippers on social media.
Defra Minister Mary Creagh said: “We are empowering local authorities to clamp down on waste cowboys and restore pride in our local areas.
“I share the public’s fury at seeing our streets, parks and fields used as dumping grounds.
“Fly-tippers should know – if you use your van to trash our countryside, don’t be surprised when it ends up on the scrapheap.”