
Our dataset comprises conversations classified as ‘Health and Fitness’. After applying the step 1 classifier (described in the Methods) and excluding two categories not analysed further (Not Health and Other Health/Fitness), the sample contains N = 617,827 conversations across the remaining intent categories. Of these, 99.1% have a known platform value and are included in the mobile-versus-desktop analysis; 99.6% have a valid timestamp and are included in the temporal analyses. The full category descriptions are presented in Table 1.
Table 1 Health intent taxonomyThe boundary between general information and personal health queries
Figure 1 shows the distribution of conversations across health intents. The largest category, ‘Health Information and Education’, accounts for 40.8% of conversations, 95% confidence interval (CI) 40.7–40.9. This category captures non-personalized queries, including how a medication works, what causes a condition, and general nutrition information. Its size is consistent with the finding that information seeking remains the dominant mode of health engagement online3. However, some queries framed in general terms may reflect underlying personal concerns, and the true share of personal health intents may be higher than the taxonomy suggests. We observe from topic clusters (Extended Data Table 1) that many queries are about specific treatments and conditions rather than general health education, further supporting the interpretation that users may seek general information as a step towards personal decision-making.
Fig. 1: Distribution of health intents.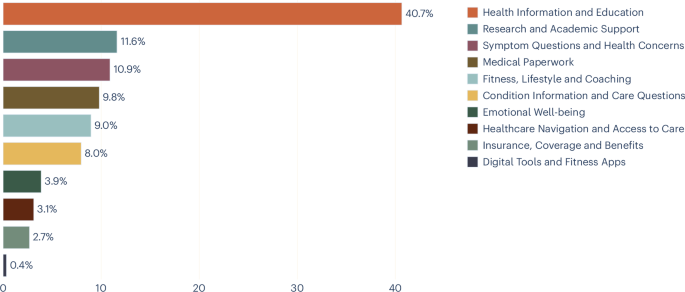 The alt text for this image may have been generated using AI.
Distribution of health intent usage, in percentage of conversations.
Device as a signal for intent
Figure 2 shows how the percentage of all conversations on desktop and mobile varies throughout the day, with the former more predominant during the day and the latter at night. This pattern reflects everyday routines: during working and school hours, users have access to desktop devices and may prefer them for longer or more complex tasks, whereas in the evening and at night, when people are away from their desks, the phone becomes the primary device for health queries.
Fig. 2: Mobile versus desktop usage throughout the day.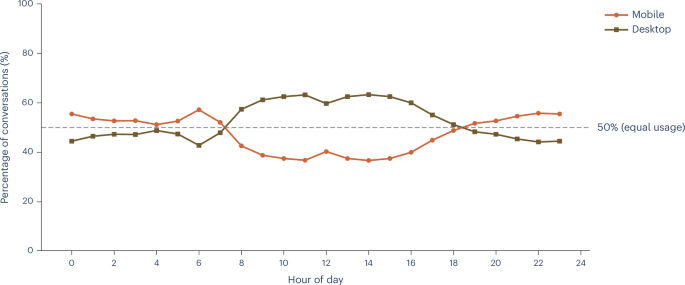 The alt text for this image may have been generated using AI.
Average percentage of mobile versus desktop health conversations, throughout the day.
Figure 3 compares intent distributions across mobile and desktop. ‘Digital Tools and Fitness Apps’ was excluded from the platform and temporal analyses, as manual review revealed that many conversations in this category were misclassified as health-related when users were seeking technical support for wearable devices. Intent distributions differ significantly between platforms (χ2(8, N = 612,330) = 73,981.6, P < 0.001). Besides ‘Health Information and Education’, which is close to 40% for both, the usage patterns are quite different between devices. The most striking differences are in personal versus professional intents: on mobile, ‘Symptom Questions and Health Concerns’ accounts for 15.9%, 95% CI 15.8–16.0, of conversations versus 6.9%, 95% CI 6.8–7.0, on desktop, and ‘Emotional Well-being’ is 5.1%, 95% CI 5.0–5.1, versus 3.0%, 95% CI 2.9–3.0. Conversely, ‘Research and Academic Support’ is 16.9%, 95% CI 16.8–17.1, on desktop versus 5.3%, 95% CI 5.2–5.3, on mobile, and ‘Medical Paperwork’ is 15.7%, 95% CI 15.6–15.8, versus 2.7%, 95% CI 2.7–2.8.
Fig. 3: Intent distribution by platform.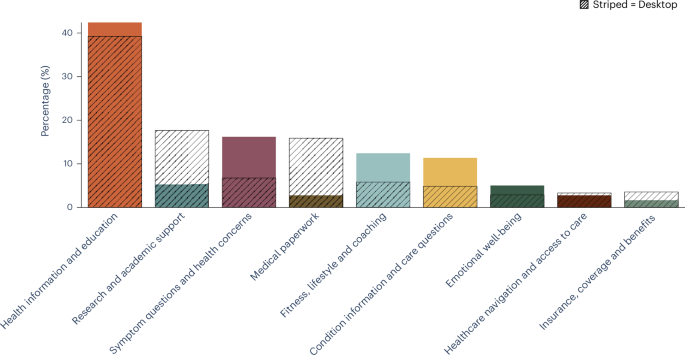 The alt text for this image may have been generated using AI.
Percentage of conversations per intent on mobile (solid colour) versus desktop (striped overlay).
Extended Data Figs. 1 and 2 show the breakdown of intents per hour of the day, with the top four highlighted. Although the predominance of ‘Health Information and Education’ on both platforms is expected given Fig. 1, on desktop its share decreases during working hours as ‘Research and Academic Support’ and ‘Medical Paperwork’ rise. This suggests that Copilot usage on desktop is often adjacent to another activity such as thesis writing, research or processing paperwork, tasks that typically require access to other documents or files alongside the conversation. ‘Medical Paperwork’ peaks during normal working hours, while ‘Research and Academic Support’ rises steadily throughout the day, particularly after work and school hours when researchers and students turn to their own projects. More broadly, the desktop pattern may reflect workflows that depend on multiple windows and reference materials, which are cumbersome to manage on a mobile device.
On mobile, the second most common intent is ‘Symptom Questions and Health Concerns’, followed by queries on conditions and fitness. This is consistent with mobile devices being used primarily for personal health queries rather than work-related tasks. In this case, the bottom five topics are separate from the top four and present a low percentage throughout the day.
When looking at the changes throughout the day compared with morning (again excluding ‘Digital Tools and Fitness Apps’ as above), the distinction between types of intent becomes more evident (Fig. 4), with the more personal intents (such as queries about conditions or emotional well-being) increasing in the evening and at night and the more scholarly ones (such as research or documentation) decreasing. The pattern is especially pronounced for ‘Emotional Well-being’, whose share increases by more than half from 3.3%, 95% CI 3.3–3.4, in the morning (6:00–12:00) to 5.2%, 95% CI 5.0–5.4, at nighttime (00:00–6:00) (χ2(23, N = 613,026) = 903.3, P < 0.001). Similarly, ‘Symptom Questions and Health Concerns’ rises from 10.6%, 95% CI 10.4–10.7, in the morning to 13.4%, 95% CI 13.1–13.8, at nighttime (χ2(23, N = 613,026) = 1,445.8, P < 0.001).
Fig. 4: Temporal changes in intent relative to morning.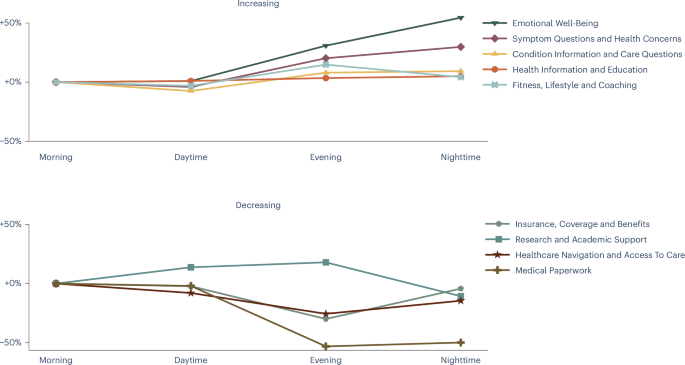 The alt text for this image may have been generated using AI.
Temporal changes of intent usage, relative to the morning. The y axes show percentage of the category relative to morning. (Percentage at morning is 0, if it increases it is +, if it decreases it is −.) The top graph shows the intents that increase throughout the day, and the bottom shows the ones that decrease.
Conversational AI as a health companion
We also examined who the health query is about (Fig. 5), using a subsample of n = 2,165 conversations drawn from the main dataset and annotated for the person the query concerns (a small number of conversations about pets and animals were excluded). This subsample comprises the three personal health intents: ‘Symptom Questions and Health Concerns’, ‘Condition Information and Care Questions’ and ‘Emotional Well-being’. In every category, most questions are asked on behalf of the users themselves. However, across both condition information and symptom questions, one in seven conversations are on behalf of someone else, whether a child, an aging parent or a partner: for ‘Symptom Questions and Health Concerns’, 14.5%, 95% CI 12.4–16.8, are about a dependent; for ‘Condition Information and Care Questions’, 14.9%, 95% CI 12.6–17.6; while for ‘Emotional Well-being’ 7.6%, 95% CI 5.4–10.5, concern a dependent.
Fig. 5: Who the health query is about.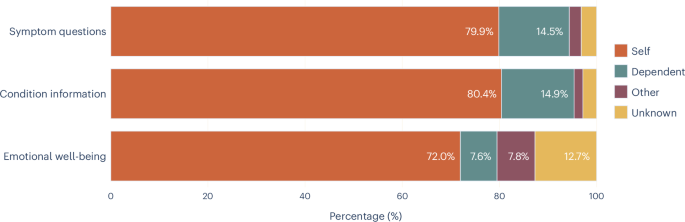 The alt text for this image may have been generated using AI.
Percentage of conversations on three intents (symptom questions, condition information and emotional well-being) related to the user, a dependent, other or unknown.
Extended Data Table 1 presents the five most common topic clusters for the six consumer-facing health intents, with within-category percentages. The remaining categories (Coverage and Benefits, Research and Academic Support, Medical Paperwork, and Digital Tools and Fitness Apps) primarily reflect professional or administrative use cases and were excluded from topic analysis by design. The clusters reveal that even the broadest category, ‘Health Information and Education’, is dominated by queries about specific treatments and conditions rather than abstract health knowledge, and that the narrower personal intents show clear concentrations around a small number of core needs.