
The UK has 90 different taxes – more than at any time since 1834. France, on the other hand, has 348. But Germany, which has overall levels of tax closer to France than the UK, has only 60.
Why is that? And are there lessons for the UK?
This is the third in a series. We first looked at all the UK’s 90 taxes, then at the historic trends that led to that point.
The charts are interactive: click on a segment or category to drill down. The control underneath switches between euros, percentage of GDP, and percentage of total tax.
France
Here’s the French tax system as it was in 2024:
Please rotate your phone to view
France raises a lot of tax: €1,321bn, equal to 45.3% of GDP, compared to 37% in the UK.
It does so with a huge number of taxes.
According to the Cour des comptes (Court of Audit) there are 243 “low-yield taxes”. 148 of those are included in the chart, although you generally have to zoom into a category or subcategory to make them out. There’s another 95 “low-yield taxes” where we couldn’t find any sources identifying the yield. That doesn’t (necessarily) mean they raise nothing but, absent any data, we’ve had to exclude them from the chart.
More visible on the chart are the long tail of small, often highly specific taxes: training levies, chamber taxes, insurance levies, sector charges, nuclear taxes, water levies, gambling levies, local land-agency taxes, and many more. Many are relics of history or political compromises; together they create a tax bureaucracy much more burdensome than we face in the UK.
The UK has seen a dramatic increase in the number of taxes since 1991; but it would still take us 200 years to equal the number of French taxes.
Germany
Germany is different. It is not a low-tax country: in 2024 it raised €1,817bn, equal to 42.2% of GDP. But the structure is much simpler than France’s – only 60 taxes:
Please rotate your phone to view
The big German taxes are familiar: social contributions, income tax, VAT, corporation tax, trade tax, insurance tax, energy tax, tobacco duty, inheritance tax and property taxes. The chart has a few German oddities, such as coffee duty, dog tax, the broadcasting contribution, and the solidarity surcharge. But there is nothing like the French long tail.
So Germany is interesting. It raises an enormous amount of tax without needing hundreds of separately reported taxes. Complexity is not an unavoidable consequence of a high tax burden.
Part of the explanation is that Germany had not one but two separate sets of reforms.
The German Federal Ministry of Finance traces many central features of the modern system back to the 1919-20 Reich financial reform: uniform taxation at federal level, income-tax reform, and a restructuring of fiscal relations between the federal and Länder governments.
The post-war Basic Law then constitutionalised a shared-tax federation. Article 105 centralises much tax legislation, and Article 106 allocates revenues: income tax, corporation tax and VAT are joint taxes shared between levels of government, while municipalities receive trade tax, property tax and shares of income tax and VAT.
Tax systems across Europe
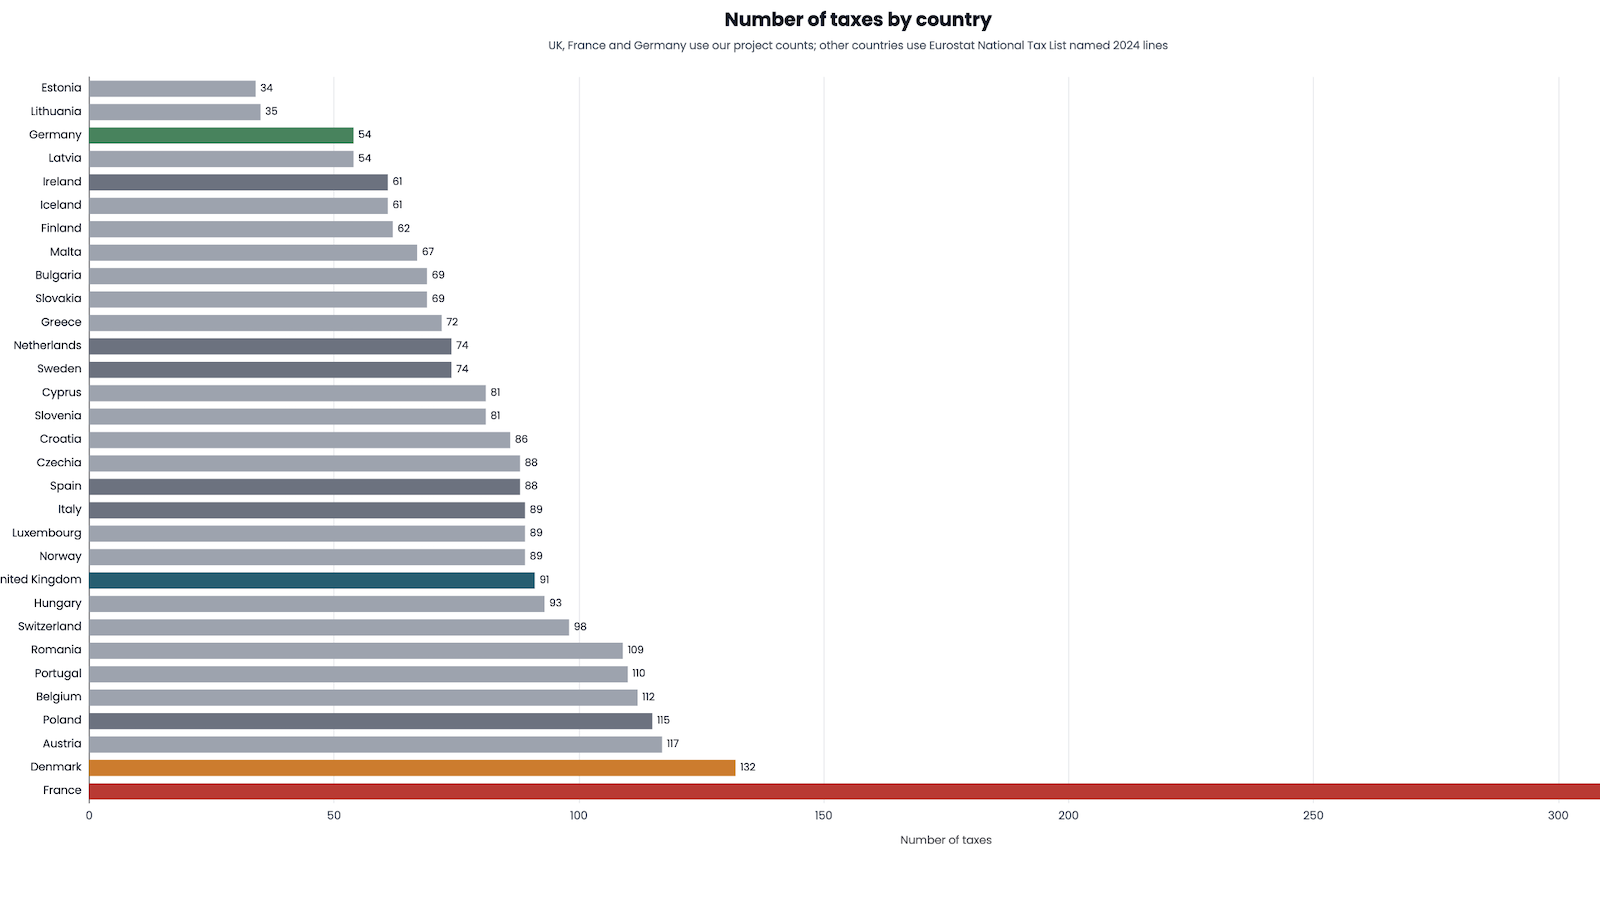
France and Germany are the extremes. If we run an approximate international comparison, we see that the UK sits between them:
Please rotate your phone to view
There is no obvious relationship between the number of taxes and the overall tax take:
Please rotate your phone to view
(France is initially hidden from the chart, because its anomalously high number of taxes “compresses” the other countries – the button at the bottom re-includes it.)
So it’s reasonably clear that a high-tax state does not require hundreds of taxes. Germany raises more tax than the UK, as a share of GDP, with far fewer separately reported taxes – and so do many others.
Does it matter?
We think it does. We usually focus on complexity within individual taxes, but “number of taxes” is also a sign of complexity. When you’re a company looking to do business, each tax means a new adviser, a new set of advice, and a new list of things you can and can’t do.
The Tax Foundation ranks France dead last in its table of international tax competitiveness. The UK is near the bottom – below many countries with higher overall level of tax. This accords with our experience that complexity can be more of a problem for business than the actual level of tax.
The UK is moving in the wrong direction. Our historical tax-count work suggests the UK now has more taxes than at any time since 1834. In the twentieth century the state became much larger, but did so through a relatively small number of broad taxes.
The recent pattern is different: more environmental taxes, devolved taxes, behavioural taxes and small segmented charges, often without a corresponding increase in the overall tax burden.
We don’t need to worry about turning into France – at least not for 200 years. But we should worry why we’re not more like Germany. And we could start by abolishing unnecessary and duplicative taxes.
Methodology
The tax counts in this article should not be regarded as definitive, and we are less confident than we were for the UK count. Our approach was as follows:
France
The French chart starts with the European Commission/Eurostat National Tax Lists workbook for France, 2024, which gives national-accounts tax and compulsory-social-contribution rows in million euros. The control total is €1,321.460bn: €1,326.081bn gross, less €4.621bn of D995 taxes and social contributions assessed but unlikely to be collected. Dividing that by INSEE 2024 current-price GDP of €2,920bn gives 45.3% of GDP.
We then added the Cour des comptes low-yield-tax inventory, because Eurostat often groups small French taxes into aggregates. To avoid double-counting, every separately shown low-yield tax is netted out of the relevant positive Eurostat aggregate. That is why the detailed chart still reconciles exactly to the Eurostat control total.
Negative rows are not shown as chart leaves; they only reduce the relevant positive amount. Rows with no usable individual amount remain outside the sunburst: there are 95 such current French low-yield taxes. They are included in the country-count comparison, but not in the revenue chart. So the French count is 348 taxes: 253 positive-yield chart leaves plus 95 no-yield current rows.
The classification is ours. It follows the UK chart where possible: employment, goods/services, business, land, wealth, environmental, and other. The purpose is to show what is being taxed, not the collecting body or legal form. Analogous categories use the same colours as in the UK chart.
Main French sources: Eurostat National Tax Lists; Cour des comptes, Les taxes à faible rendement; PLF 2025, Évaluations des voies et moyens – tome 1; and INSEE annual-average CPI releases for 2020, 2021, 2022, 2023 and 2024.
Germany
The German chart starts with the same Eurostat National Tax Lists workbook, using the Germany sheet for 2024. The Eurostat rows used for the chart sum to €1,816.514bn. Dividing that by Destatis 2024 current-price GDP of €4,305.3bn gives 42.2% of GDP.
We aggregate repeated Eurostat sector splits of the same economic tax, and use the German Federal Ministry of Finance 2024 cash receipts table only where it gives useful statutory detail inside a broader Eurostat control row. The solidarity surcharge is shown separately at €12.634bn and netted out of the related income-tax, capital-income-tax and corporation-tax rows.
The classification and colours are the same as for the UK and France. Negative BMF cash rows for wealth tax and investment grants are excluded from the chart rather than displayed as negative wedges. The resulting German chart has 60 positive leaves and reconciles exactly to the Eurostat control total.
Main German sources: Eurostat National Tax Lists; Bundesministerium der Finanzen, 2024 cash tax receipts by tax type; and Destatis current-price GDP.
The code that generated the charts is available on our GitHub, together with the underlying data.
Many thanks to T and O; particular thanks to V for generously sharing some of her work on French taxes. Original idea of looking at the French taxes came from Patrick Fitzgerald.
Chart created using Apache ECharts, by the Apache Software Foundation and contributors (Apache-2.0).