
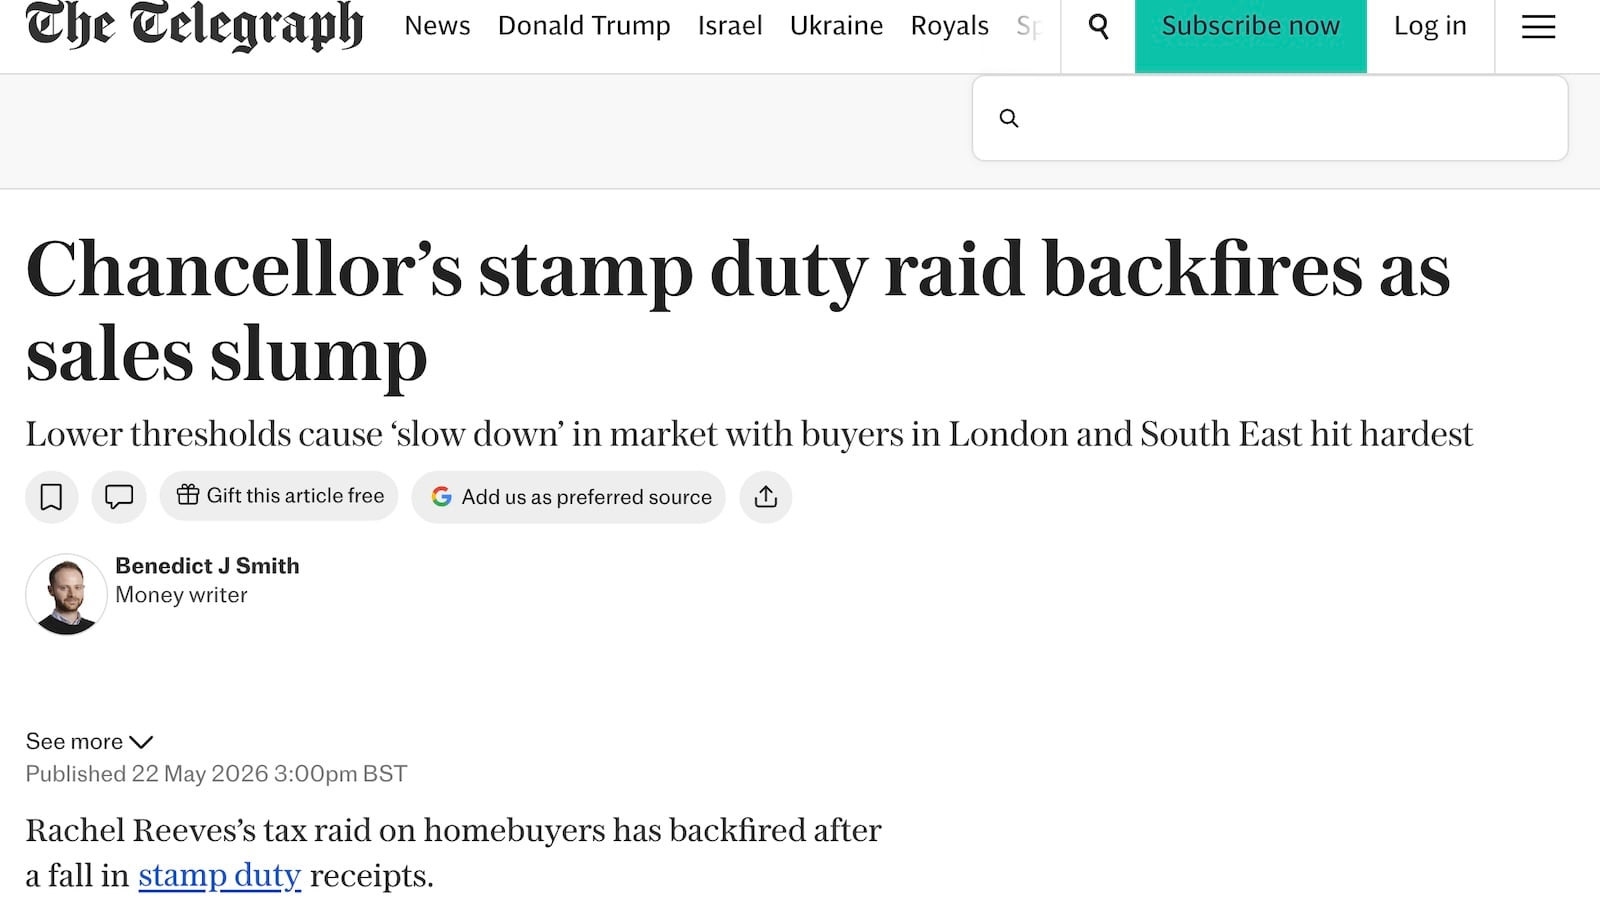
The Housing select committee has said stamp duty does economic damage and should be reformed. The Telegraph says the stamp duty increase last year “backfired”: transactions slumped, and receipts fell with them. I wish that was right, because there would then be an easy argument to reverse the increase, and even abolish the tax. But it isn’t. There was a short-term increase in transactions, and whilst there will be a long-term fall, the overall effect is a significant increase in revenue.
The depressing truth is that stamp duty isn’t even close to the top of the Laffer curve, so each increase damages growth, jobs and happiness, but still raises additional tax. And so successive Governments have become addicted to what is possibly the UK’s worst tax.
The Laffer curve
Here’s the usual representation of the Laffer curve:
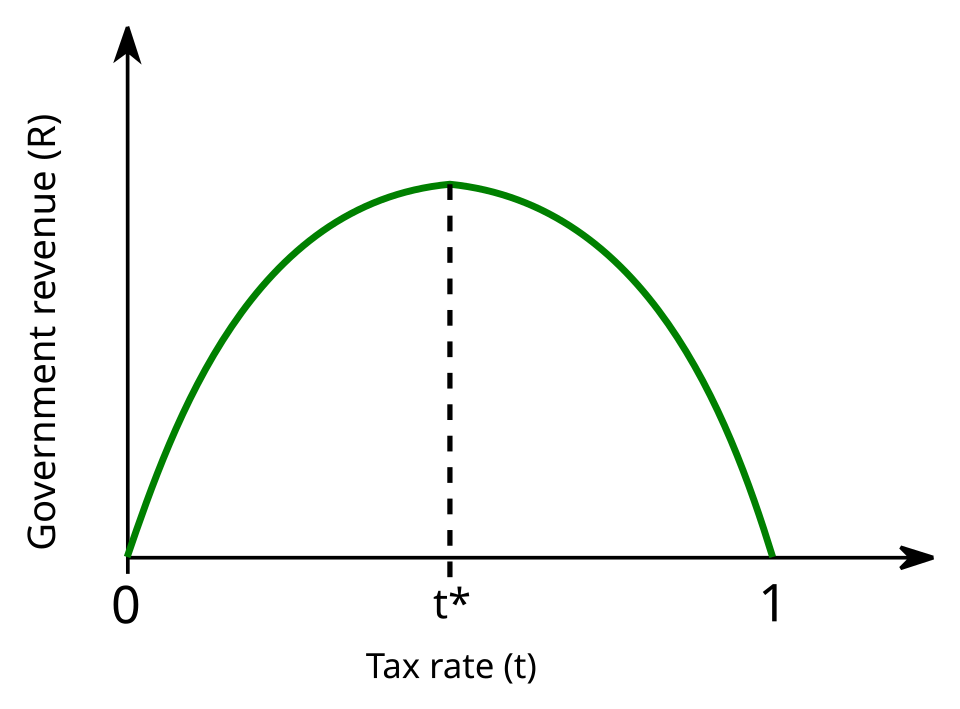
As the tax rate increases, people do less of the thing that’s taxed. As the tax rate approaches the dotted line, diminishing returns set in. At the point it hits the dotted line, tax revenue has been maximised – any further increase in rate reduces revenues.
It’s very plausible the UK tax rates in the 1970s hit the top of the Laffer curve (although less because they put people off working, and more because it was so easy to avoid the tax).
The Telegraph’s story suggested that stamp duty had sailed over the top of the Laffer curve, with a fall in transactions and tax receipts.
The stamp duty “raid”
In April 2025, the temporary stamp duty thresholds introduced by Liz Truss expired. This added £2,500 of tax for most standard buyers above £250,000 but a much bigger effect for first-time buyers:
The practical impact is clearer if we view the SDLT as a percentage of house price:
What should we expect to happen?
The principle is obvious: stamp duty is a tax on moving house. Raise it, and you see fewer house moves.
We can do better than intuition and put a number on the effect. Politicians have incessantly fiddled with stamp duty in a way that’s been bad policy in almost every sense, but has had the upside of letting us measure the real-world impact of stamp duty changes.
HMRC has calculated, and the Office for Budget Responsibility (OBR) uses, SDLT “semi-elasticities” – the percentage change in transactions from a 1 percentage point rise in the effective SDLT rate at a given price.
We can use this to “predict” the impact on house-moving transactions of the April 2025 stamp duty increase. (I say “predict” because this has already happened, but I’m going to try and be careful not to cheat, and just apply the theory rather than peeking at the actual outcomes.)
Applying the semi-elasticities to the April 2025 stamp duty increase suggests a simple standard-buyer transaction drag of about 3.2%, and a bigger effect for some first-time buyers.
Here’s what this theory predicts. The chart shows actual England and Northern Ireland residential transactions to February 2025, then uses the simple 3.2% standard-buyer price-mix estimate and historic “spike” effects to project forward:
Taking into account the “spike” and subsequent drop, the model predicts an overall decline (2.1%) in the number of transactions. What does that imply for receipts?
A significant overall increase in revenue.
In the twelve months before the forestalling period, February 2024 to January 2025, HMRC SDLT cash receipts were £13.1bn. Our projection for the twelve months from February 2025 to January 2026, including the pre-deadline spike, is £14.3bn – i.e. about £1.2bn of additional revenue.
That’s consistent with HMRC’s own ready reckoner, which shows that raising the lower SDLT bands still raises money after behavioural response – it is only the very high rates (the 12% top band, the additional-property surcharge and the non-resident surcharge) that appear close to or past the revenue-maximising point.
It’s also what the OBR expected. When the temporary higher SDLT thresholds were introduced in 2022, the OBR-certified costing assumed that ending them on 31 March 2025 would raise revenue: £850m in 2025-26, £1.44bn in 2026-27 and £1.635bn in 2027-28.
So our model and the OBR costing all point the same way: fewer transactions, but higher receipts. Theory suggests we were not past the top of the Laffer curve.
All the code for the modelling in this section (and generating the charts in this article) is available on our GitHub.
What actually happened
Now let’s open our eyes and look at the actual data for what happened (the red line):
Instead of our projected drop of 20,000 transactions, we see an overall increase of 85,000 compared to the previous year.
Why? There’s an absolutely huge “spike”. We assumed the transactions in the “spike” would be accelerated transactions from the next few months, and so expected an additional drop-off in transactions after the stamp duty increase kicks in (i.e. in addition to the expected effects of the increase itself). There is a drop-off, but it’s much less than expected.
Receipts are therefore considerably more than our model suggested: £2.4bn of additional revenue rather than £1.2bn. They were also above the OBR’s pre-year forecast. HMRC cash SDLT receipts for 2025-26 were £15.159bn, £507m above the OBR’s October 2024 forecast for total SDLT.
Why are there so many more transactions?
One possibility is that the negative effect of the stamp duty change was masked by positive macro factors – the fall in mortgage rates, increase in mortgage approvals or just a general market rebound. However if these effects were significant then we’d see an increase in prices for houses where the stamp duty change had little or no effect. We found no obvious sign of this in the least-exposed price bands.
That leaves two dull technical possibilities:
The theory and semi-elasticities don’t apply to this kind of stamp duty change. People are less responsive to stamp duty than expected.
There is an error in our modelling (certainly possible; although we tried two completely different methods and got the same answer).
And then one interesting real possibility:
The prospect of increased stamp duty didn’t just accelerate purchases by a few months (a well-understood and expected effect) but pulled forward purchases from further into the future, or enticed people into buying when otherwise the decision was marginal.
We don’t know. But this was a one-off effect. Once the spike and its immediate payback have washed through, the underlying behavioural drag is likely to be smaller than the first-year numbers suggest. Re-running the same simple standard-buyer model with OBR’s steady-state elasticities gives a long-run transaction drag of around 2.7%; the more detailed cohort model gives a similar 2.6%. On English transactions running at around a million a year, that is roughly 25,000 to 30,000 households who would otherwise have moved but will not.
In narrow tax terms, this looks like a success because stamp duty receipts are about 10% higher, even after the long term decline in transactions. Rachel Reeves did not hit the top of the Laffer curve, and the tax increase clearly raised more revenue.
Why did the Telegraph say transactions fell? Because they compared the first quarter of 2025 (with that huge spike) with the first quarter of 2026 (the “new normal”) and saw fewer transactions. You can’t ignore the spike – it’s part of the behavioural response to the tax increase. The correct approach is to compare the pre-announcement/pre-forestalling baseline with the full twelve-month period affected by the change, including the pre-deadline spike and the subsequent payback.
Transactions did not slump overall, and receipts did not fall. There will be a long-term fall in transactions, but the increased rate will more than compensate. In narrow fiscal terms the tax rise worked.
But there was, of course, a price.
The price of a stamp duty increase
The data suggests that, thanks to the increase, after that first year spike there will be about 30,000 fewer residential property transactions every year. The Budget made life appreciably worse for those 30,000 households. They wanted to move house, and would have moved house, but now won’t. Few tax increases are so modest in fiscal terms, while having so large an impact on people’s lives.
There will also be a knock-on effect on the housing market, the labour market, and the economy:
Stamp duty stops the housing market working efficiently: it discourages mutually beneficial moves and stops properties being held by the people who value them most. That means fewer downsizing chains; older households stuck in homes too big for them, and younger families squeezed into homes too small. Around 40% of English households are under-occupied while around 3% are overcrowded. Some of that mismatch persists because the tax cost of moving is too high.
Stamp duty and similar taxes reduce labour mobility; they deter long-distance, job-induced moves.
The economic effect is much more modest. A loss of 30,000 transactions implies somewhere around £300m of gross moving-related spending lost. The effect is real, but small in macro terms.
These are the reasons why we should be finding ways to abolish stamp duty, not increase it.
It would be nice if there was a free lunch here: that stamp duty is now so high that cutting it would raise revenue. But that is not what the evidence shows. The Telegraph’s comparison was misleading; the increase did raise revenue. That does not make it good policy. Stamp duty still stops people moving, worsens the allocation of housing, and damages the labour market.
The problem is not that stamp duty increases “backfire”. It is worse than that: they work fiscally, while doing real economic and human damage.
Many thanks to P and T for help with the modelling. All the calculations, code and source notes are on our GitHub.
The front page is © Telegraph Media Group, and is reproduced here for purposes of criticism and review.