
Herein, we utilize holmium (Ho) adatoms on MgO as single-atom magnet, a system that is regarded as a benchmark for single-atom memory5,6,7,8,9,10,11,12 (see also Figs. S1 and S2 in the supporting information). A Ho adatom adsorbed on the Oxygen top site (Hotop) has been experimentally characterized using X-ray absorption spectroscopy (XAS), X-ray magnetic circular dichroism (XMCD) and spin-polarized scanning tunneling microscopy (SP-STM)10,11,13. As shown in Fig. 1(a,b), Hotop has a ligand field with C4v symmetry, which effectively suppresses direct transitions between the ground state and the metastable state (Ho↑ and Ho↓) due to the strong uniaxial anisotropy, and thus gives rise to a long-lived magnetic quantum state with two configurations, Ho↑ and Ho↓ (see also Section 3 in the Supporting Information)4,6,10,12,14. In Fig. 1(b), under an external magnetic field of 3.0 T, the Ho state aligned with the magnetic field has an energy preference of approximately 3.5meV over the opposite state. Notably, spin switching at zero magnetic field is prevented by the hyperfine interaction4. These properties make Hotop adatoms promising candidates for the smallest stable magnetic bits. In previous SP-STM experiments, applying a bias voltage above ~ 100 mV allowed tunneling current to induce switching between Ho↑ and Ho↓ by overcoming the energy barrier 6,10. Compared to Hotop, Hobridge is located in a crystal field with C2v symmetry, which represents a lower-symmetry environment (see Fig. S3). As depicted in Fig. S3b, this reduced symmetry leads to strongly mixed quantum states even under an applied magnetic field of 3.0 T, thereby shortening the magnetic lifetime12.
Fig. 1: Energy diagram of holmium adatom on MgO and experimental set-up to read and write the magnetic states of Ho adatoms.
a Three-dimensional views of the adsorption configuration of a Ho adatom at the top site in the high-symmetry C4v position on MgO/Ag(100), together with top and side views of the same configuration on MgO. Green ball: Ho atom, orange ball: Mg atom, red ball: O atom, gray ball: Ag atom. b Calculated eigenvalues of top-site Ho in high-symmetry C4v on MgO/Ag(100) at B = 3.0T. The large uniaxial crystal field, with only minor transverse components, suppresses efficient direct transitions between the ground and metastable states (Ho↑ and Ho↓). The red and blue arrows in (b) indicate the Ho↑ and Ho↓. The inset shows a magnified view of the low-energy region. c Schematic of the force-based reading and writing of single atom magnets.
To read and write the spin orientation of a Ho adatom adsorbed on an MgO surface, we employed magnetic exchange force microscopy (MExFM)15,16,17,18,19,20 using a length extension resonator (LER) operated in the frequency modulation mode. In this mode, the frequency shift (Δf) allows the determination of the force between the tip and the sample from the attractive regime to the repulsive regime (see also the Supporting Information)21,22. Fig. 1c illustrates the experimental setup. A tungsten tip functionalized with cobalt (Co) atoms at its apex was mounted on a LER and oscillated at its resonance frequency f0 ~ 1 MHz with an amplitude of A = 65pm. It was then used to probe a Ho adatom under near-zero bias voltage at 4.5K under an external magnetic field of 3.0T (see Figs. S4 and S5 in the Supporting Information for the preparation of the Co tip). The magnetization of the Co tip aligns with an external magnetic field due to the superparamagnetic nature of the Co cluster10,23,24.
Here, we present the experimental results of force-based reading and writing Ho↓ and Ho↑. Figure 2a shows a typical Δf as a function of time, measured on top of Hotop while varying the bias voltage (Fig. 2b) and the tip–sample distances (Fig. 2c). First, the lateral position of the tip was fixed above the center of Hotop. At V = 120 mV, the Ho spin undergoes current-induced switching. The spin state was then stabilized in the desired configuration (in this case, Ho↓) by lowering the bias voltage from V = 120 mV to V = 200 μV, well below the threshold for current-induced spin switching (0s ≤t≤ 4s). Once set, the Ho↓ state was measured via Δf during the tip approach (6s ≤t≤ 33s). To switch the spin state from Ho↓ to Ho↑, the tip was brought to a specific distance (z = − 0.13 nm), exceeding the threshold distance required to induce spin switching (z = 0.00 nm is the point-contact distance, see also Methods). The spin state of the Hotop was then probed at this distance with a fixed probe time of 10 s (33s ≤t≤ 43s), and the transition from Ho↓ to Ho↑ was detected as a sudden jump in Δf, indicated by the black arrow in Fig. 2a. Afterward, the Ho↑ was measured from Δf by retracting the tip to its original tip–sample distances (43s ≤t≤ 70s). Finally, the bias voltage was restored from V = 200μV to its original value of V = 120 mV (72s ≤t≤ 76s; see also Fig. S6 for the tunneling current simultaneously recorded with Δf in Fig. 2a). In Fig. 2a, the minimum of Δf obtained on top of Ho↑ is smaller than that for Ho↓, demonstrating that the two spin states can be successfully read out by MExFM, and that the Ho spin can be written from Ho↓ to Ho↑ by approaching the tip.
Fig. 2: Reading and writing of Ho spin on MgO using MExFM.
a–c Δf(t) spectra measured on top of Hotop while varying the bias voltage and the tip height. a Time evolution of Δf, b applied bias voltage, and c tip-sample distance. The blue and red in (a) indicate the Ho↓ and Ho↑. At 33s ≤t≤ 43s, the transition from the Ho↓ to Ho↑ state can be detected by a sudden jump in Δf(t), marked by the black arrow in (a).
To discuss the reading mechanism of Ho↑ and Ho↓, here we show the short-range force and magnetic exchange force recorded on top of Hotop (see Figs. S7 and S8 for full data sets and dissipation). Figure 3a shows the Δf as a function of tip–sample distance (Δf(z)), recorded on top of Ho↑, Ho↓ and MgO (ΔfHo↑(z), ΔfHo↓(z) and ΔfMgO(z)). Both ΔfHo↑(z) and ΔfHo↓(z) include a long-range component from the MgO substrate. Therefore, ΔfMgO(z) was subtracted from ΔfHo↑(z) and ΔfHo↓(z) to eliminate the background component. As shown in Fig. 3b, the short-range force on Ho↑ and Ho↓ (FHo↑(z) and FHo↓(z)) were calculated from the background subtracted Δf(z) 22. In Fig. 3b, as the tip approaches the Ho↑ (Ho↓) adatom, FHo↑(z) (FHo↓(z)) exhibits FHo↑ (z = 0.00 nm) = − 1.60 nN (FHo↓ (z = 0.00 nm) = − 1.55 nN), indicating ferromagnetic coupling between the Co tip and the Ho adatom at this distance. Reducing z further decreases the attractive force to FHo↑ (z = − 0.08 nm) = − 1.25 nN (FHo↓ (z = − 0.08 nm) = − 1.25 nN). As z is reduced even more, the attraction increases, reaching FHo↑ (z = − 0.10 nm) = − 1.40 nN (FHo↓ (z = − 0.10 nm) = − 1.50 nN), indicating antiferromagnetic coupling at this distance. The inset in Fig. 3b shows the magnetic exchange force, FMExFM(z), derived by subtracting FHo↓(z) from FHo↑(z). As the tip approaches, a transition from ferromagnetic to antiferromagnetic coupling can be observed (ferromagnetic: FMExFM(z) < 0 and antiferromagnetic: FMExFM(z) > 0).
Fig. 3: Probing Ho↑ and Ho↓ using MExFM.
a Frequency shift obtained on top of the Ho↑ (ΔfHo↑(z), red solid curve), Ho↓ (ΔfHo↓(z), blue solid curve) and MgO (ΔfMgO(z), orange solid curve). Measurement conditions: V = 200μV. b Short-range forces obtained on top of Ho↑ (FHo↑(z), red solid curve) and Ho↓ (FHo↓(z), blue solid curve). Inset in (b) shows magnetic exchange force FMExFM(z) obtained on top of the Ho adatom. The gray dotted line is a guide for the eye, indicating FMExFM(z) = 0.
The ferromagnetic coupling between the highly localized 4f electrons in the Ho adatom and the 3d electrons in the Co tip can be explained by two contributions: first, an intra-atomic ferromagnetic coupling between the 4f and 5d (or 6s) spins within the Ho adatom, and second, an inter-atomic ferromagnetic coupling between the 5d (or 6s) electrons of Ho and the 3d electrons of the Co atom10,25,26. The transition from ferromagnetic to antiferromagnetic coupling is reported for the interaction between the 5d electrons of Ta and the 3d electrons of Fe27. The transition from ferromagnetic to antiferromagnetic coupling is reminiscent of the Bethe-Slater curve. The antiferromagnetic coupling between the highly localized 4f electrons in the Ho adatom and the 3d electrons in the Co tip can be explained by an intra-atomic ferromagnetic coupling between the 4f and 5d (or 6s) electrons within the Ho adatom, and an inter-atomic antiferromagnetic coupling between the 5d (or 6s) electrons of Ho and the 3d electrons of the Co atom.
As we discussed in Figs. 2(a–c), the Ho spin can be switched from Ho↓ to Ho↑ by approaching the tip. In Fig. 4(a), we further demonstrate bidirectional switching between Ho↓ and Ho↑ induced by the tip approach. Firstly, the tip was brought above the center of Hotop, and the bias voltage was set to V = 200μV to avoid spin switching induced by the tunneling current. Then, the tip-sample distance was adjusted to values exceeding the threshold distance required to induce spin switching via tip approach. As shown in Fig. 4(a), the spin switching was monitored in real time by recording the Δf while keeping the tip height constant. Telegraph noise between the two states was observed, indicating bidirectional spin switching between Ho↑ and Ho↓. Therefore, due to the bidirectional spin switching, we can control the spin not only from Ho↓ to Ho↑ (as demonstrated in Figs. 2(a–c)) but also from Ho↑ to Ho↓, as shown in Fig. S9. Moreover, the observation of the bidirectional spin switching rules out exchange forces as the driving mechanism for spin switching28. Fig. 4b summarizes the switching rates between Ho↑ and Ho↓ with the results of spin switching induced by the tunneling current (see also Fig. S10). In Fig. 4b, the spin switching induced by tip approach decays more rapidly along with distance than that induced by the tunneling current.
Fig. 4: Switching between Ho↑ and Ho↓.
a Telegraph signal due to the force-induced magnetic switching between Ho↑ and Ho↓. The blue and red indicate the Ho↓ and Ho↑. Measurement conditions: constant-height mode, V = 1.0 mV, z = −16.0 pm. b Spin switching rate as a function of tip-sample distances. The exponential fits are represented by the solid, dashed and dotted lines. Measurement conditions: constant height mode, V = 1.0 mV for force induced spin switching and V = 150 mV for current induced spin switching.
To discuss the writing mechanism of Ho↑ and Ho↓, the tip was positioned at the center of Hotop and approached closer than the spin-switching distance. As shown in Fig. S11, this approach induced a lateral displacement of Hotop to the bridge site, resulting in the formation of Hobridge. These results demonstrate that lateral displacement from Hotop to Hobridge can be induced even when the tip approaches the center of Hotop at a specific tip-sample distance. Because the Co tip has an asymmetric shape (see Fig. S12(a–d)), multiple Co atoms are expected to come into contact with the Ho adatom during relaxation, thereby inducing lateral displacement. Notably, once the Ho adatom relocates to the Hobridge, it rarely returns to Hotop.
The lateral displacement from Hotop to Hobridge, in turn, strongly influences the spin state of the Ho adatom. Specifically, as shown in Figs. 1b and S3b, transitions between Ho↑ and Ho↓ are suppressed for Hotop, whereas the reduced-symmetry Hobridge exhibits strongly mixed quantum states, enabling direct transitions between Ho↑ and Ho↓ even under an applied magnetic field of 3.0 T (see also Section 3 in the Supporting Information)12. The importance of crystal-field symmetry for magnetic stability has been widely reported in other systems8,29,30,31. We therefore propose that spin-switching of a single atom is driven by strain-induced state mixing using an atomic probe. The spin switching between Ho↑ and Ho↓ occurs when Hotop moves toward Hobridge but does not fully reach it, due to the force exerted by the Co tip. This is further confirmed as in Fig. S13, which shows that the spin switching distance varies depending on the tip shape, but spin switching always occurs at distances shorter than the point-contact distance. Although the spin switching distance depends on the tip shape, once an appropriate tip is prepared, the spin orientation and switching rate can be controlled by adjusting the tip-sample distance, as demonstrated in Figs. 2, S9, and 4(a,b), thereby enabling controlled writing of a single-atom magnet using force.
Beyond merely reading Ho↓ and Ho↑ through its spectroscopy capabilities, MExFM enables imaging of Ho↓ and Ho↑. As shown in Figs. 5(a,b), this is achieved by scanning the tip horizontally at a constant height while recording Δf. The tip-sample distance is set to be approximately 20 pm larger than the point-contact distance to avoid spin switching. In Fig. 5a, both Ho adatoms appear in the Ho↑ state. To demonstrate the spin-readout capability, we switched the spin state of the left Ho adatom from Ho↑ to Ho↓ and imaged the same area again using the same tip in Fig. 5a. In Fig. 5b, the left Ho adatom appears in the Ho↓ state, whereas the right one remains in the Ho↑ state. In Fig. 5c, the contrast changed only for the spin switched Ho atom, while the unswitched reference Ho atom remained identical. This observation allows us to rule out the possibility of a tip change during the Ho spin manipulation. In Figs. 5a and 5b, based on the time required to image a single Ho, the Ho spin can be stably read out for at least 218s. Consequently, our force-based approach remains intrinsically non-invasive during readout. Therefore, we successfully demonstrated the readout of Ho adatom spin orientations in both configurations using MExFM.
Fig. 5: Imaging Ho↑ and Ho↓ using MExFM.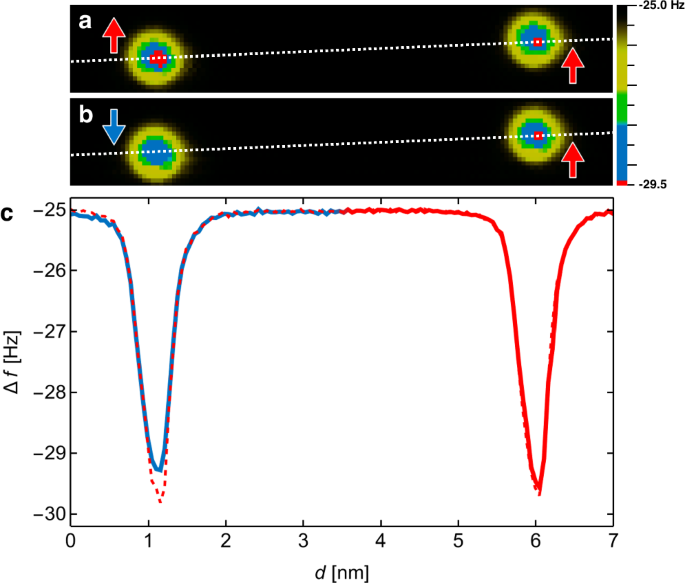
a Δf image of two Ho adatoms, both Ho adatom in the Ho↑. Imaging parameters: constant height mode, V = 200μV, scan size 1.2 nm × 7.0 nm. b Δf image of the same area in (a), after the left Ho adatom was manipulated from Ho↑ to Ho↓. Imaging parameters: constant height mode, V = 200μV, scan size 1.2 nm × 7.0 nm. a and b were obtained at the same tip height. c Line profiles obtained above the Ho adatoms by the dotted curve for (a) and the solid curve for (b). The blue and red indicate the Ho↓ and Ho↑. The positions of the line profiles are indicated by the dotted lines in (a) and (b).
In this work, we show that the spin orientation of a single-atom magnet can be read and written using force, specifically by means of MExFM. We demonstrate this by probing individual Ho adatoms on MgO thin films, distinguishing between the Ho↑ and Ho↓ states through exchange forces, and controlling these states by adjusting the tip-sample distance to induce lateral displacement and manipulate the adsorption-site symmetry. The method of controlling the spin by manipulating the adsorption-site symmetry, as proposed in this study, is not specific to our system31. This opens new possibilities for manipulating spin states via the surrounding atomic environment. Spin detection and manipulation of 4f-electron systems by a nondissipative force, unlike electric currents, is expected to lead to the realization of long spin coherence times, which are critical for quantum information processing32,33,34.