
Experimental set-up
This experimental platform (Extended Data Fig. 1) was specifically designed to propagate an intense, ultrabroadband (>60 nm) seed pulse to a preheated plasma. It required three separate single-shot laser systems. A heater beam (532 nm, 1.3 ns FWHM, 3.5 J) was focused at f/5 with a 500-mm-focal-length lens to 3 mm past TCC to ionize the gas and heat the resulting plasma. The gas jet used a Mach-5, 2-mm-exit-diameter nozzle. The nozzle offset from the beam axis was 1.8 mm for the N2/CH4 mix and 1.4 mm for the H2. The plasma produced by the heater beam was allowed to expand for 9 ns when using N2/CH4 or 4 ns when using H2 before the arrival of the pump and the seed. The peak plasma temperature at the centre of the gas jet when the pump and seed arrived was 45 eV and 20 eV for N2/CH4 and H2, respectively, based on modelling with the radiation hydrodynamics code hydra28 using the gas density profile produced by the gas-jet nozzle29. The variation in plasma density with radius at TCC is predicted to be ~10% or less, with less variation for the smaller seed spots.
The pump was provided by the Multi-Terawatt (MTW) Laser System30. The range of pulse durations used in the experiment (19.6 ± 2.8 ps to 32.5 ± 3.2 ps FWHM) was obtained by detuning the stretcher from optimal pulse compression, resulting in residual positive second-order dispersion (chirp). The pump was focused using a 1,200-mm-focal-length lens to an ~30 μm × 90 μm FWHM spot at 180° relative to the seed. For all shots shown except shots A and B in Table 1, the pump was either focused at TCC or 5 mm before TCC as indicated. For shots A and B, the pump was focused 2 and 5 mm downstream of TCC, respectively.
The seed was the idler15 of one of the preamplifier stages of the MTW-OPAL laser31. The seed wavelength was significantly separated from the central wavelength of the pump as a requirement for Raman amplification and facilitated removal of the backscattered pump from the signal. The bandwidth was limited by the seed’s grism stretcher32. The fourth-order dispersion inherent in the seed limited its pulse duration to well above the transform limit15,32. The energy jitter in the seed laser caused the on-target energy to vary from shot to shot. The seed was focused using an 800-mm-focal-length lens.
A single-shot cross-correlation method33 was developed to co-time and spatially overlap the pump and seed at TCC in a preshot mode. Samples of the pump and seed were then launched into optical fibres and sent to a high-bandwidth photodiode and oscilloscope, and the relative arrival time was calibrated to diagnose timing jitter on each shot. The heater and pump operated in single-shot mode, with shots occurring every 3–20 min, depending on whether the final amplifier of the pump was fired. The seed could be operated at 5 Hz for characterization of its input parameters. A single seed pulse was selected during single-shot operation. Because of shot-to-shot variations, all diagnostics were operated in single-shot mode.
As discussed above, the signal was transmitted to its diagnostic suite. Similarly, the pump was recollimated by the seed’s focusing lens, and a portion was picked off and directed to the transmitted pump diagnostic suite, which included a pyrometer to measure the energy, a nearfield spatial profile measurement, a spectrometer and a focal-spot diagnostic. The transmitted pump energy varied between 40% and 95%, depending on the pump and plasma parameters. Generally, for shots with low transmission, the beamspray of the transmitted pump overfilled the collection optics for the diagnostic, which limited the total amount of transmitted pump energy that was recorded.
Backscatter of the pump
To determine the contribution of the backscattered pump in the signal diagnostic suite, “backscatter-only’ shots were taken, where all parameters were held constant except for blocking the seed. We typically measured Raman backscatter <3%. This contribution is a slight overestimation of the backscattered pump because there is no pump energy transferred into the seed when the seed is blocked. The backscatter contribution is removed from all data reported in this Article.
Efficiency calculations
The efficiency η is calculated using
$${\eta }=\frac{E_{\rm{signal}}-E_{\rm{backscatter}}-\,E_{\rm{seed}}}{E_{\rm{pump}}^{*}}$$
(1)
where Esignal is the total signal energy measured by the signal pyrometer, which includes the seed energy Eseed, the energy gained by the seed from the pump, and the backscattered pump energy. To determine the energy actually gained by the seed, the seed energy and the average backscattered energy Ebackscatter for those pump and plasma conditions are subtracted from Esignal. \({{{E}}}_{{\rm{pump}}}^{* }\), the total pump energy that temporally overlaps with the seed in the plasma, is used in the calculation. This accounts for the portion of the pump missed by the seed due to the temporal jitter between the pump and the seed measured for that shot and for the fact that the leading and trailing temporal features of the pump exceeded the pump duration required for the plasma length.
It is complicated to compare efficiencies between laser–plasma amplifier experiments owing to differing geometries and differing methods to calculate efficiency. For example, Ren et al.16,17, who reported a 6.4% efficiency, had a double-pass geometry, did not account for the backscatter of the pump and did not include the pump energy from the second pass in their efficiency calculation. We report our efficiency as described by equation (1) because it is the best representation of the physics governing the system rather than a reflection of engineering details. If not correcting for the temporal overlap, the highest raw efficiency is 5.3% ± 0.9%random ± 0.7%systematic.
Amplification factor calculation
The amplification factor is calculated as
$${\mathrm{Amplification}}\,{\mathrm{factor}}=\frac{{E}_{\mathrm{signal}}-\,{E}_{\mathrm{backscatter}}}{{E}_{{\mathrm{seed}}}}.$$
(2)
Pulse-length measurements with SPIDER diagnostics
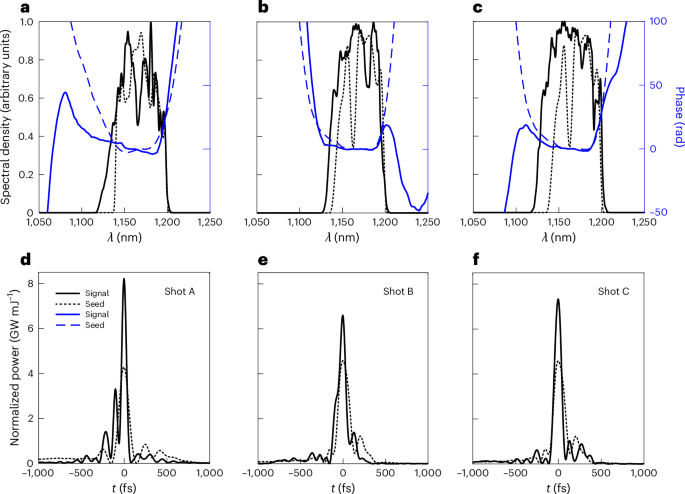
SPIDER diagnostics are used to temporally characterize the seed before and the signal after amplification. In SPIDER, the temporal pulse shape is calculated from the measured spectral density and spectral phase. The spectral phase is obtained by Fourier processing an interferogram resulting from the nonlinear frequency mixing of two replicas of the pulse under test with a chirped pulse. A spectral shear results from the upconversion of the two temporally delayed replicas with two slightly different optical frequencies in the chirped pulse. The spectral phase of the input pulse is then reconstructed by integration of its relative phase difference. SPIDER operates in a single shot without time-to-space encoding, which would be challenging in the presence of substantial beam distortions, and without requiring a cotimed reference pulse, which would be difficult to provide. Note that SPIDER does not provide a full spatiotemporal characterization of the signal.
This experiment used two identical custom infrared SPIDER diagnostics34—one on the input side to characterize the seed, and one ‘on-shot’ SPIDER after the plasma interaction to characterize the signal. The SPIDER measurements were performed using an ~1–3-mm-diameter portion of the nearfield. Each device used two spectrometers—one for measuring the spectrum (1ω) and one for acquiring the interferogram (2ω) from which the spectral phase is reconstructed. Input data were taken at 5 Hz, and the mean of >100 shots is reported. Input data were taken before the pulse entered the vacuum chamber but with a spare window in the measurement path to ensure equivalence to the pulse duration inside the vacuum chamber. The additional phase acquired as the pulse travels to the on-shot SPIDER (focusing and collimating lenses as well as signal output window) was calculated, added to the input SPIDER plots and found to have a negligible impact on pulse duration and peak power.
To remove the background, the spectrum was windowed for the on-shot measurements using a super-Gaussian window of the order of 16 with the FWHM set by the full-width at 10% of the raw spectral data. No window was applied to input data because the background was subtracted before taking the measurement. To ensure the integrity of the reported data, no shots were reported that had a signal-to-noise ratio less than 10 of the peak from the Fourier transform of the raw phase spectrometer data. Using SPIDER on-shot removes the ability to obtain RMS error bars, so error bars were determined from a series of ten no-gas measurements of the on-shot SPIDER. The on-shot SPIDER had a longpass filter on the 1ω spectrometer that cut wavelengths below 1,100 nm.
The pulse shapes in the bottom row of Fig. 1 are normalized such that the area under the curves integrates to 1. To obtain the power in GW, the normalized pulse shapes can be multiplied by the pulse energy in millijoules, which is found in Table 1:
$${\rm{Power}}\,[{\rm{GW}}]={\rm{normalized}\; \rm{power}}\,[{\rm{GW}}\,{\rm{mJ}}^{-1}]\times {\rm{pulse}\; \rm{energy}}\,[{\rm{mJ}}].$$
(3)
Simulations
To interpret the experiment, we performed two-dimensional osiris particle-in-cell simulations that modelled typical experimental parameters. Our simulations were performed in a fixed window configuration, capturing the full propagation of the pump across the plasma and its interaction with the counter-propagating seed pulse. The simulation grid was 251,565 × 1,336 with longitudinal and transverse resolutions of ω0Δz/c = 0.103 and ω0Δx/c = 0.826, respectively; the timestep was ω0Δt = 0.0716. We used 36 particles per cell per species and quadratic particle shapes. In addition, we performed one-dimensional scans over seed and pump intensity using the same longitudinal resolution with 4,096 particles per cell per species.
We modelled the plasma profile shown by the solid line in the inset in Extended Data Fig. 1. The plasma was composed of nitrogen with an ionization state of N4+. The peak plasma temperature was initialized at 45 eV in accordance with hydra simulations of the plasma formation. Electron–ion collisions were included using a Monte Carlo approach35, allowing the simulations to capture further heating by inverse Bremsstrahlung absorption and collisional damping of electron plasma waves.
The pump laser was linearly polarized with a central wavelength of 1,053 nm, a pulse length of 25 ps FWHM, a focused spot size of 35 μm (1/e2 radius), and an intensity of 3.8 × 10¹⁴ W cm−2 at the centre of the plasma profile. The seed laser was linearly polarized with a central wavelength of 1,170 nm, a pulse length of 118 fs FWHM, a focused spot size of 35 μm (1/e2 radius) and an intensity of 3.65 × 10¹⁵ W cm−2, also at the centre of the plasma profile. Both the pump and seed lasers were injected from the boundaries of the simulation domain.
These simulations elucidate some of the dominant mechanisms that govern amplification under our experimental conditions. For seed intensities above 4.9 × 10¹⁴ W cm−2, our Raman amplifier promptly enters the nonlinear, pump depletion regime1,4,7,10 without first evolving through the low-efficiency linear regime. Importantly, simulations show that for pump intensities above 1 × 10¹³ W cm−2, the degree of pump depletion is limited by wavebreaking8,9,21,36. The pump depletion saturates with the saturation of wavebreaking, as illustrated in Extended Data Fig. 2 for the simulation of our highest-efficiency shot. The length scale over which energy can transfer from the pump to the seed is limited to an ~20-μm region of the plasma wave before the wavebreaking saturates. At the location of Extended Data Fig. 2, this effect limits the pump depletion to 35%. This saturation of pump depletion ultimately limits the achievable efficiency, and the limited length scale suggests that future experiments would benefit from shorter and more intense seeds.
The simulations also indicate that pump energy losses before encountering the seed (via backscatter and sidescatter) are not the primary limitation in these experiments. For the parameters studied, \(\lesssim\) 10% of the pump energy is deposited into plasma heating by thermal Raman backscatter and inverse bremsstrahlung. We also do not observe the formation of plasma gratings as discussed by Vieux et al.11, which is consistent with such a structure not being supported in warm plasmas (temperatures approximately tens of electronvolts or higher) or in plasmas where wavebreaking is occurring11.
We note that these simulations employed idealized laser pulses and therefore do not capture shot-to-shot spatial or temporal jitter between the pump and seed, nor nonideal transverse intensity profiles. Such effects may further limit the achievable efficiency and contribute to the variability observed experimentally. A detailed simulation study of the impact of these non-ideal effects will be the subject of a forthcoming publication.