
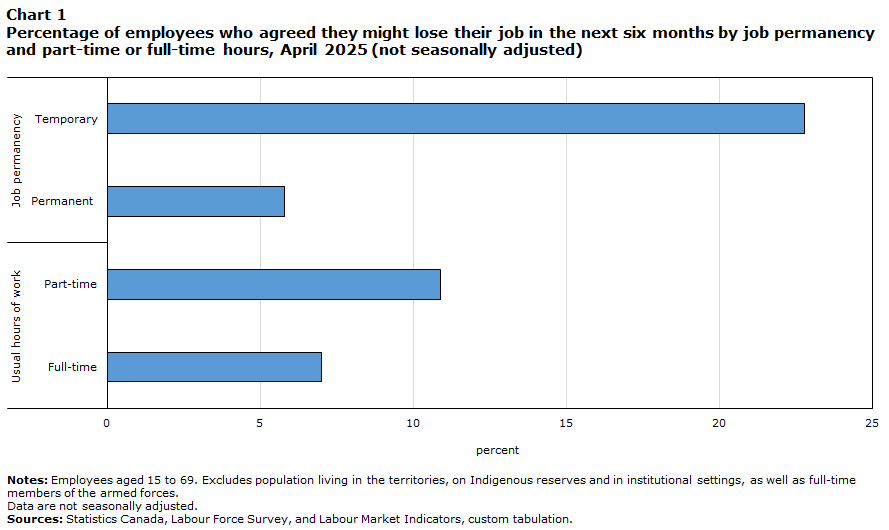
In April 2025, 7.7% of employees in Canada agreed or strongly agreed they might lose their job in the next six months. Employees holding temporary jobs (22.8%) and part-time employees (10.9%) were more likely to agree they might lose their job.
Losing a job or becoming unemployed can often lead to a drop in income and lower psychological well-being.Note For workers who still have a job, the perception that job loss is likely to occur in the near future has also been found to negatively impact well-being.Note
In the United Nations Economic Commission for Europe’s (UNECE) quality of employment framework, the perceived job security indicator refers to the proportion of employees who believe they might lose their job in the next six months. The degree to which employees are protected from dismissal, as well as broader business and macroeconomic conditions, can influence perceptions of job security. The indicator should be used alongside other information on job security—such as the proportion of employees with temporary jobs—to fully understand patterns in the security of employment within the labour market.
Unless noted otherwise, the following analysis focuses on results from the Labour Force Survey (LFS) supplements for employees aged 15 to 69. Since data on perceived job security can be affected by seasonal variations in the composition of employment, the article focuses on characteristics associated with higher perceived insecurity in both November 2023 and April 2025—the two most recent reference periods.
Recent trends
According to the General Social Survey (GSS): Canadians at work and home, in the fall of 2016,Note slightly over 1 in 10 employees (10.8%) agreed or strongly agreed they might lose their job in the next six months (not adjusted for seasonality). This proportion was slightly lower in the November 2023 LFS supplement, when 8.1% of employees agreed they might lose their job. In April 2025, 7.7% of employees agreed they could lose their job within the next six months.
Changes in perceived job insecurity may be partly shaped by overall labour market conditions. For instance, the unemployment rate was 5.7% in November 2023, lower than in the fall of 2016 (6.9%).
In April 2025, the Canadian economy had entered a period of uncertainty due to disruptions in the Canada-U.S. trade relationship. In this context, a higher proportion of employees neither agreed nor disagreed they might lose their job in the next six months (18.4%) compared with November 2023 (14.2%) and the fall of 2016 (13.5%). This suggests that at certain times, more employees may be uncertain about the direction of the labour market and the economy and its impact on their job security, without necessarily believing they are immediately at risk of losing their job.
A recent snapshot
Working full-time and being a permanent employee are factors associated with better perceived job security
Some groups of employees are generally expected to feel more insecure in their job. One such group are employees with a temporary job, a category which includes employees with casual, seasonal as well as term or contract jobs. Temporary employees often have fewer protections from dismissal, and many have contracts with durations that are shorter than six months.
In April 2025, 22.8% of temporary employees agreed they might lose their job in the next six months, compared with 5.8% of permanent employees. Among the different types of temporary employment, casual workers (14.3%) had lower rates of perceived job insecurity than those with term, temporary or contract jobs (26.0%) and those with seasonal jobs (24.8%).
Employees working part-time are also more likely to feel insecure in their job. In April 2025, 10.9% of part-time employees agreed or strongly agreed they might lose their job in the next six months compared with 7.0% of full-time employees.
Data table for Chart 1
Data table for chart 1
Table summary
This table displays the results of Data table for chart 1 , calculated using (appearing as column headers).
Percent
Notes: Employees aged 15 to 69. Excludes population living in the territories, on Indigenous reserves and in institutional settings, as well as full-time members of the armed forces.
Data are not seasonally adjusted.
Sources: Statistics Canada, Labour Force Survey, and Labour Market Indicators, custom tabulation.
Job permanency
Temporary
22.8
Permanent
5.8
Usual hours of work
Part-time
10.9
Full-time
7.0
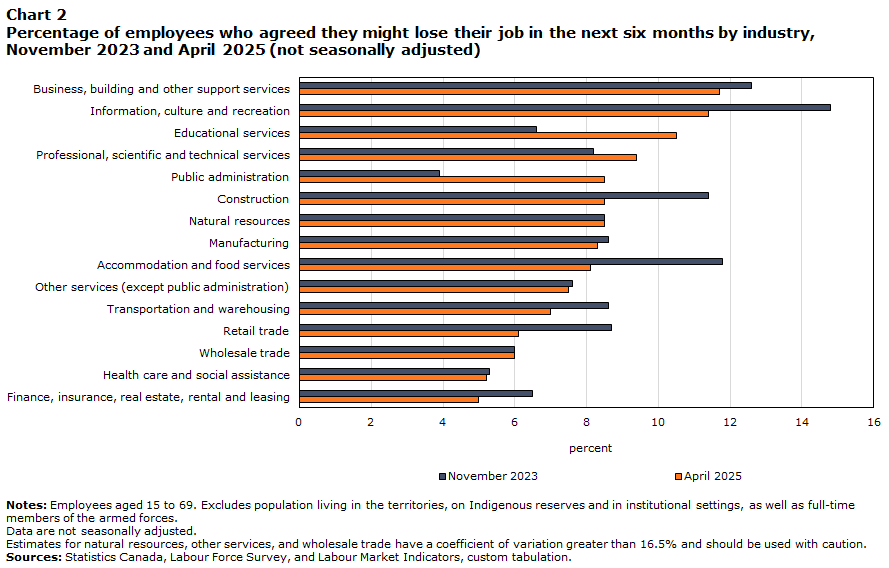
Employees in business, building and other support services, and in information, culture and recreation have the highest rates of perceived job insecurity
At the industry level, the proportion of employees who agreed or strongly agreed they might lose their job in the next six months was highest in information, culture and recreation and in business, building and other support services. This was true in both November 2023 (14.8% for information culture and recreation and 12.6% for business, building and other support services) and April 2025 (11.4% and 11.7% respectively). Higher perceived insecurity in the two industries may be partly related to the notable share of employees who have temporary jobs.
Data table for Chart 2
Data table for chart 2
Table summary
This table displays the results of Data table for chart 2 November 2023 and April 2025, calculated using percent units of measure (appearing as column headers).
November 2023
April 2025
percent
Notes: Employees aged 15 to 69. Excludes population living in the territories, on Indigenous reserves and in institutional settings, as well as full-time members of the armed forces.
Data are not seasonally adjusted.
Estimates for natural resources, other services, and wholesale trade have a coefficient of variation greater than 16.5% and should be used with caution.
Sources: Statistics Canada, Labour Force Survey, and Labour Market Indicators, custom tabulation.
Business, building and other support services
12.6
11.7
Information, culture and recreation
14.8
11.4
Educational services
6.6
10.5
Professional, scientific and technical services
8.2
9.4
Public administration
3.9
8.5
Construction
11.4
8.5
Natural resources
8.5
8.5
Manufacturing
8.6
8.3
Accommodation and food services
11.8
8.1
Other services (except public administration)
7.6
7.5
Transportation and warehousing
8.6
7.0
Retail trade
8.7
6.1
Wholesale trade
6.0
6.0
Health care and social assistance
5.3
5.2
Finance, insurance, real estate, rental and leasing
6.5
5.0
In both periods, the proportion of employees who agreed or strongly agreed they might lose their job in the next six months was among the lowest in finance, insurance, real estate, rental and leasing (5.0% in April 2025) and in health care and social assistance (5.2% in April 2025).
In April 2025, employees in industries dependent on U.S. demand for Canadian exportsNote (8.9%) were more likely than employees in other industries (7.5%) to agree that they might lose their job in the next six months.Note
In both public administration and educational services, the proportion of employees with perceived insecurity was higher in April 2025 compared with November 2023. This may partly reflect seasonal patterns. In educational services, for example, temporary contracts tend to align with the end of the school year in June. In public administration, the perceptions of employees may also be shaped by changes in the budgetary situation of governments.
West Asian and Arab employees more likely to experience perceived job insecurity than non-racialized, non-Indigenous employees
Variations in perceived job security also exist between population groups. Differences may be due to the greater concentration of some groups in industries where there are more insecure jobs, as well as inequities in the ability to access more secure employment.
Consistent with results observed in November 2023, higher proportions of West Asian (13.8%) and Arab (12.8%) employees in April 2025 agreed or strongly agreed they might lose their job in the next six months compared with their non-racialized and non-Indigenous counterparts (6.9%). Both West Asian and Arab employees were more likely to have a temporary job compared with non-racialized and non-Indigenous employees.
In April 2025, a higher proportion of employees who were recent immigrants—that is, who were admitted to Canada less than 5 years earlier—had a perception of not being secure in their job than employees born in Canada (11.2% compared with 6.7%).
Higher rates of perceived job insecurity among youth
In November 2023, employees aged 15 to 24 (13.5%) were nearly twice as likely as employees aged 25 to 54 (6.8%) to believe they might lose their job in the six months. Youth continued to have a higher rate of perceived job insecurity in April 2025, but the gap with core-aged employees was smaller, at 2.3 percentage points (9.6% compared with 7.3%).
In April 2025, 7.7% of employees aged 55 to 69 agreed they might lose their job in the next six months.
Start of text box
Information on the indicator
Description or definition
The perceived job security indicator is the number of employees aged 15 to 69 who agree or strongly agree with the statement “I might lose my job in the next six months”, expressed as a percentage of all employees in that age group.
Source
Statistics Canada, Labour Force Survey, November 2023 and April 2025.
Statistics Canada, Labour Market Indicators, November 2023 and April 2025.
General Social Survey: Canadians at Work and Home, 2016 (Cycle 30).
Information for interpretation
For more information on the Labour Force Survey (LFS) methodology and population coverage, please consult the Guide to the Labour Force Survey, 2025.
Detailed information on concepts and methodology are also available for the General Social Survey: Canadians at Work and Home.
The November 2023 and April 2025 LFS supplements were collected as part of the Labour Market Indicators program. The sample consists of households in their 2nd, 3rd, 4th, or 5th month of participation in the LFS and the survey population is limited to those aged 15 to 69 living in the provinces. For more information see Labour Market Indicators.
The LFS estimates are based on a sample and are therefore subject to sampling variability. The analysis focuses on differences between estimates that are statistically significant at the 95% confidence level. Due to rounding, estimates and percentages may differ slightly between different Statistics Canada products, such as analytical documents and data tables.
The industry coding is based on the North American Industry Classification System (NAICS) 2022.
Other related information
Additional Statistics Canada data are available on the following subjects:
Quality of life indicator: Job security and gig work
End of text box