

Overview
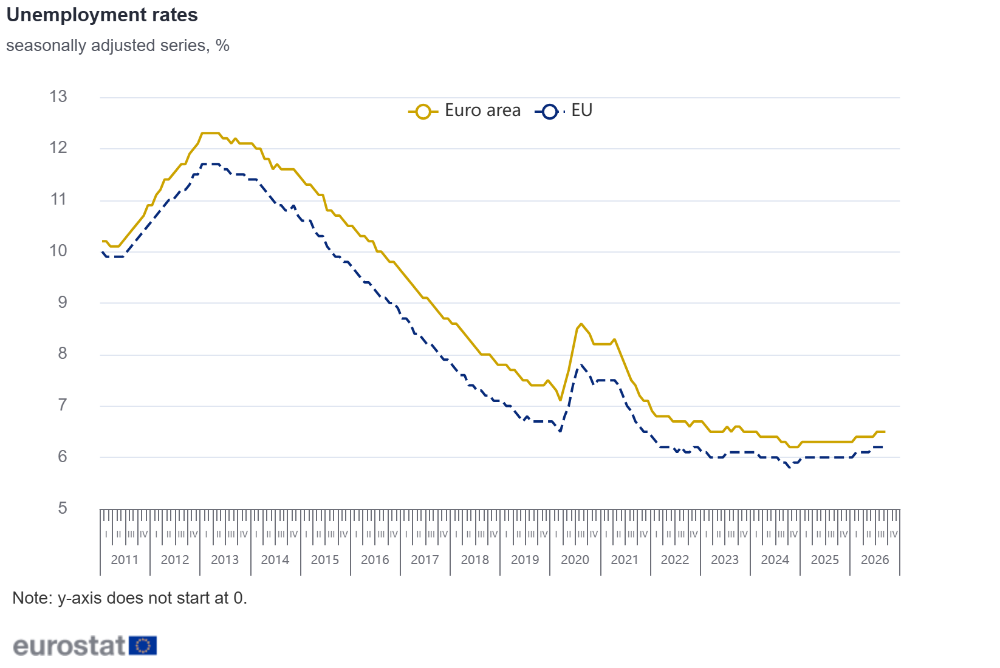
In September 2026, the euro area seasonally adjusted unemployment rate was 6.5%, stable compared with August 2026 and up from 6.3% in September 2025. The EU unemployment rate was 6.2% in September 2026, also stable compared with August 2026 and up from 6.0% in September 2025. These figures are published by Eurostat, the statistical office of the European Union.
Eurostat estimates that 13.773 million persons in the EU, of whom 11.555 million in the euro area, were unemployed in September 2026.
Compared with August 2026, unemployment increased by 105 thousand in the EU and by 122 thousand in the euro area.
Compared with September 2025, unemployment increased by 471 thousand in the EU and by 420 thousand in the euro area.
Youth unemployment
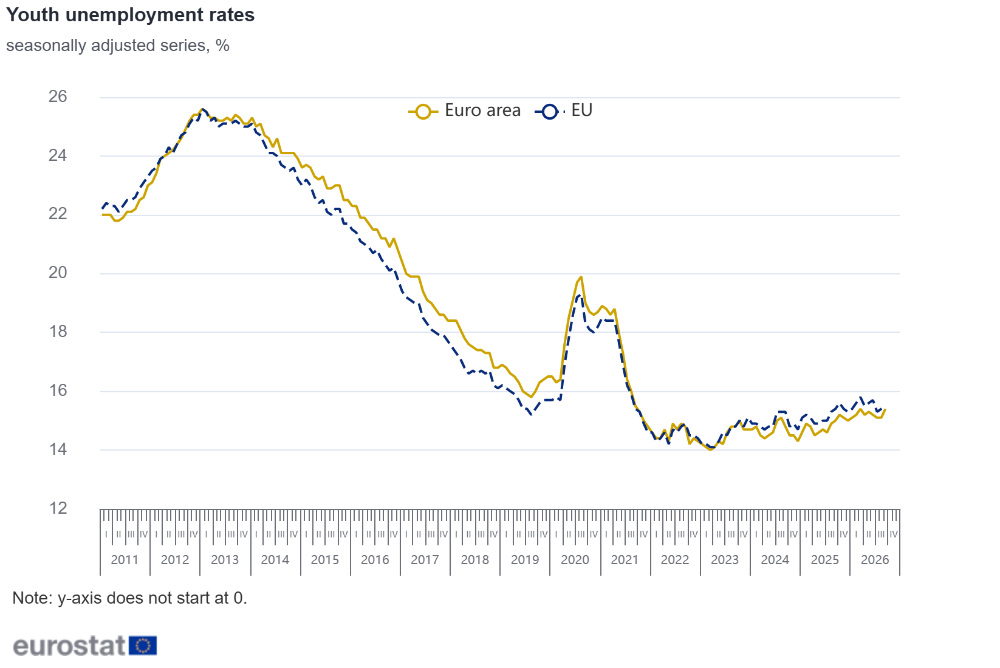
In September 2026, 3.022 million young persons (under 25) were unemployed in the EU, of whom 2.469 million were in the euro area. In September 2026, the youth unemployment rate was 15.5% in the EU, up from 15.4% in the previous month, and 15.4% in the euro area, also up from 15.1% in August 2026.
Compared with August 2026, youth unemployment increased by 44 thousand in the EU and by 69 thousand in the euro area.
Compared with September 2025, youth unemployment increased by 45 thousand in the EU and by 80 thousand in the euro area.
Unemployment by sex
In September 2026, the unemployment rate for women was 6.4% in the EU and the unemployment rate for men was 6.0%, both stable compared with the previous month. In the euro area, the unemployment rate for women was 6.7%, stable compared with August 2026, and the unemployment rate for men was 6.4%, up from 6.3% in the previous month.
Additional labour market indicators
The estimates in this News Release are based on the globally used International Labour Organisation (ILO) standard definition of unemployment, which counts as unemployed people without a job who have been actively seeking work in the last four weeks and are available to start work within the next two weeks.
To capture in full the labour market situation, the data on unemployment have been complemented by additional indicators, e.g. underemployed part-time workers, persons seeking work but not immediately available and persons available to work but not seeking, released together with EU Labour Force Survey (EU-LFS) data for the second quarter of 2026.
EU-LFS data for the third quarter of 2026 will be released on 11 December 2026.
Tables
Seasonally adjusted unemployment, totals
Rates (%)
Number of persons (in thousands)
Sep-25
Jun-26
Jul-26
Aug-26
Sep-26
Sep-25
Jun-26
Jul-26
Aug-26
Sep-26
6.3
6.4
6.5
6.5
6.5
11 135
11 369
11 400
11 433
11 555
6.0
6.2
6.2
6.2
6.2
13 302
13 664
13 655
13 668
13 773
6.3
6.3
6.0
5.9
6.0
345
345
329
325
329
3.6
3.5
3.5
3.5
3.4
109
106
106
105
103
3.1
3.2
3.3
3.1
2.8
164
176
179
169
154
6.3
6.6
6.7
5.8
6.8
207
222
224
194
227
3.8
4.0
4.0
4.1
4.1
1 682
1 744
1 757
1 766
1 773
7.1
6.7
7.7
7.8
8.0
53
50
57
58
59
4.9
4.9
5.0
5.0
5.0
144
146
149
149
149
8.8
8.0
7.9
7.4
7.6
417
383
377
352
360
10.4
10.2
10.2
10.2
10.3
2 581
2 569
2 576
2 585
2 600
7.9
8.3
8.3
8.3
8.5
2 511
2 670
2 666
2 654
2 732
5.0
4.4
4.4
4.3
4.3
89
79
78
77
78
5.9
6.1
6.1
6.2
6.3
1 502
1 572
1 564
1 615
1 620
4.2
3.8
3.9
4.0
4.0
22
21
21
22
21
7.0
7.1
7.3
7.3
7.3
67
68
69
69
69
6.6
6.2
6.2
6.1
6.2
104
97
97
96
97
6.7
7.1
7.1
7.3
7.3
24
25
25
26
26
4.5
4.5
4.5
4.7
4.6
219
217
221
231
225
2.7
3.5
3.4
3.5
3.4
9
12
12
12
12
4.0
3.8
4.0
4.0
4.0
409
393
404
408
408
5.5
5.8
6.2
6.7
6.3
265
278
295
318
296
3.3
3.4
3.4
3.4
3.4
580
610
603
597
596
5.9
5.7
5.7
5.6
5.6
329
323
320
318
313
6.0
6.8
6.4
6.4
6.3
491
555
527
523
517
4.2
3.8
3.5
3.4
3.6
44
39
36
35
37
5.5
5.7
5.7
5.7
5.7
151
157
157
156
156
10.0
10.4
10.4
10.4
10.5
287
301
301
303
305
8.8
8.7
8.7
8.7
8.7
508
506
506
506
507
4.8
5.8
5.9
5.9
5.9
11
14
14
14
14
4.6
4.5
4.5
4.6
4.6
140
139
139
140
141
5.0
5.1
:
:
:
256
264
:
:
:
4.4
4.2
4.1
4.1
4.2
7 568
7 088
6 904
7 057
7 108
Seasonally adjusted youth (under 25s) unemployment
Rates (%)
Number of persons (in thousands)
Sep-25
Jun-26
Jul-26
Aug-26
Sep-26
Sep-25
Jun-26
Jul-26
Aug-26
Sep-26
15.0
15.2
15.1
15.1
15.4
2 389
2 429
2 411
2 400
2 469
15.4
15.7
15.3
15.4
15.5
2 977
3 061
2 970
2 978
3 022
18.4
19.1
18.0
18.0
18.0
88
94
84
84
84
13.7
13.4
13.9
13.6
13.0
16
17
17
17
16
10.1
13.1
12.3
11.8
8.9
32
44
40
38
28
14.4
15.8
10.8
14.8
16.2
74
82
57
75
83
7.1
7.6
7.6
7.5
7.5
319
336
337
337
338
19.8
24.1
26.4
23.8
23.9
12
16
17
15
15
12.2
11.7
12.4
12.4
12.5
45
43
45
45
46
20.0
20.7
16.7
16.1
17.3
50
57
45
44
46
24.7
23.4
22.8
22.7
22.8
456
454
443
443
449
20.3
21.4
21.0
20.8
21.9
697
730
714
706
755
18.4
16.5
16.1
16.1
16.1
21
19
18
18
18
20.5
19.6
19.8
20.3
19.9
261
248
247
256
253
12.9
11.8
11.3
11.3
11.3
4
3
3
3
3
12.3
14.2
15.4
16.1
16.5
8
10
11
12
12
12.7
11.5
12.1
12.5
14.0
13
11
11
11
13
20.0
20.1
20.3
20.9
22.0
5
5
5
5
6
14.4
13.5
15.2
15.4
14.6
42
40
45
44
42
8.4
9.3
9.6
9.6
9.6
2
3
3
3
3
8.8
8.5
8.6
8.8
8.8
159
152
154
157
159
11.5
10.7
12.3
13.1
12.8
61
55
65
67
65
12.1
11.6
11.4
11.4
11.3
139
131
128
126
126
18.5
19.9
21.0
19.9
19.1
71
75
79
73
70
25.9
30.8
:
:
:
127
147
:
:
:
13.3
14.4
14.6
14.6
14.6
10
13
11
11
11
15.8
18.5
18.0
17.5
17.7
21
24
23
22
22
22.2
23.6
23.6
23.6
23.7
74
77
77
78
79
24.2
23.8
23.6
23.4
23.2
170
171
170
169
168
10.5
12.4
12.4
12.5
12.6
4
5
5
5
5
14.3
14.1
11.7
14.2
16.7
63
65
53
66
82
8.6
9.0
:
:
:
51
54
:
:
:
Seasonally adjusted unemployment rates (%), by sex
Males
Females
Sep-25
Jun-26
Jul-26
Aug-26
Sep-26
Sep-25
Jun-26
Jul-26
Aug-26
Sep-26
6.1
6.3
6.3
6.3
6.4
6.6
6.6
6.7
6.7
6.7
5.8
6.0
5.9
6.0
6.0
6.2
6.3
6.4
6.4
6.4
6.7
6.9
6.6
6.4
6.3
5.9
5.6
5.4
5.4
5.7
3.8
4.0
4.0
3.8
3.7
3.4
2.9
3.0
3.1
3.1
2.8
2.9
2.6
2.6
2.1
3.3
3.7
4.1
3.7
3.7
6.3
6.9
5.8
5.4
6.2
6.3
6.3
7.7
6.3
7.5
4.2
4.3
4.3
4.4
4.4
3.4
3.7
3.7
3.7
3.7
8.3
6.2
7.6
7.9
8.2
5.9
7.2
7.8
7.7
7.7
4.9
4.7
4.8
4.8
4.9
4.8
5.1
5.3
5.2
5.2
6.7
6.3
5.8
4.9
5.2
11.4
10.2
10.4
10.4
10.5
9.0
9.1
9.3
9.4
9.4
11.9
11.3
11.2
11.2
11.2
7.9
8.5
8.4
8.3
8.6
7.9
8.2
8.2
8.2
8.4
5.5
4.9
4.8
4.8
4.8
4.4
3.9
3.8
3.8
3.8
5.5
5.7
5.5
5.8
5.7
6.4
6.6
6.8
6.9
7.0
4.0
3.6
3.7
3.7
3.7
4.4
4.1
4.2
4.4
4.3
8.2
8.1
8.1
8.0
7.8
5.9
6.2
6.5
6.7
6.7
7.6
6.7
6.7
6.4
6.5
5.5
5.7
5.8
5.8
6.0
6.4
6.9
6.9
7.0
7.1
7.0
7.4
7.4
7.6
7.7
4.6
4.3
4.4
4.6
4.5
4.3
4.7
4.7
4.9
4.8
3.1
3.5
3.5
3.5
3.5
2.2
3.4
3.4
3.4
3.3
3.8
3.8
4.0
4.0
4.0
4.2
4.0
3.9
4.0
4.0
6.0
6.3
6.7
6.4
6.7
5.1
5.3
5.7
7.0
5.8
2.9
3.4
3.3
3.3
3.2
3.6
3.5
3.5
3.5
3.5
5.2
5.0
4.9
5.0
5.0
6.5
6.4
6.4
6.3
6.1
6.1
6.6
6.2
6.3
6.2
5.8
7.1
6.7
6.5
6.5
3.7
3.5
3.2
3.2
3.3
4.7
4.2
3.9
3.8
3.9
5.2
5.5
5.5
5.5
5.5
5.8
6.0
5.9
5.9
5.9
10.6
10.9
10.9
10.9
11.1
9.3
10.0
9.9
9.9
9.9
8.9
8.7
8.6
8.6
8.6
8.6
8.7
8.8
8.8
8.8
4.8
5.7
5.8
5.9
6.0
4.7
6.0
6.0
5.9
5.8
5.1
4.8
4.3
4.8
5.2
4.3
4.3
3.9
4.4
4.8
5.0
5.2
:
:
:
4.9
5.0
:
:
:
Notes for users
Revisions and timetable
The data in this News Release can be subject to revisions, caused by updates to the seasonally adjusted series whenever new monthly data are added, the inclusion of the most recent EU-LFS data in the calculation process and updates of seasonal adjustment models with complete annual data.
Compared with the rates published in the News Release of 1 October 2026, the August 2026 unemployment rate for the EU was revised from 6.1% to 6.2% and the unemployment rate for the euro area was revised from 6.4% to 6.5%. Among EU Member States, the rate has been revised by more than 0.1 percentage points (pp) downwards for only one country: Estonia (by 0.2 pp). The rate has been revised by more than 0.1 percentage points (pp) upwards for only one country: Spain (by 0.2 pp).
Country notes
Germany, the Netherlands, Finland, Sweden as well as Iceland and Norway: the trend component is used instead of the more volatile seasonally adjusted data.
Estonia and Portugal: 3-month moving averages of EU-LFS data are used instead of pure monthly indicators.
Malta: Exceptionally, the unemployment levels from April 2026 onwards are not yet benchmarked to the latest quarterly LFS data due to an ongoing data revision exercise at the national level.
Methods and definitions
Eurostat publishes harmonised unemployment rates for individual EU Member States, the euro area and the EU. These unemployment rates are based on the definition recommended by the International Labour Organisation (ILO). The measurement is based on a harmonised data source, the European Union Labour Force Survey (EU-LFS).
Based on the ILO definition, Eurostat defines unemployed persons as persons aged 15 to 74 who:
The unemployment rate is the number of people unemployed as a percentage of the labour force.
The labour force is the total number of people employed plus unemployed. In this news release unemployment rates are based on employment and unemployment data covering persons aged 15 to 74.
The youth unemployment rate is the number of people aged 15 to 24 unemployed as a percentage of the labour force of the same age. Therefore, the youth unemployment rate should not be interpreted as the share of jobless people in the overall youth population.
When data for the most recent month are not available for a Member State, EU and EA aggregates are calculated using the latest data available for that Member State.
Geographical information
Euro area (EA21): Belgium, Bulgaria, Germany, Estonia, Ireland, Greece, Spain, France, Croatia, Italy, Cyprus, Latvia, Lithuania, Luxembourg, Malta, the Netherlands, Austria, Portugal, Slovenia, Slovakia and Finland.
European Union (EU 27): Belgium, Bulgaria, Czechia, Denmark, Germany, Estonia, Ireland, Greece, Spain, France, Croatia, Italy, Cyprus, Latvia, Lithuania, Luxembourg, Hungary, Malta, the Netherlands, Austria, Poland, Portugal, Romania, Slovenia, Slovakia, Finland and Sweden.
For more information