
Wastewater collection
Hospital wastewater samples were collected from the central complex of the Sahlgrenska University Hospital in Gothenburg, the largest hospital in Sweden, with approximately 500 beds, with wards contributing sewage to the sampling point. Two 24-h composite samples, HWW1 and HWW2, were collected on January 7th and 21st, 2022, respectively, with eight complementary samples collected on 09Jan2025, 13May2025, 12Aug2025, 26Aug2025, 16Sep2025, 23Sep2025, 02Oct2025 and 08Oct2025. Composite samples were collected over each 24-h period (approximately 08:00-08:00), with approximately 31 mL sampled every 9 min (160 sub-samples per day), collected in refrigerated 5 L containers. Fresh samples were filtered sequentially (1.0, 0.45 and 0.22 µm pore size) to remove particles and bacteria. The sterility of each sample was confirmed by incubating 90% wastewater with 10% (v/v) lysogeny broth (LB) at 37 °C for 24 h (to mimic subsequent test conditions) and the optical density (OD) was measured at 600 nm. Filtered samples were stored in 50 mL falcon tube aliquots at −20 °C (2022 samples) and −80 °C (2025 samples) until further analyses.
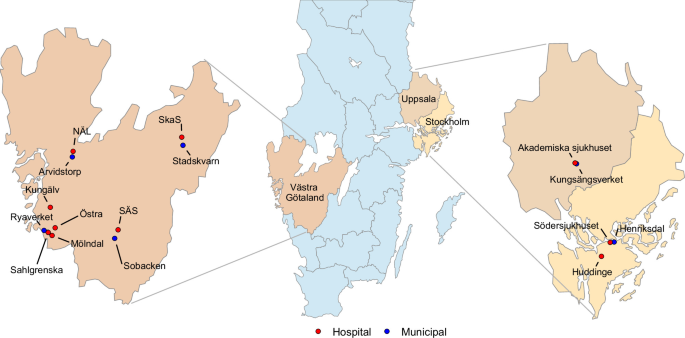
The broader wastewater sampling of hospitals and wastewater treatment facilities in the Västra Götaland Region (Sahlgrenska, Östra, Mölndal, Kungälv, Södra Älvsborgs sjukhus (SÄS), Norra Älvsborgs Sjukhus (NÄL) and Skaraborgs Sjukhus (SkaS)) and Uppsala (Akademiska) followed a similar sampling protocol but with the critical difference that samples were frozen without prior filtering (filtered only after thawing). The approximate number of beds for each hospital contributing sewage to the sampling points can be found in Supplementary Data 14. Composite 24 h samples (approximately 08:00-08:00) were collected on a minimum of 4 different days between 01Sept2024 and 30Nov2024, with a minimum of 4 days between sampling days (Supplementary Data 9). One subsample of 160 mL from each site was mixed with 40 mL 100% glycerol (final concentration 20%) and stored at −20 °C for cultivation-based analyses (no filtering) and DNA extraction for sequencing. Additionally, municipal wastewater treatment plants receiving untreated wastewater from these hospitals were sampled during the same period (Supplementary Data 9). Figure 1 shows the locations of both hospitals and municipal sites. Ryaverket receives wastewater from four hospitals (Sahlgrenska, Östra, Mölndal and Kungälv). Figure 1 was made using R (v 4.4.0) with packages sf (v, 1.1.0), dplyr (v. 1.1.4), ggplot2 (v. 4.0.0) and ggrepel (v. 0.9.6).
Composite samples (24 h) from two Stockholm hospitals (Södersjukhuset and Huddinge Sjukhus) and their corresponding municipal wastewater treatment plant (two influent and one effluent stream) were collected similarly as the broad sampling campaign above in December of 2022 and February of 2023.
Antibiotics usage data
The Region Västra Götaland kindly provided register data on each administered antibiotic dose, both orally and intravenously, from all wards contributing to wastewater at each hospital wastewater sampling point (aggregated data only). Neonatal wards were excluded as urine and faeces are consistently collected in diapers. Emergency departments were also excluded because of a different system for registering use. Usage data was collected for each of the 3 days preceding each of the wastewater sampling dates, acknowledging that time from administration to excretion via urine and faeces will vary both between antibiotics and between patients.
Antibiotic concentrations in collected HWW
Based on the usage data, we selected antibiotics for quantification with the intent to identify which antibiotics in the HWW could potentially cause selection as described in the ‘Results’ section. Antibiotics were analysed in triplicate using liquid chromatography (LC) coupled with triple quadrupole mass spectrometry (MS)16. Specifically, LC-MS grade methanol and acetonitrile (Lichrosolv—hypergrade) were used, and purified water was prepared using a Milli-Q Advantage system. The mobile chromatographic phases were prepared using formic acid (Sigma-Aldrich, Steinheim, Germany) at a concentration of 0.1%. All standards, including isotope-labelled standards, are listed in Supplementary Data 15. Prior to solid phase extraction and measurement by LC-MS, samples were thawed and spiked with 5 ng of each internal labelled and surrogate standard. The LC-MS analysis was conducted on a UHPLC system connected to a TSQ Quantitative triple quadrupole MS (Thermo Scientific, San Jose, USA) equipped with a heated electrospray ionisation ion source operating in positive mode. The MS settings used for the included chemicals are presented in Supplementary Data 15.
Selection experiment with wastewater and individual antibiotics in complex communities
To assess the selectivity of wastewater or individual antibiotics, we employed a previously described method using municipal wastewater microbial communities (n = 3) as inocula17,28. Notably, it is a selection-potential assay, not a reconstruction of sewer ecology. In brief, at the beginning of each selection experiment, a frozen batch of one inoculum was thawed at room temperature. Then, 0.1 mL of aliquots were inoculated into 15 mL falcon tubes containing 4.9 mL of a mixture consisting of 90% sterile-filtered wastewater (or physiological saline as control) and 10% LB. The tubes were incubated at 37 °C and 170 rpm for 24 h. Five microliters of these cultures were serially passaged daily over 72 h to a fresh tube containing the same ratio of wastewater (or physiological saline) and LB as described above. The selection potential of individual antibiotics was assessed using the same setup. Antibiotics (Sigma Aldrich; Sweden) were tested at concentrations measured in HWW and at breakpoint concentrations.
At the start of each experiment (0 h saline control) as well as after three passages, aliquots were cultured on antibiotic/non-antibiotic plates. To quantify resistant and non-resistant E. coli, CHROMagar™ ECC plates (CHROMagar™, France) were used with and without supplemented antibiotics at EUCAST 2022 clinical breakpoints (8 mg/L and 2 mg/L of amoxicillin and clavulanic acid (AMC); 4 mg/L of ceftazidime (CAZ); 16 mg/L of cefadroxil (CDR); 0.5 mg/L of ciprofloxacin (CIP); 4 mg/L and 76 mg/L of trimethoprim-sulfamethoxazole (SXT), respectively; 2 mg/L of tobramycin (TOB); and 8 mg/L and 4 mg/L of piperacillin and tazobactam, respectively; 8 mg/L of piperacillin (PIP)). These antibiotics represent several major classes of antibiotics frequently used in hospitals, all with activity against E. coli. Also, resistance to all of these antibiotics is present in E. coli in wastewater communities. It was therefore considered plausible that resistance to these classes could be selected for, either directly or indirectly (co-selection by other antibiotics). For the broad sampling campaign, including analyses of Stockholm samples (ten hospitals), only resistance to CIP (0.5 mg/L) and CTX (2 mg/L) was assessed. For K. pneumoniae, the agar plates were Simmons Citrate agar, pH 7.2 plus inositol (SCAI) plates (CHROMagar™, France), and SCAI supplemented with the same antibiotics at clinical breakpoints as specified for E. coli. The CHROMagar™ ECC plates were incubated for 20–24 h at 37 °C, and typical blue colonies (E. coli) were counted and reported as CFU/mL. The SCAI plates were incubated for 44–48 h at 42 °C, and typical yellow colonies were counted and reported as CFU/mL. Given that SCAI plates are less specific for K. pneumoniae than CHROMagar™ is for E. coli16,56, randomly selected colonies counted on each SCAI plate were confirmed as K. pneumoniae using matrix-assisted laser desorption/ionisation time of flight (MALDI-TOF MS). The resistance ratio was calculated by determining the number of colonies on antibiotic-containing plates (CFU/mL) relative to control plates without antibiotics. The percentage of resistance was calculated by multiplying this ratio by 100. One-way analysis of variance (ANOVA) with Dunnett’s multiple comparisons test was used to compare the wastewaters with physiological saline obtained at 0 h and 72 h, with each resistance type investigated separately. The response variable in the ANOVA was the log10-transformed percentage of resistance incremented by 1, to account for cases where the number of colonies on antibiotic-containing could be 0. One-way ANOVA with Dunnett’s multiple comparisons test was performed in GraphPad Prism (v10.1.0(316)).
To reach beyond classification of percentage of resistance above/below clinical breakpoints, and to assess if multi-resistant strains were selected for, disc diffusion tests were performed for fifty-two K. pneumoniae isolates (26 from 0 h and 26 from 72 h) that were randomly picked from SCAI plates. Overnight cultures were prepared for each isolate, and a solution corresponding to 0.5 McFarland standard was spread on Mueller–Hinton agar (MHA). Antibiotic discs (Oxoid, Sweden) were then placed on the agar plates, which were subsequently incubated at 37 °C for 16 h. The diameter of the inhibition zone around each disc was measured, and the results were interpreted according to the European Committee on Antimicrobial Susceptibility Testing (EUCAST 2022) guidelines.
Growth of individual K. pneumoniae isolates in HWW
To further enable comparisons of individual strains’ level of sensitivity to antibiotics with their potential for growth in hospital wastewater (HWW2), a collection of wastewater K. pneumoniae isolates (n = 117) with diverse resistance profiles was studied (Supplementary Data 7). The antibiotic susceptibility of each strain was evaluated using the Etest® method. The strips (BioMérieux, Marcy-l’Etoile, France) included amoxicillin/clavulanic acid (256 µg/mL), azithromycin (256 µg/mL), aztreonam (256 µg/mL), cefotaxime (32 µg/mL), ceftazidime (256 µg/mL), ceftriaxone (256 µg/mL), cefuroxime (256 µg/mL), cefepime (256 µg/mL), chloramphenicol (256 µg/mL), ciprofloxacin (32 µg/mL), clarithromycin (256 µg/mL), doripenem (32 µg/mL), gentamicin (256 µg/mL), imipenem (32 µg/mL), meropenem (32 µg/mL), nalidixic acid (256 µg/mL), oxacillin (256 µg/mL), piperacillin (256 µg/mL), tetracycline (256 µg/mL), and tobramycin (256 µg/mL). Overnight culture of each strain was diluted to 0.5 McFarland standard in physiological saline and spread onto a MHA plate. The Etest® strips were then placed on the plate and incubated at 37 °C for 16–20 h to determine MICs.
Individual growth curves were generated in triplicate for each isolate in HWW2 using the OmniLog™ (Biolog, USA) system in 96-well plates. Briefly, 18 mL of sterile filtered wastewater or saline was combined with 2 mL of LB medium and 200 µL of Biolog redox dye A per plate. The dye changes from yellow to purple as cells convert extracellular metabolites into mitochondrial reducing equivalents. After 200 µL of this mixture was added to every well, 2.5 µL of an overnight culture of each strain was inoculated into every second well. The remaining wells served as contamination controls. The plates were incubated at 37 °C with images taken every 15 min for 24 h. Total growth, measured as area under the curve over 24 h, was based on the median of three technical replicates.
Construction of isogenic resistant E. coli strains
Experiments with isogenic strains that only differ by one or a few defined resistance genes can provide strong evidence for selection pressures caused by the type of antibiotics to which those genes provide resistance. We therefore created a set of isogenic plasmids to test the growth-inhibiting effects of fluoroquinolones and β-lactams in E. coli. The plasmid vector pZE21, containing a kanamycin resistance marker, was chosen as the template for the plasmid construction. The plasmid was linearized using PCR with primers that inversely flanked the multiple cloning site (MCS) region to create complementary ends for precise insertion of the genes of interest (GOIs) using Gibson Assembly. Since the GOIs contain their own promoters and terminators, the MCS was intentionally removed during linearization to prevent interference with gene expression.
The selected antibiotic resistance genes were blaNDM-1 (CP145538.1) (resistance to essentially all β-lactams) and qnrB (CP039327.1) (resistance to fluoroquinolones). Each gene sequence was modified in silico by adding the recA (∆LexA) promoter 16 bp upstream of the start codon and a rrnG terminator 12 bp downstream of the stop codon. Additional nucleotides were added flanking these regions to account for Gibson Assembly complementary sites. The 5′- and 3′-prime ends of the blaNDM-1 and qnrB constructs were designed with unique complementary ends for directional and multiplexed Gibson Assembly. The qnrB gene’s upstream sequence was complementary to one end of the linear plasmid, the downstream end was complementary to the upstream end of the blaNDM-1 construct, and the downstream end of the blaNDM-1 construct was complementary to the other end of the linear plasmid. The overlapping regions were 15 bp in length with a melting temperature of 50 °C, following the Gibson Assembly® Cloning Kit (New England Biolabs, USA) protocol. The complementary regions were designed and tested in silico using the SnapGene Software (Version 7.1.1), as well as all primers used in this study (Supplementary Data 16). These constructs were created through de novo DNA synthesis by Twist Bioscience, USA.
The linearization of pZE21 plasmid and the amplification of synthesised qnrB and blaNDM-1 genes were performed using PhusionTM High-fidelity DNA polymerase (ThermoFisher, USA) and primers listed in Supplementary Data 16. PCR products were purified using AmpureXP beads (Beckman Coulter, USA) following the manufacturer’s instructions.
A Gibson assembly reaction was performed to circulate pZE21 plasmid (150 ng) with qnrB (100 ng) and blaNDM-1 (100 ng) genes in a total volume of 20 µL. The mixture was incubated at 50 °C for 30 min. Assembled plasmid (pNR-11) was then electroporated into E. coli TOP10 and selected on LB agar containing kanamycin 50 mg/L. The qnrB and blaNDM-1 genes were respectively removed from pNR-11 plasmid (generating plasmids pNR-01 and pNR-10) by PCR using primers Con2_F & pZE21_LR and pZE21_LF & Con1_R (Supplementary Data 16). The resulting linearized plasmids were 5′-phosphorylated using T4 kinase (Thermo Scientific) at 37 °C for 20 min before circulated with T4 ligase (New England Biolabs) at 16 °C overnight. The plasmids were then transformed into E. coli TOP10 and selected on LB containing kanamycin 50 mg/L. The plasmid sizes and inserted genes were confirmed by PCR using corresponding primers (Supplementary Data 16).
All desired plasmids were extracted from E. coli TOP10 using GeneJET plasmid miniprep kit (Thermofisher, USA) by following the manufacturer’s instructions and then finally transformed into an environmental E. coli strain (MC221) that was largely antibiotic-sensitive (Supplementary Data 4 and 5) and not able to grow in HWW.
All constructed strains as well as the background strain were investigated for their antibiotic resistance profile by disc diffusion test using the procedure of the CLSI against ciprofloxacin (5 µg), cefotaxime (30 µg), meropenem (5 µg), mecillinam (10 µg), amoxicillin (10 µg), piperacillin (30 µg), amikacin (30 µg), gentamicin (10 µg), tobramycin (10 µg), trimethoprim (5 µg), chloramphenicol (30 µg) and doxycycline (30 µg) (Supplementary Data 4). Additionally, the MICs of tobramycin, ciprofloxacin, cefotaxime and meropenem were investigated by broth microdilution (Supplementary Data 5). Reference strain E. coli ATCC 25922 was used to verify the quality of the testing procedures.
The collection of isogenic strains was subsequently tested for their growth in the presence of HWW using the OmniLogTM-setup as described above under section ‘Growth of individual K. pneumoniae isolates in HWW’.
Generation of ciprofloxacin-resistant K. pneumoniae mutants
As an alternative way of testing the hypothesis that only ciprofloxacin resistance was necessary for growth in HWW, non-growing strains of K. pneumoniae were selected and made resistant to ciprofloxacin by increasing their MIC. Briefly, these strains were initially cultured in Mueller–Hinton broth overnight. Subsequently, 5 µL of the initial culture was transferred to Mueller–Hinton broth containing increasing concentrations of ciprofloxacin (0.008, 0.016, and 0.03 mg/L) after every 24 h. The bacteria were then plated on SCAI plates supplemented with 0.02 mg/L of ciprofloxacin after exposure to 0.03 mg/L. Mutant strains were then isolated, and their growth curves in LB and HWW using the Omnilog™ machine were generated as described in section ‘Growth of individual K. pneumoniae isolates in HWW’.
Morphological changes assessed by microscopy analysis
All microscopy was performed on a Nikon Eclipse Ti2 equipped with a CFI Plan Apochromat DM Lambda 100× Oil objective (N.A. 1.45, W.D. 0.13 mm), a Photometrics PRIME BSI camera, a Lumencor Sola SE II FISH 365 light source, an Okolab temperature incubation chamber, and NIS-Elements AR software version 5.21.03. Images were analysed with ImageJ57 and MicrobeJ58. Experiments were performed in a minimum of three replicates for all control conditions and a minimum of two replicates for wastewater samples.
Phenotypic analysis experiments were performed using E. coli HS524 (MG1655 mreB::mreB-msfgfp kan)59 (MreB localization), and E. coli RC1 (Δlac Δara ΔminCDE) carrying plasmid pFX9 (bla Plac-gfp-minD minE)36 (MinD oscillation). All E. coli strains were aerobically grown in LB at 37 °C and stress experiments were performed in early log phase (OD600 0.2–0.4). Antibiotics were added at the following concentrations: 0.5 µg/mL ciprofloxacin, 0.012, 0.02, and 2 µg/mL cefotaxime, and 100 µM CCCP. For exposure to wastewater samples, cells were pelleted (1 min, 16 000 × g, 37 °C) and resuspended in filtered effluent samples. For MreB localization, E. coli HS524 was grown until an OD600 of 0.3–0.4 and treated with antibiotics and wastewater samples as specified above. Images were taken after 30 min of treatment. For MinD oscillation, E. coli RC1 pFX9 was grown until an OD600 of 0.2 followed by addition of 10 µM isopropyl β-d-1-thiogalactopyranoside (IPTG) to induce the expression of GFP-MinD. After 30 min, antibiotics were added as specified above. For wastewater samples, 10 µM IPTG was re-added after resuspension in effluent. After 30 min of antibiotic treatment, time-lapse microscopy was performed, recording images every 15 s for 2 min. Image stacks were converted into videos using ImageJ.
DNA extraction and sequencingDNA extractions
Sixteen biofilm samples (eight hospital and eight municipal sources) and 83 wastewater samples (51 hospital and 32 municipal sources were selected from the Västra Götaland County and Uppsala City sampling; Supplementary Data 17). Too small volumes of treated municipal effluent were unfortunately collected to generate useful amounts of DNA. Aliquots from each wastewater and biofilm sample were taken, 40 mL and 20 mL respectively, and frozen at −20 °C. The samples were thawed at room temperature and centrifuged at 16,100 × g for 1 h using a 5810R Centrifuge (Eppendorf, Germany). DNA was extracted from the collected particulate samples using an in-house modified chloroform-isoamyl alcohol and alcohol-salt precipitation protocol (Supplementary Methods). Samples resulting in DNA concentrations >10 ng/µl and yielding at least 500 ng were considered successful.
Shotgun metagenomic sequencing
Shotgun metagenomics sequencing using a NovaSeqXPlus was outsourced to NGI Sweden, a division of SciLifeLab located in Stockholm, using an ISO/IEC 17025-accredited workflow (Supplementary Methods). During sequencing, the hospital wastewater sample NÄL 10/7/2024 was lost and therefore excluded from further analysis. Moreover, the hospital biofilm sample from Östra was recognised as a compromised sample (hanging above the water surface) and therefore also excluded from the study.
Sequencing resulted in an average of 231 million reads per sample (SD = 41 million reads, combined forward and reverse) after quality filtering. The overall quality of the sequencing reads was high, boasting a Phred score larger than 35 for all samples. Therefore, the outcomes of the sequencing produced reads that were appropriate for further downstream analysis.
Metagenomic data analysis
Analyses were hosted and executed on our in-house server running Red Hat Enterprise Linux (v7.9) consisting of 80 Intel(R) Xeon(R) Gold 6230 CPU @ 2.10 GHz CPUs and 754 G RAM. All scripting and data processing was mediated through python programming (v3.9.15) and the software environments were maintained using Anaconda (v21.48.22.159-1). Descriptive and interferential statistics on the outcomes of the Diamond and Sylph software processing were done using the R Statistical Software (v4.5.1) and RStudio interactive development environment (v2025.05.1, Build 513). All descriptive plots were generated using ggplot2 (v3.5.2).
A custom workflow was used to mediate metagenomic data processing (Suppl Methods). Briefly, quality assessments before and after quality trimming were done using FastQC (v0.11.9) and summarised using MultiQC (v1.14). Sequencing read quality trimming was performed using BBMap (v39.01). Diamond BLAST was used to estimate the abundance of ARGs using the ResFinder database (v2.0.2)60. To account for variations in sequencing depth, all Diamond counts were normalized as counts per million reads.
Microbial community composition was determined using the Sylph (v0.8.1) metagenomic profiling software61 and their proprietary GTDB_r226 reference database. Beta-diversity was calculated on genus level to determine the taxonomic variations and similarities between samples. This was done using the vegan package (v2.7-2) and the vegdist function. Principal Coordinates Analysis (PCoA) based on Bray–Curtis dissimilarities was performed using classical multidimensional scaling to generate two-dimensional coordinates for visualising beta-diversity differences between samples.
In all cases, the overall distribution of data was not considered normal (p < 0.05) as assessed by the Shapiro–Wilk and Anderson–Darling tests. Therefore, non-parametric statistical tests were used to determine significance between groups. For two independent groups, the Mann–Whitney U test was used; for multiple group comparisons, the Kruskal–Wallis test was used. Significance was recognised for p-values < 0.05. In the event of a significant result within groups, the Dunn’s test post-hoc analysis was used.
Comparing degrees of resistance in E. coli and ARG counts between wastewaters and biofilms
From the wastewater samples (September–November 2024) stored in 20% glycerol, a small subsample was serially diluted and plated on CHROMagar™ ECC plates (CHROMagar™, France) and on CHROMagar™ ECC supplemented with antibiotics (ciprofloxacin and cefotaxime) at clinical breakpoints (0.5 mg/L and 2 mg/L respectively), generating CFU/mL. This was done in quadruplicate for each location, providing technical replication, while each date, a minimum of 3 per location, was a biological replicate. The volume plated for each dilution was always 100 µl. A similar methodology was performed for biofilms; however, before taking a small subsample, the biofilms were broken up through vortexing for at least 1 min with glass beads. Thus, the detection limit of E. coli was 1 CFU per 100 µl of resuspended biofilm sample or serially diluted wastewater sample. Additionally, the hospital biofilms were plated 16 times each, as opposed to in quadruplicate, providing more technical replication. Notably, since there was only one biofilm collected per location, there was no biological replication, only technical replication of the biofilm analyses. The median CFU/ml counts of the technical replicates were then used as input to calculate the resistance rates of E. coli (by dividing the counts on antibiotic-supplemented plates by the counts from non-antibiotic plates) for all samples and to perform statistical tests.
To test for significant differences in resistance rates in E. coli between biofilms and waters from hospital and municipal influent sites, negative binomial mixed-effects models were used. For each antibiotic separately, the median CFU/ml from the technical replicates on the antibiotic-containing plates was used as a response variable, while the median CFU/mL from the corresponding non-antibiotic plates was used as an offset. Random intercepts for each site and sample ID (unique identifier for a biological replicate) were also included. This use of an offset allows modelling of a resistance rate (resistant E. coli counts vs total E. coli counts), while the random intercepts account for clustering/relatedness among samples (i.e. that resistance rates in biofilms and in waters from the same site may be correlated). One overall model per antibiotic was fitted, where matrix (wastewater vs. biofilm), location type (hospital vs. municipal influent), and their interaction were used as fixed effects. From these models, the contrast across the matrix for the two location types was estimated and tested for significance using a two-sided Wald z-test. This would correspond to testing the log ratio of resistance rates in hospital wastewaters vs hospital biofilms or municipal influent wastewaters vs municipal influent biofilms. A significant, positive value would indicate enrichment of resistance in the biofilm compared to the wastewater for the given location type. Similarly, the contrast across location type for the two matrix types was estimated and tested for significance using a two-sided Wald z-test. This would correspond to testing the log ratio of resistance rates in hospital vs municipal influent biofilms, or hospital vs municipal influent wastewaters. A significant, positive value would indicate enrichment of resistance in the hospital compared to municipal influent for the given matrix type. For the Wald z-tests, Bonferroni correction was applied to the resulting p-values to account for the multiple comparisons being made: two comparisons for contrasts across matrix and two comparisons for contrasts across location type. Also, tests for the significance of the interaction term, which would indicate differences in changes in resistance rates between biofilms and wastewaters across the two location types, were performed via a likelihood ratio test comparing the fitted model with a simplified model fitted without the interaction term.
As a complement to the analysis based on E. coli, a similar analysis was performed based on the total ARG counts from the metagenomic sequencing data (Section ‘DNA extraction and sequencing’). Here, the total ARG count was used as a response variable, while the total million reads were used as an offset in a negative binomial mixed-effects model, with random intercepts for each site. This use of an offset means that what is effectively modelled is the ARG counts per million reads, while the random intercepts account for relatedness among samples (i.e. how the ARG carriage rates in biofilms and wastewaters may be correlated within sites). As for the E. coli-based analysis, one overall model with location type, matrix and their interaction as fixed effects was fitted and the significance of the interaction term was tested. Then, the contrast across matrix was computed and tested for significance using a two-sided Wald z-test for both location types. This tests the estimated log ratio of total ARG counts per million reads between biofilms and wastewaters. A significant, positive value would indicate higher ARG carriage rates in biofilms than wastewater for the given location type. Bonferroni correction was applied to the p-values to account for the multiple comparisons being made.
All statistical analysis were performed in R (v.4.4). All negative binomial mixed effects models were fitted using the R package glmmTMB (v.1.1.14) and corresponding contrast and hypothesis test calculations were performed using the emmeans (v.2.0.1) package. Residuals were checked using DHARMa (v.0.4.7).
Reporting summary
Further information on research design is available in the Nature Portfolio Reporting Summary linked to this article.