

Sep 1, 2025
IndexBox has just published a new report: United Kingdom – Knives, Scissors And Blades – Market Analysis, Forecast, Size, Trends and Insights.
The article discusses the rising demand for knives, scissors, and blades in the UK and predicts a steady increase in consumption over the next decade. Despite a forecasted deceleration in market performance, the market is expected to expand with a CAGR of +0.2% from 2024 to 2035. By the end of 2035, the market volume is projected to reach 41M units, while the market value is forecasted to grow to $105M.
Market Forecast
Driven by increasing demand for knives, scissors and blades in the UK, the market is expected to continue an upward consumption trend over the next decade. Market performance is forecast to decelerate, expanding with an anticipated CAGR of +0.2% for the period from 2024 to 2035, which is projected to bring the market volume to 41M units by the end of 2035.
In value terms, the market is forecast to increase with an anticipated CAGR of +0.2% for the period from 2024 to 2035, which is projected to bring the market value to $105M (in nominal wholesale prices) by the end of 2035.
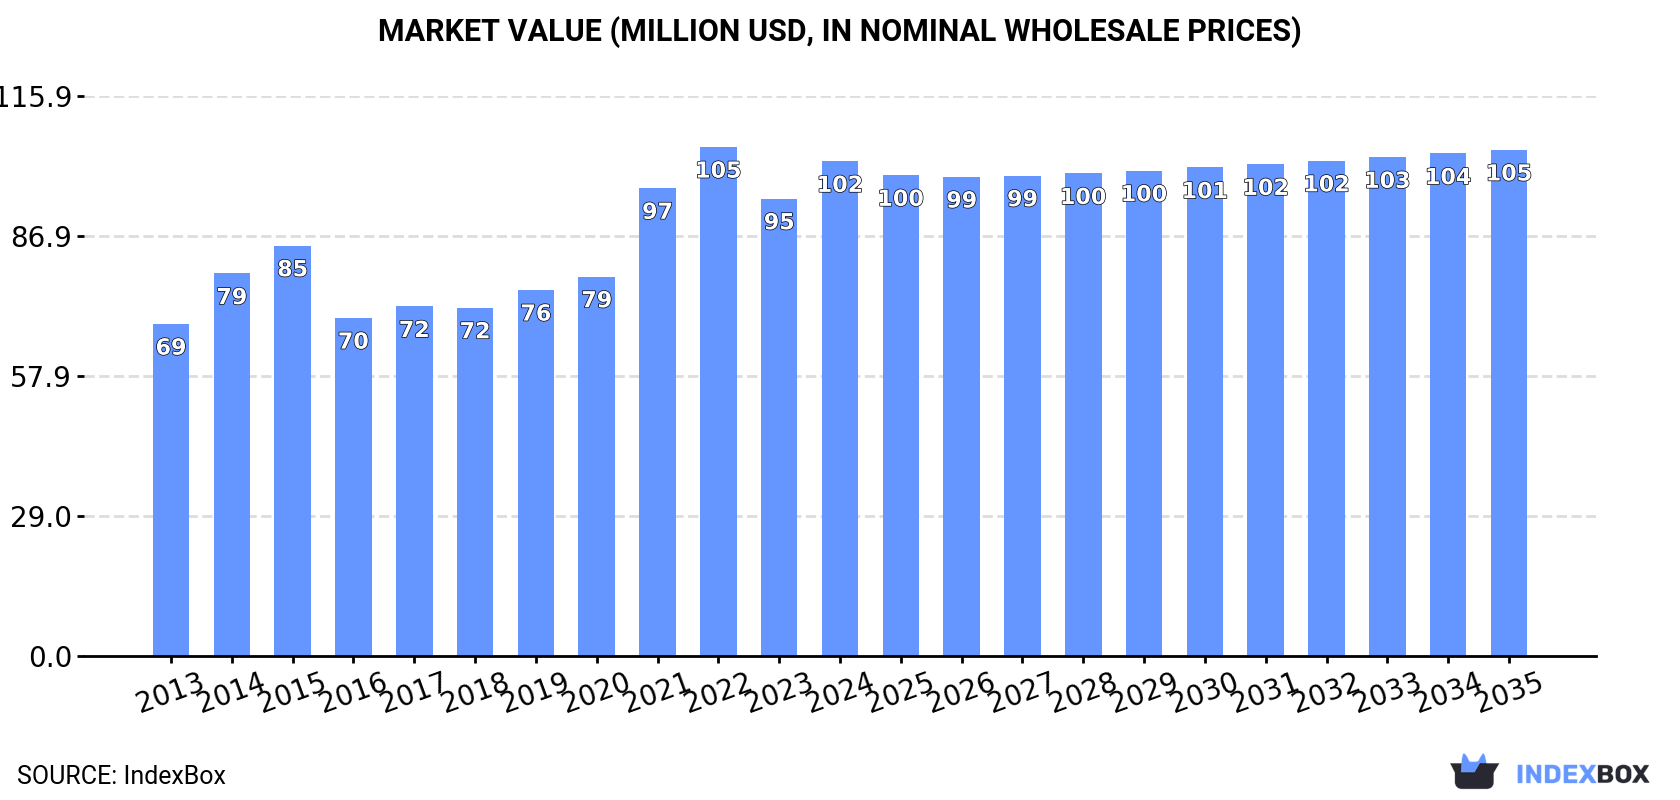 ConsumptionUnited Kingdom’s Consumption of Knives, Scissors And Blades
In 2024, after two years of decline, there was significant growth in consumption of knives, scissors and blades, when its volume increased by 18% to 40M units. The total consumption volume increased at an average annual rate of +2.4% over the period from 2013 to 2024; the trend pattern remained relatively stable, with only minor fluctuations being observed throughout the analyzed period. Knife and scissors consumption peaked at 41M units in 2015; however, from 2016 to 2024, consumption stood at a somewhat lower figure.
The value of the knife and scissors market in the UK amounted to $102M in 2024, growing by 8.2% against the previous year. This figure reflects the total revenues of producers and importers (excluding logistics costs, retail marketing costs, and retailers’ margins, which will be included in the final consumer price). In general, the total consumption indicated a measured increase from 2013 to 2024: its value increased at an average annual rate of +3.7% over the last eleven years. The trend pattern, however, indicated some noticeable fluctuations being recorded throughout the analyzed period. Based on 2024 figures, consumption decreased by -2.8% against 2022 indices. Knife and scissors consumption peaked at $105M in 2022; however, from 2023 to 2024, consumption failed to regain momentum.
ProductionUnited Kingdom’s Production of Knives, Scissors And Blades
In 2024, production of knives, scissors and blades in the UK fell modestly to 4.8M units, stabilizing at 2023 figures. Over the period under review, production, however, saw a resilient increase. The pace of growth was the most pronounced in 2019 when the production volume increased by 189% against the previous year. As a result, production reached the peak volume of 4.9M units. From 2020 to 2024, production growth remained at a somewhat lower figure.
In value terms, knife and scissors production stood at $16M in 2024 estimated in export price. Overall, production, however, enjoyed prominent growth. The pace of growth was the most pronounced in 2019 with an increase of 210% against the previous year. Over the period under review, production hit record highs in 2024 and is likely to continue growth in the near future.
ImportsUnited Kingdom’s Imports of Knives, Scissors And Blades
In 2024, purchases abroad of knives, scissors and blades was finally on the rise to reach 46M units for the first time since 2021, thus ending a two-year declining trend. Overall, imports showed a relatively flat trend pattern. The pace of growth was the most pronounced in 2014 when imports increased by 30%. As a result, imports reached the peak of 55M units. From 2015 to 2024, the growth of imports remained at a lower figure.
In value terms, knife and scissors imports rose markedly to $121M in 2024. The total import value increased at an average annual rate of +1.8% over the period from 2013 to 2024; however, the trend pattern remained consistent, with somewhat noticeable fluctuations being recorded in certain years. The most prominent rate of growth was recorded in 2014 with an increase of 22% against the previous year. As a result, imports attained the peak of $122M. From 2015 to 2024, the growth of imports remained at a lower figure.
Imports By Country
In 2024, China (37M units) constituted the largest supplier of knife and scissors to the UK, accounting for a 80% share of total imports. Moreover, knife and scissors imports from China exceeded the figures recorded by the second-largest supplier, Turkey (2.4M units), more than tenfold. Taiwan (Chinese) (1.1M units) ranked third in terms of total imports with a 2.5% share.
From 2013 to 2024, the average annual growth rate of volume from China totaled +1.2%. The remaining supplying countries recorded the following average annual rates of imports growth: Turkey (+21.6% per year) and Taiwan (Chinese) (+4.2% per year).
In value terms, China ($71M) constituted the largest supplier of knives, scissors and blades to the UK, comprising 59% of total imports. The second position in the ranking was held by Germany ($7.7M), with a 6.4% share of total imports. It was followed by Taiwan (Chinese), with a 5.5% share.
From 2013 to 2024, the average annual rate of growth in terms of value from China stood at +2.2%. The remaining supplying countries recorded the following average annual rates of imports growth: Germany (-2.8% per year) and Taiwan (Chinese) (+7.5% per year).
Imports By Type
Scissors and tailor shears (16M units), knives having fixed cutting blades (9.2M units) and table knives (5.5M units) were the main products of knife and scissors imports to the UK, together comprising 68% of total imports. Clasp knives, knives; with handles of base metal, knives with cutting blades, serrated or not (including pruning knives) and blades; cutting, serrated or not, excluding those of heading no. 8208 lagged somewhat behind, together comprising a further 32%.
From 2013 to 2024, the biggest increases were recorded for knives; with handles of base metal (with a CAGR of +8.3%), while purchases for the other products experienced more modest paces of growth.
In value terms, knives, scissors and blades with the largest imports in the UK were knives having fixed cutting blades ($33M), scissors and tailor shears ($25M) and knives with cutting blades, serrated or not (including pruning knives) ($23M), together comprising 67% of total imports. Clasp knives, table knives, knives; with handles of base metal and blades; cutting, serrated or not, excluding those of heading no. 8208 lagged somewhat behind, together accounting for a further 33%.
In terms of the main product categories, knives; with handles of base metal, with a CAGR of +9.3%, recorded the highest growth rate of the value of imports, over the period under review, while purchases for the other products experienced more modest paces of growth.
Import Prices By Type
The average knife and scissors import price stood at $2.6 per unit in 2024, dropping by -7% against the previous year. Over the last eleven-year period, it increased at an average annual rate of +1.1%. The most prominent rate of growth was recorded in 2022 an increase of 13% against the previous year. As a result, import price attained the peak level of $2.9 per unit. From 2023 to 2024, the average import prices failed to regain momentum.
Prices varied noticeably by the product type; the product with the highest price was knives with cutting blades, serrated or not (including pruning knives) ($9.8 per unit), while the price for knives; with handles of base metal ($1.1 per unit) was amongst the lowest.
From 2013 to 2024, the most notable rate of growth in terms of prices was attained by knives with cutting blades, serrated or not (including pruning knives) (+3.1%), while the prices for the other products experienced more modest paces of growth.
Import Prices By Country
The average knife and scissors import price stood at $2.6 per unit in 2024, reducing by -7% against the previous year. Over the last eleven-year period, it increased at an average annual rate of +1.1%. The growth pace was the most rapid in 2022 an increase of 13%. As a result, import price reached the peak level of $2.9 per unit. From 2023 to 2024, the average import prices failed to regain momentum.
There were significant differences in the average prices amongst the major supplying countries. In 2024, amid the top importers, the country with the highest price was France ($16 per unit), while the price for Turkey ($936 per thousand units) was amongst the lowest.
From 2013 to 2024, the most notable rate of growth in terms of prices was attained by France (+17.9%), while the prices for the other major suppliers experienced more modest paces of growth.
ExportsUnited Kingdom’s Exports of Knives, Scissors And Blades
In 2024, shipments abroad of knives, scissors and blades was finally on the rise to reach 10M units for the first time since 2018, thus ending a five-year declining trend. Overall, exports, however, showed a noticeable reduction. The most prominent rate of growth was recorded in 2014 when exports increased by 28%. As a result, the exports reached the peak of 18M units. From 2015 to 2024, the growth of the exports remained at a somewhat lower figure.
In value terms, knife and scissors exports expanded rapidly to $34M in 2024. Over the period under review, exports, however, continue to indicate a relatively flat trend pattern. The growth pace was the most rapid in 2014 with an increase of 27%. As a result, the exports attained the peak of $47M. From 2015 to 2024, the growth of the exports failed to regain momentum.
Exports By Country
Belgium (3.2M units) was the main destination for knife and scissors exports from the UK, with a 31% share of total exports. Moreover, knife and scissors exports to Belgium exceeded the volume sent to the second major destination, Poland (1.5M units), twofold. The third position in this ranking was taken by the United States (1.2M units), with a 12% share.
From 2013 to 2024, the average annual rate of growth in terms of volume to Belgium was relatively modest. Exports to the other major destinations recorded the following average annual rates of exports growth: Poland (+2.8% per year) and the United States (+3.2% per year).
In value terms, the largest markets for knife and scissors exported from the UK were Belgium ($7.4M), the United States ($5.6M) and Poland ($3.4M), together comprising 48% of total exports. Ireland, France, Germany, Sweden, the Netherlands, Australia, Thailand and Italy lagged somewhat behind, together comprising a further 34%.
Sweden, with a CAGR of +10.7%, recorded the highest rates of growth with regard to the value of exports, among the main countries of destination over the period under review, while shipments for the other leaders experienced more modest paces of growth.
Exports By Type
Blades; cutting, serrated or not, excluding those of heading no. 8208 (6M units) was the largest type of knives, scissors and blades exported from the UK, accounting for a 58% share of total exports. Moreover, blades; cutting, serrated or not, excluding those of heading no. 8208 exceeded the volume of the second product type, clasp knives (1.6M units), fourfold. The third position in this ranking was taken by scissors and tailor shears (1M units), with a 9.9% share.
From 2013 to 2024, the average annual growth rate of the volume of blades; cutting, serrated or not, excluding those of heading no. 8208 exports amounted to -1.1%. With regard to the other exported products, the following average annual rates of growth were recorded: clasp knives (+1.4% per year) and scissors and tailor shears (-8.1% per year).
In value terms, blades; cutting, serrated or not, excluding those of heading no. 8208 ($13M), clasp knives ($7.3M) and knives having fixed cutting blades ($5.5M) constituted the most exported types of knives, scissors and blades from the UK worldwide, with a combined 76% share of total exports.
In terms of the main product categories, clasp knives, with a CAGR of +2.8%, recorded the highest rates of growth with regard to the value of exports, over the period under review, while shipments for the other products experienced mixed trend patterns.
Export Prices By Type
The average knife and scissors export price stood at $3.3 per unit in 2024, approximately reflecting the previous year. Over the period from 2013 to 2024, it increased at an average annual rate of +1.8%. The growth pace was the most rapid in 2023 when the average export price increased by 13%. The export price peaked in 2024 and is likely to see gradual growth in the immediate term.
Prices varied noticeably by the product type; the product with the highest price was knives with cutting blades, serrated or not (including pruning knives) ($15 per unit), while the average price for exports of blades; cutting, serrated or not, excluding those of heading no. 8208 ($2.2 per unit) was amongst the lowest.
From 2013 to 2024, the most notable rate of growth in terms of prices was recorded for the following types: scissors and tailor shears (+5.6%), while the prices for the other products experienced more modest paces of growth.
Export Prices By Country
The average knife and scissors export price stood at $3.3 per unit in 2024, remaining stable against the previous year. Over the period from 2013 to 2024, it increased at an average annual rate of +1.8%. The pace of growth was the most pronounced in 2023 an increase of 13%. Over the period under review, the average export prices hit record highs in 2024 and is expected to retain growth in the near future.
There were significant differences in the average prices for the major external markets. In 2024, amid the top suppliers, the country with the highest price was Italy ($7.3 per unit), while the average price for exports to Poland ($2.2 per unit) was amongst the lowest.
From 2013 to 2024, the most notable rate of growth in terms of prices was recorded for supplies to Italy (+11.1%), while the prices for the other major destinations experienced more modest paces of growth.