

The USD/JPY weekly forecast indicates further weakness in the US labor market.
The US economy added only 22,000 jobs in August.
Next week, the US will release its consumer and wholesale inflation reports.
The USD/JPY weekly forecast indicates further weakness in the US labor market, which supports a more dovish Fed.
Ups and downs of USD/JPY
USD/JPY ended the week bullish but closed well below its highs as the dollar dropped. At the start of the week, the dollar recovered briefly against the yen as traders awaited crucial US employment figures. However, as the data came in, it became clear that the labor market had softened more than expected.
–Are you interested to learn more about MT5 brokers? Check our detailed guide-
Nonfarm payrolls revealed that the US economy added only 22,000 jobs in August, compared to the forecast of 75,000. Meanwhile, the unemployment rate rose to 4.3% as expected. The poor figures increased expectations for Fed rate cuts, weighing on the dollar.
Next week’s key events for USD/JPY
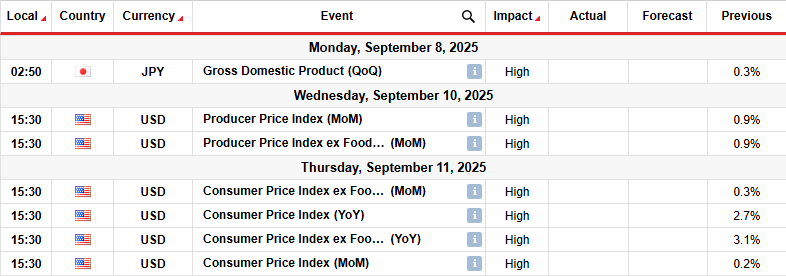
Next week, the US will release its consumer and wholesale inflation reports, which will shape the outlook for Fed rate cuts. Already, market participants are fully pricing a rate cut in September. However, the outlook for future rate cuts is still changing. Moreover, there is a chance the Fed will opt to deliver a massive rate cut this month.
If consumer inflation comes in below estimates, rate cut expectations will increase, and the dollar will extend its decline. On the other hand, a positive figure could ease rate cut bets.
USD/JPY weekly technical forecast: Bears prepare to challenge the channel support
 USD/JPY daily chart
On the technical side, the USD/JPY price trades in a bullish channel with clear support and resistance lines. However, the price is also chopping through the 22-SMA, a sign that bears are showing strength. This also indicates that the move is corrective.
–Are you interested to learn more about Thailand forex brokers? Check our detailed guide-
Previously, the USD/JPY was trading in a well-developed downtrend, mostly staying below the 22-SMA. However, the decline paused when it reached the 140.01 key support level. Here, bulls took charge, making higher highs and lows. However, the new trend was shallow and corrective.
Within the bullish channel, the price has broken below the SMA, and the RSI has dipped below 50. Therefore, bears are currently stronger and could soon challenge the channel support. Given that the price is currently in a corrective move, a breakout would likely lead to an impulsive move. If bears break out of the channel, the price will fall to retest the 140.01 support level.
Looking to trade forex now? Invest at eToro!
68% of retail investor accounts lose money when trading CFDs with this provider. You should consider whether you can afford to take the high risk of losing your money.