
After the National Association of Realtors® (NAR) releases the monthly existing home sales report, I pick up additional local market data that is reported after the NAR. This is the final look at local markets in August.
There were several key stories for August:
Sales NSA are down 1.2% YoY through August, and sales last year were the lowest since 1995!
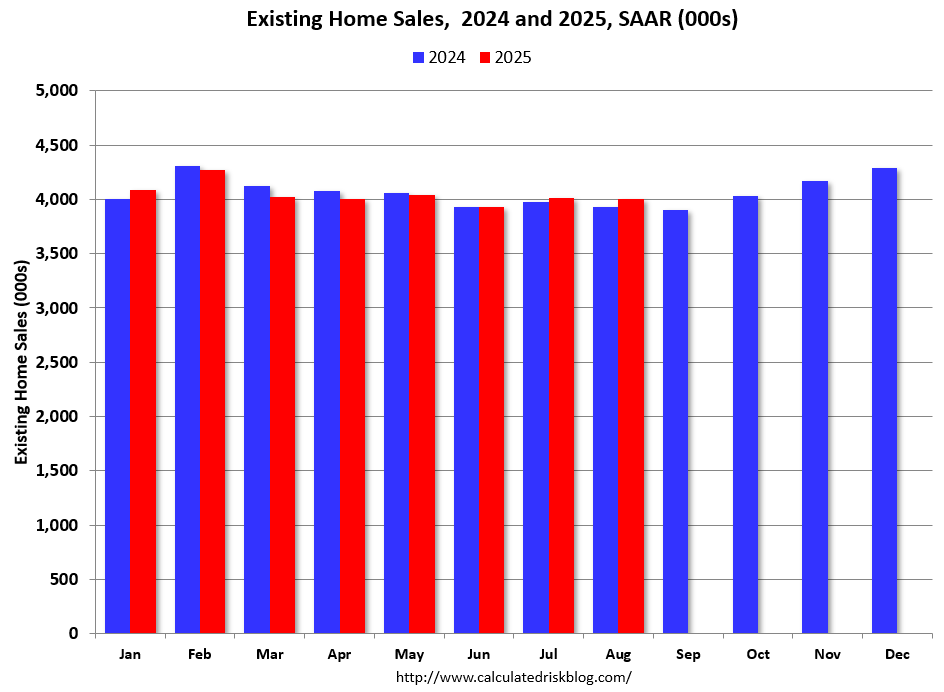
Sales SAAR (seasonally adjusted annual rate) have bounced around 4 million for the last 2 1/2 years.
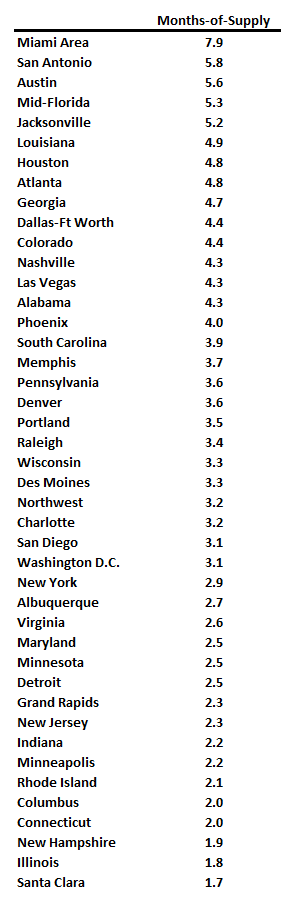
Months-of-supply is above pre-pandemic levels (this is the highest level for August since 2015).
The median price is up 2.0% YoY, and with the increases in inventory, some regional areas will see further price declines – and we might see national price declines later this year (or in 2026).
Sales at 4.00 million on a Seasonally Adjusted Annual Rate (SAAR) basis were slightly above the consensus estimate.
Sales averaged close to 5.40 million SAAR for the month of August in the 2017-2019 period. So, sales are about 26% below pre-pandemic levels.
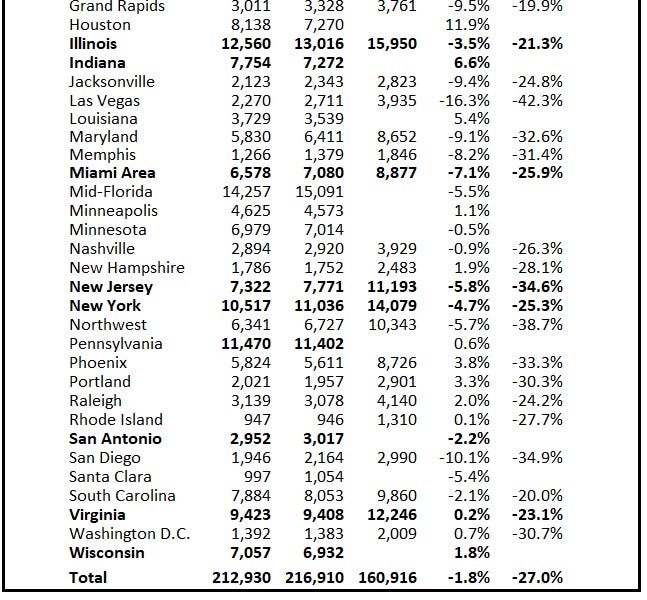
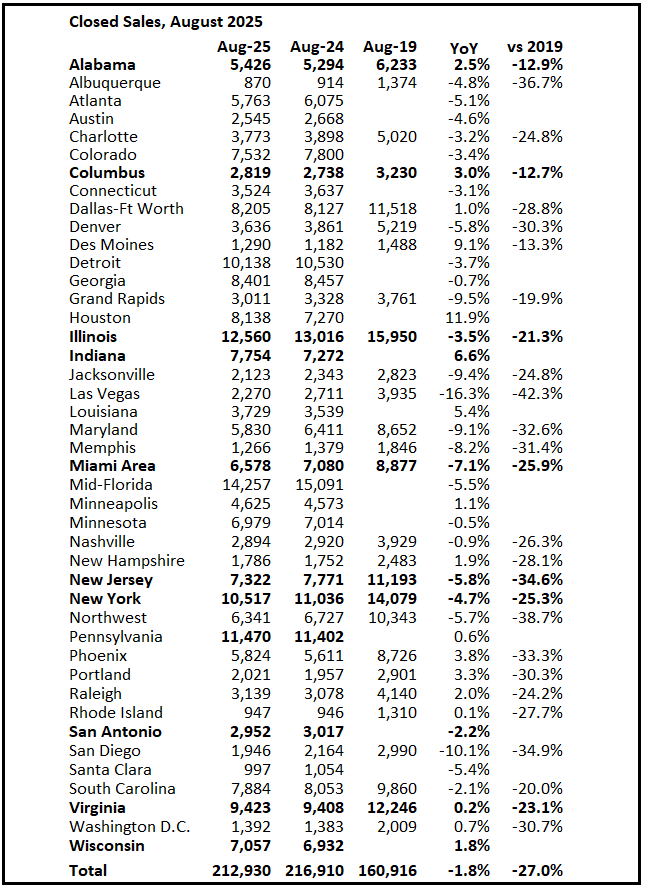
In August, sales in these markets were down 1.8% YoY. The NAR reported sales NSA were down 0.8% year-over-year in August (close).
Important: There were one fewer working days in August 2025 (21) as in August 2024 (22). So, the year-over-year change in the headline SA data was positive while the NSA data showed a decline (there are other seasonal factors).
Notes for all tables:
New additions to table in BOLD.
Northwest (Seattle), Jacksonville Source: Northeast Florida Association of REALTORS®
Totals do not include Atlanta, Denver and Minneapolis (included in state totals)
Comparison to 2019 ONLY includes local markets with available 2019 data!
For next month (September 2025 sales): There were one more working days in September 2025 (21) as in September 2024 (20). So, the year-over-year change in the headline SA data will be lower than the NSA data (there are other seasonal factors).
September sales will be mostly for contracts signed in July and August, and mortgage rates averaged 6.72% in July and 6.59% in August (somewhat lower than for closed sales in August).
My early expectation is that we will see existing home sales (SA) up in September compared to September 2024 (3.90 million SAAR – the low for 2024).
Sales were up 1.8% year-over-year compared to August 2024. Next month will also have an easy year-over-year comparison.
Total sales last year (2024) were the lowest since 1995 (lower than any year during the housing bust), so it says something that sales are tracking slightly lower in 2025!
Here is a look at months-of-supply using NSA sales.
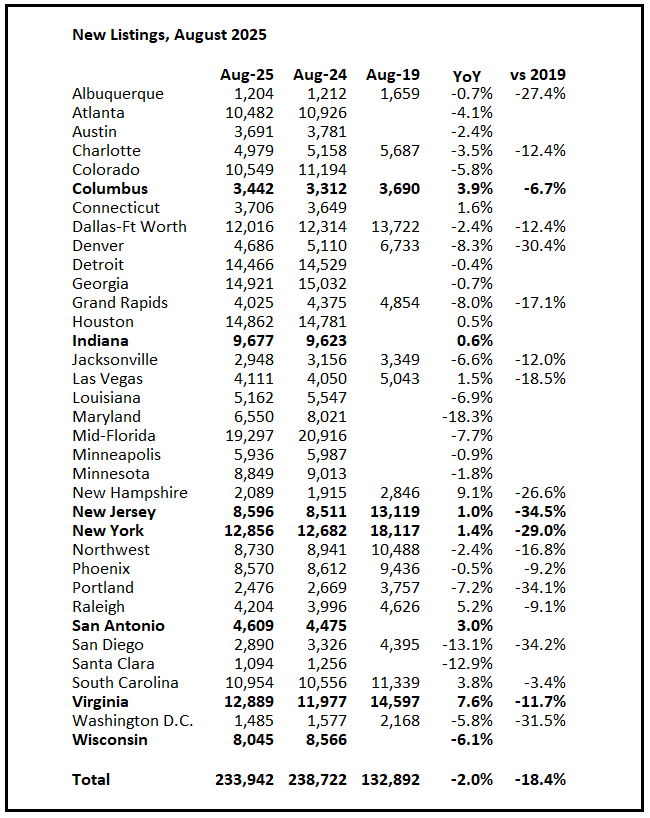
For these areas, new listings were down 2.0% year-over-year.
Last month, new listings in these markets were up 7.0% year-over-year.
New listings have slowed and are still down 18.4% compared to August 2019 activity.
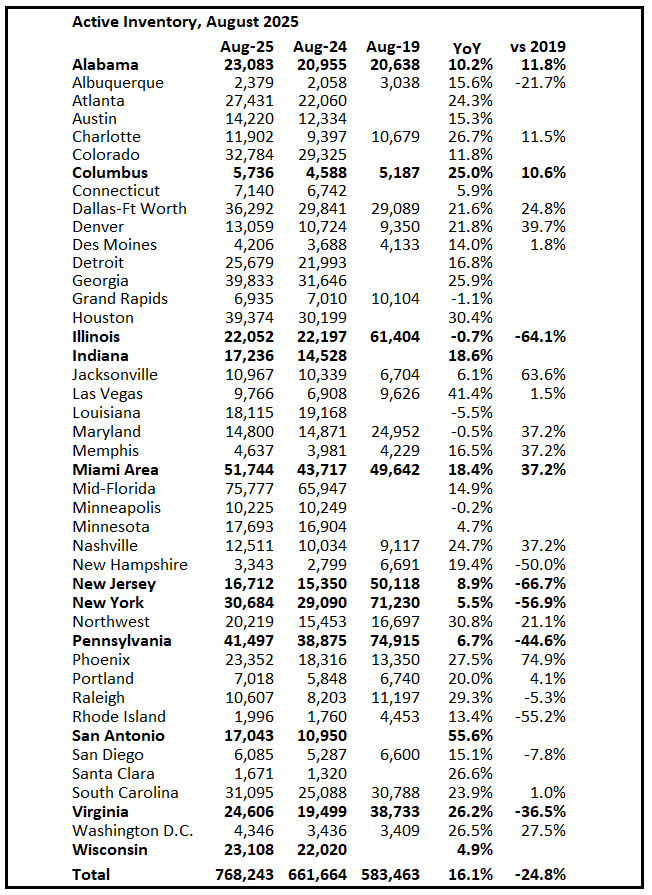
Inventory was up 16.1% year-over-year. Last month inventory in these markets was up 19.9% YoY.
Comparing to August 2019, there are significant regional differences!
More local data coming in October for activity in September!
Thanks for reading CalculatedRisk Newsletter! This post is public so feel free to share it.