
Three-dimensional analysis of presolar SiC grains
We have developed a new secondary neutral mass spectrometer (SNMS) for analyzing He with nanometer-scale resolution, called LIMAS30. LIMAS revealed the depth profile of the solar wind He implanted in the NASA Genesis target and derived the fluence spectra of the solar wind31. Here we analyzed 15 presolar SiC grains, which were aliquoted from a size-sorted fraction called KJG extracted from the Murchison carbonaceous meteorite32. The aliquot was dispersed on a gold plate using a droplet of a mix of distilled water and isopropyl alcohol (see methods, subsection ‘Sample and sample preparation’ for details). We determined, for the first time, the 3-D distribution of 4He together with 12, 13C, and 28, 29, 30Si of the individual presolar SiC grains using LIMAS to derive their depth profiles to deduce when, where, and how He was incorporated into presolar SiC grains (see methods, subsection ‘3-D helium analysis by LIMAS’ for details).
Determining stellar wind speeds from 3-D analysis
The measured 12C/13C ratios of presolar SiC grains are unimodally distributed over the range from 12 to 87 with an average of 41 (Table 1). This distribution is similar to those of mainstream SiC5, indicating that these grains likely belong to mainstream SiC. This is reasonable because about 93% of presolar SiC is accounted for by mainstream SiC5. The 3 SiC grains (A3-04, A3-09a, and A3-09b) were undetected 4He from the grains, and the 4He signals from the grain (A3-12b) were interfered with by the intense 4He signals from an adjacent SiC grain, but the other 11 grains contain 4He above our detection limit and are free of interference (Tables 1 and 2). The grain size range of this study is similar to that of Heck et al. 15. (Fig. 1). The plots of three grains (A3-01a, A3-01b, and A3-12a) overlap with those of Heck et al. The plots of the other grains in this study are below the detection limit of Heck et al. The percentage of grains with He detected (80 ± 25 (1σ) %; 11 out of 14 examined grains) is higher than the previous studies (<31%)15,27,28,29 because of a lower detection limit in this study (Fig. 1) due to mainly higher ionization efficiency by the strong field ionization30. Indeed, if we remove grains below the detection limit of Heck et al. 15, the percentage (21 ± 12 (1σ) %; 3 out of 14 examined grains; Fig. 1) is similar to each other.
Fig. 1: 4He concentrations vs. grain size for mainstream SiC from the Murchison meteorite.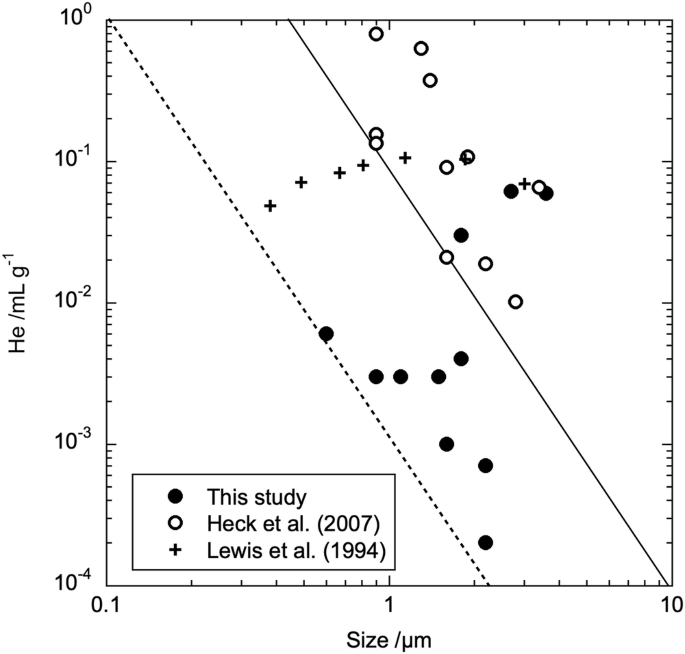
Solid line: detection limit of Heck et al. (2007)15. Dashed line: estimated detection limit of this study. Plots of Heck et al. (2007)15 (open circle) and this study (solid circle) are analyses of individual grains. Plots of Lewis et al. (1994)6 (cross) are bulk analyses of size-sorted SiC grain fractions, not of individual grains. Source data are provided as a Source Data file.
Table 1 Carbon isotope ratios and total 4He counts of SiC grain from MurchisonTable 2 4He concentration in KJG SiC grain from Murchison
Secondary electron (SE) images of individual SiC grains and their 2-D maps of 4He, 12C, and 28Si concentrations derived from the 3-D distributions are shown in Fig. 2, panels a, c, d, and b, respectively. Those of SE, 28Si, and 4He are shown in Fig. 3, panels a, d, g, j, m, and p; b, e, h, k, n, and q; and c, f, i, l, o, and r, respectively. The 4He content is highly variable between grains ranging from 0.0002 to 0.061 mL g–1 (Table 2), e.g., as shown in grains A3-12a (0.059 mL g–1), A3-12b (Low concentration, but not quantifiable due to interference), and A3-12c (0.004 mL g–1) (Fig. 2c). Furthermore, the 4He content is highly heterogeneous in the depth direction within each grain. The content is high near the surface and rapidly decreases towards the inside, reaching a level below the detection limit at a depth of about 300 nm, e.g., as shown in A3-12a (Figs. 2e–h). The helium concentration near the surface of A3-12a and A3-01a is about 0.02 atomic%, which exceeds the solubility limit in solids. These characteristics suggest that the concentration profile is generated by implantation of high-speed He into the SiC grains.
Fig. 2: Presolar SiC grains A3-12a (yellow arrow), A3-12b (blue arrow), and A3-12c (pink arrow).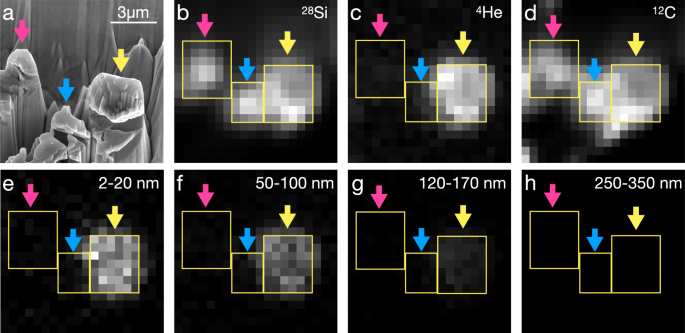
a SE image after measurement. b Integrated 28Si image for total measurement depth layers. c Integrated 4He image for total measurement depth layers. d Integrated 12C image for total measurement depth layers. e–h Averaged 4He images for measurement depth layers between 2-20, 50-100, 120-170, 250-350 nm, respectively. Grayscale tones in images (e–g) are the same. Yellow rectangles of b–h show analyzing areas of depth-profiling. Scale bar is 3 µm for all figures.
Fig. 3: Presolar SiC grains.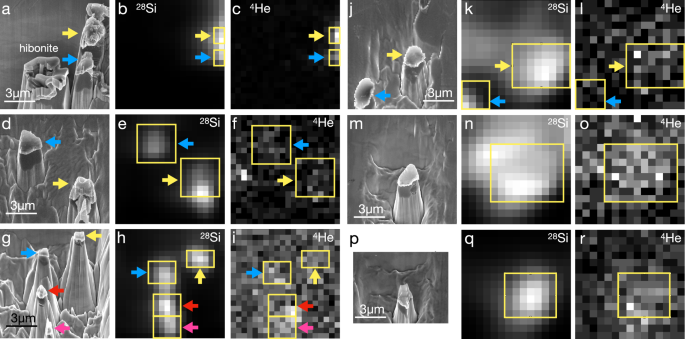
a–c A3-01a (yellow arrow) and A3-01b (blue arrow). d–f A3-02 (yellow arrow) and A3-03 (blue arrow). g–i A3-04 (yellow arrow), A3-05 (blue arrow), A3-06 (red arrow), A3-07 (pink arrow). j–l A3-09a (yellow arrow), and A3-09b (blue arrow). (m-o) A3-10. p–r A3-11. a, d, g, j, p SE image after measurement. b, e, h, k, q) Integrated 28Si image for total measurement depth layers. (c, f, i, l, r) Integrated 4He image for total measurement depth layers. Yellow rectangles show analyzing areas of depth-profiling. Scale bar is 3 µm for all figures.
The primary beam of LIMAS sputtered atoms from grain surfaces. Comparing the SE images before and after sputtering (Fig. 4), it appears that the primary ions sputtered the SiC grains from the surface almost parallel to the original surface profile. If the sputtering has been carried out to slice through the grain, the He maps should have a He-rich rim around the grain. However, the He maps for each depth layer never show such features, but are homogeneously distributed in each depth layer (Fig. 2e–h). Therefore, He was likely implanted homogeneously over the whole grain surface. The time variation of the noble gas concentration during sputtering from the whole grain area can be regarded as an implantation profile of the SiC grains in the depth direction.
Fig. 4: SE image of presolar SiC grains before and after sputtering by LIMAS.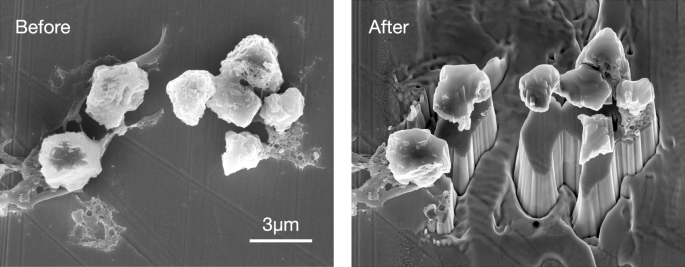
Sputtering layer thickness is estimated to be 570 nm on the SiC grains. Sputtering rate is faster for Au substrate than for SiC. The sputtering of SiC grains occurred almost parallel to the original surface profile.
For 4He detected SiC grains, the depth profiles from the grain surface are shown in Fig. 5. The 4He signals were detected down to a depth of 300 nm and became background at greater depths. For grains A3-01a, A3-01b, and A3-12a, the 4He peak appeared at a depth of 100, 50, and 100 nm, respectively (Fig. 5a). Because implanted He stops at different depths from the material surface corresponding to their kinetic energies, the peaks correspond to the implantation range of 4He33. The implantation ranges at given kinetic energies into SiC were calculated using SRIM software33 (Supplementary Fig. S1). The kinetic energy can be translated into the velocity of the stellar wind observed in astronomy. The implantation ranges of 4He for the SiC grains correspond to the kinetic energies of 7-15 keV, corresponding to velocities of 580-850 km s−1 for stellar flow, with an average of 12 keV (3 keV/nucleon) (Table 2). The energy range in this study is within the astronomically observed and theoretically estimated ranges of hot stellar wind speeds from CSPNe (about 20 to about 3000 km s–1)22,23,24,25,26, and corresponds to stellar temperatures of 30-50 kK. Therefore, it is plausible that the 4He in the presolar SiC grains is predominantly implanted by the CSPN winds and therefore He-G, supporting the suggestions of previous isotopic studies6,15,34.
Fig. 5: Depth profiles of 4He into presolar SiC grains.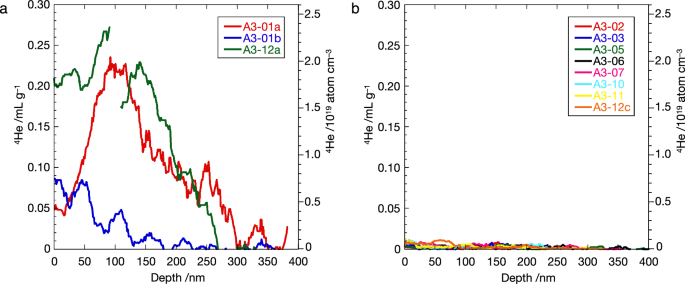
a Grains with high 4He contents. A3-01a (red), A3-01b (blue), and A3-12a (green). b Grains with low 4He contents. A3-02 (red), A3-03 (blue), A3-05 (green), A3-06 (black), A3-07 (pink), A3-10 (light blue), A3-11 (yellow), and A3-12c (orange). The individual depth profiles for each grain can be found in Supplementary Figs. S2–S9. The jagged wiggles in the curves are measurement uncertainties caused by instrumental instabilities. Source data are provided as a Source Data file.
In order to simply interpret a relationship between the various size fractions of the SiC grains and their noble gas concentrations among the fractions, an implantation energy of about 50 keV/nucleon has been suggested for the SiC presolar grains16. This energy is close to the speed of the fastest CSPN wind26. However, the helium implanted in SiC grains with about 50 keV/nucleon (corresponding to a stellar wind speed of about 3000 km s–1 and an implantation range of about 700 nm deep) has not been detected in this study. Instead, this study shows that the implantation energies into the SiC grains are variable. This result is robust because the depth profile is directly correlated with the implantation energy, and the SiC grains used in this study were collected from the size-sorted fraction KJG.
The relationships between the grain size of mainstream presolar SiC and its 4He content (Heck et al.15 and this study) are compared with those between the size-sorted SiC fraction and its 4He content (Lewis et al. 6)(Fig. 1). Large variations of more than two orders of magnitude in He concentration are observed among grains of similar size. Such large variation is consistent with evidence showing that gas-rich grains (about 4% fraction of the SiC in KJG) accounted for more than 90% of the gas concentration measured in aggregates of millions of grains27,28. In laboratory analyses where individual particles were analyzed, a significant number of particles below the detection limit of 4He were counted; about 70% of the total number of grains analyzed in Heck et al. 15, about 20% in this study. As a result, the values of the size-sorted bulk samples6 are plotted on the upper side, and it is difficult to represent implantation energy with a single value. However, this discussion cannot rule out the existence of SiC grains that have been implanted with He at high energies, such as about 50 keV/nucleon. For example, such high implantation energy travels implanted 4He a great distance of about 1 µm and stops. If this implantation occurred for 1-µm-sized SiC grains, the helium would stop near the grain surface on the opposite side of the implantation. We have depth profiling results from three SiC grains (A3-05, A3-06, and A3-07) that are 1 µm or slightly smaller in size and may be applicable in this case (Fig. 5b). However, it is strange that such high-energy implantations have not been observed for larger SiC grains. Further study is required to investigate the real distribution of the implantation energy into SiC grains for more precise discussions.
Artificial peak broadening would have occurred because the sputtering was not exactly parallel to the original surface profiles due to the surface irregularities of each grain. Therefore, it is difficult to assign 4He peaks for grains with low 4He concentrations even if they also have 4He peaks at a depth of 50–100 nm. In the results, for other grains, weak 4He signals appeared at depths shallower than 300 nm with no clear peaks (Fig. 5b).
On the other hand, stellar wind velocities for AGB stars are less than 40 km s−1 18,19,20,21. The kinetic energy of the AGB 4He wind is calculated to be less than 0.05 keV, and the implantation range into SiC is less than 1 nm (Supplementary Fig. S1), which is much smaller than the depth resolution of the LIMAS analysis. Therefore, the 4He signal at the grain surface would be mainly contributed by the He-G, but might be due to a small contribution of implanted thermal and suprathermal components of the AGB stellar winds. This also corroborates previous isotopic studies6,15 that concluded the He-G component comprised over 95% of the measured stellar gas in mainstream SiC grains.
History of presolar SiC formation
The fluences of the presolar SiC grains calculated from the depth profiles are variable, ranging from 6.4 × 10¹¹ to 3.1 × 10¹⁴ 4He cm−2 (Table 2). Typical mass-loss rate of CSPNe for 30-50 kK is about 5 × 10⁻⁹ M⨀ y−1 22,23,24,35,3, and the typical period of CSPNe is about 5000 y17. The He implantation into the presolar grain was continued during this period. The chemical composition of CSPN wind is very diverse, ranging from H-deficient (He-rich) to H-rich (solar-like)17. We therefore performed our calculations assuming two endmembers: one with a 100 mass% proportion of He in the total mass-loss atoms (He-rich) and one with a 30 mass% proportion (solar-like). The latter is derived from the solar abundance37. Using the 4He fluences in this study and these two endmembers, the sites of presolar SiC grains at the end of the CSPNe phase, where noble gas was implanted, are calculated to be 0.8–32 ly from the CSPNe (Table 2 and see methods, subsection ‘CSPN wind irradiation and formation age of SiC’ for details). The sites for SiC grains of top three fluences (Fig. 5a), distances of 0.8–2.9 ly from the CSPNe, are roughly consistent with the radii of planetary nebulae in the Galaxy (less than 5 ly for the vast majority38), e.g., Ring Nebula (M57) and Helix Nebula (NGC 7293)39,40, suggesting that the implantation events occurred in planetary nebulae.
Since the grains in the circumstellar envelopes and the planetary nebulae expand with the gas, the time periods that the grains have moved from the formation site, which is close to the AGB star, to the site at the end of the CSPNe phase can be calculated using the expansion velocity of the circumstellar envelope (see methods, subsection ‘CSPN wind irradiation and formation age of SiC’ for details). We refer to this period as the formation age of the presolar SiC grains anchored by the CSPNe phase of stellar evolution, i.e., time = 0 is at the end of the CSPNe phase. We also applied this method to calculate the formation ages of the mainstream SiC grains measured by Heck et al. 15. The formation ages of the mainstream SiC grains (Tables 2 and 3) are spread over the last about 1 My period of the AGB star phase of stellar evolution (Fig. 6). A closer inspection shows that the Murray grains15 formed at the very end of the AGB phase followed by the Murchison grains by the same authors15. Some of our Murchison grains also formed at the end of the AGB phase, but other grains formed much earlier in the AGB phase (Fig. 6). The locations of the noble gas implantation sites for individual SiC grains and their formation ages are derived in the case of typical CSPNe and AGB stars. Since the parameters are variable among individual CSPNe and the stellar evolution stages, the relative errors are estimated to be approximately 100% for the implantation sites and the formation ages, with a minimum resolution of about 0.5 ly for the site and 5 ky for the age (see methods, subsection ‘CSPN wind irradiation and formation age of SiC’ for details).
Fig. 6: Histogram of formation age of mainstream presolar SiC grains.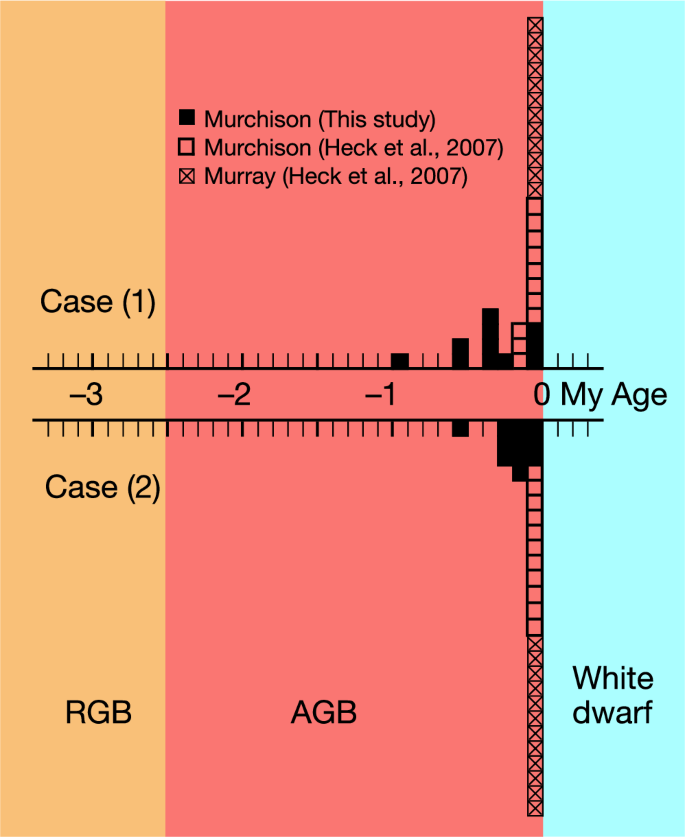
The age=0 is anchored by the CSPNe phase of stellar evolution. The SiC grains continued to form during the last 1 My period of the AGB star phase of stellar evolution. The periods of stellar evolutionary phases are from Herwig (2005)17. Data from Tables 2 and 3 are plotted. Solid square (from Murchison of this study), open square (from Murchison of Heck et al.15, 2007), and crossed square (from Murray of Heck et al.15, 2007). Case (1): 100 mass% He flux during 5000 yr; Case (2): 30 mass% He flux during 5000 yr.
Table 3 4He concentration of mainstream SiC grain from Murchison and Murray (after Heck et al.15, 2007)
This argument of formation ages derived from the noble gas data is also consistent with the 12C/13C ratios of the presolar grains. The 12C/13C ratios are in the range of 10–35 for the O-rich envelopes of AGB stars, while they are ∼25–90 for the C-rich envelopes41,42. Due to the 12C that is dredged-up during the AGB phase, the 12C/13C ratio of the envelope increases as a star evolves17. In general, the grains with higher 12C/13C ratios formed in the later stage of the AGB phase than those with lower 12C/13C ratios. The mean isotopic ratios of the Murchison grains in this study, the Murchison grains of Heck et al. 15, and the Murray grains15 is 40.5 (Table 1), 60.0 (Tables 3), and 65.8 (Table 3), respectively. Changes in these three 12C/13C ratios would be related to the stellar evolution of AGB stars in this order. Therefore, the formation ages of the three sets of grains derived from their noble gas data are consistent with the scenario inferred from the 12C/13C ratios of the grains, indicating that our methods and conclusions are valid.
The stellar wind evidence obtained in this study reveals the formation history of individual mainstream SiC grains. AGB stars appear to have continued to form SiC grains at least during their late stages. We found evidence that the helium in the presolar SiC grains was from the CSPN hot winds. The sites where the CSPN hot wind implantation has occurred range from 0.3 to 32 ly from the center of the planetary nebula, corresponding to the formation ages ranging from 0.95 to 0.01 My before the end of CSPNe. The derived new approach can also be applied to all presolar grains other than SiC, shedding light on the origin and history of circumstellar dusts formed by various types of stars.