
Last updated:
27 Oct. 2025
Ten years after the Paris Agreement was endorsed by nearly 200 countries, the world is in a markedly different place. A decade ago, the world was heading for around 4°C of heating by 2100; today, that projection is closer to 2.6°C.
This shift reflects an extraordinary surge in clean energy deployment, stronger policy frameworks and the mainstreaming of net zero as a common global goal to tackle climate change. More progress is still needed, but progress there has been.
Drawing on original ECIU analysis alongside third-party data, this report assesses progress across clean energy deployment and investment, emissions trends, electric vehicle (EV) uptake, and the integration of climate policy and standards into the global economy. Together, these indicators show that the Paris Agreement has had a transformative global impact.
It finds that:
● In 2015, BP’s Energy Outlook predicted that the global non-fossil share of power generation would rise modestly from 32% that year to 38% by the end of its forecast period in 2035. By 2024 non-fossil generation already accounted for over 41% of the global power supply – making more progress in 10 years than was predicted over 20.
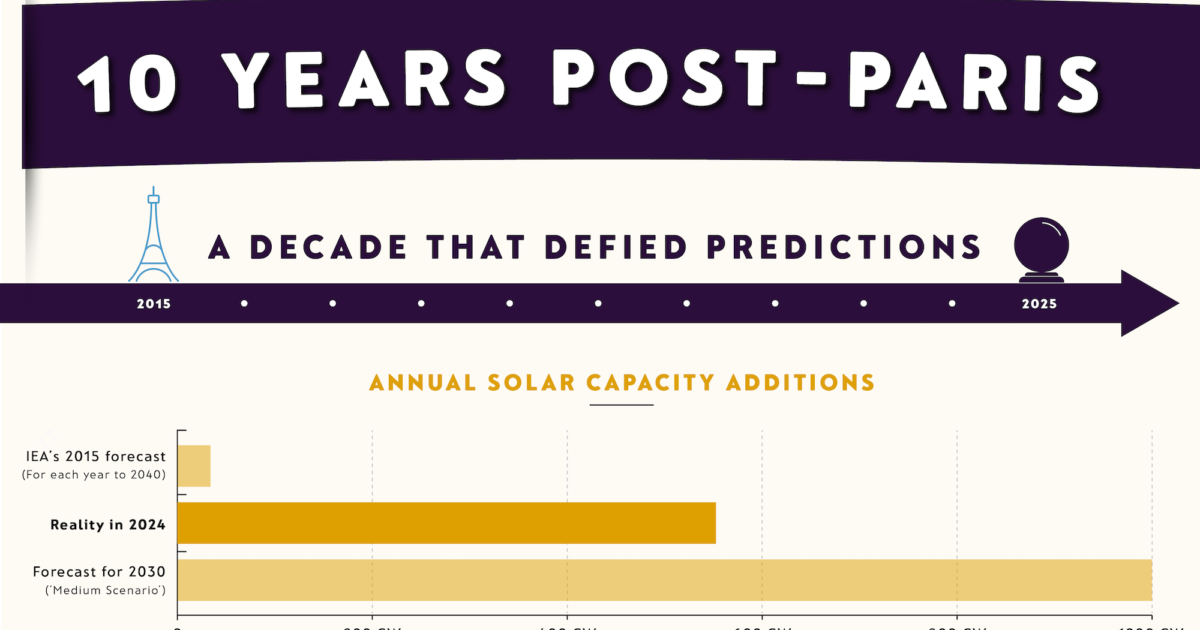
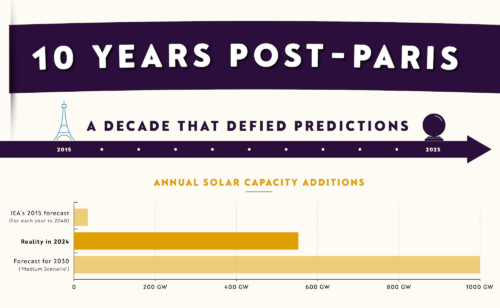
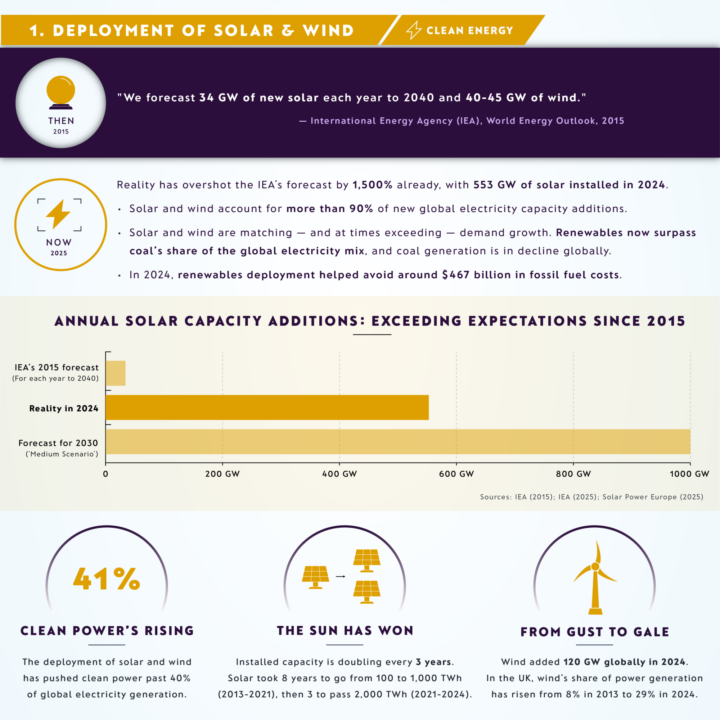
● Solar and wind have hugely exceeded expectations: the world installed 553 GW of solar in 2024 alone, overshooting 2015 International Energy Agency (IEA) forecasts by more than 1,500%. Total global solar capacity is over four times what was predicted in 2015, and doubling every three years. Renewables have just taken over coal as the biggest source of electricity generation.
● EVs have exceeded expectations: 2024 EV deployment is already 40% above the IEA ’s 2015 projections, and on track to be 66% higher by 2030. The Paris declaration target of 100 million EVs on the road by 2030 is on target to be hit as soon as 2027.
Other key findings:
● In the 10 years before the Paris agreement was signed, fossil fuel generation met 68% of global electricity demand growth. In the decade since, global electricity demand has grown faster than ever before, but renewables have met 67% of the increase in demand, and the trend is accelerating. (Recent analysis even has renewables outpacing global electricity demand growth in the first half of 2025.)
● Clean energy investment will reach $2.2 trillion in 2025, double the spend on fossil fuels, with solar PV investment exceeding all other power generation combined. The ‘big four’ energy geographies (China, the US, EU and India) account for 62% of global energy investment and here the trend is even stronger, with clean energy investment outpacing fossil fuel investment at a rate of $2.6 for every $1, more than double what it was in 2015.
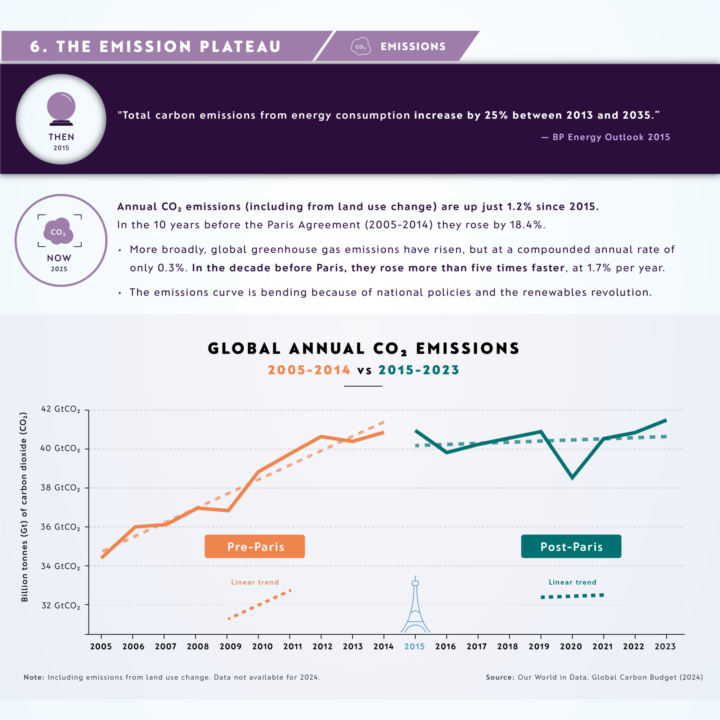
● Global CO2 emissions have plateaued: since 2015, annual CO₂ emissions (including from land use change) are up just 1.2%, compared with 18.4% in the decade before Paris. In the decade before Paris (2005–2014), global greenhouse gas emissions rose at 1.70% per year; since the Paris Agreement (2015-2023, that annual increase has slowed to just 0.32 % — a five-fold drop in growth rate.
● EV rollout is increasingly displacing fossil fuel use: global market share of new sales passed 20% in 2024, and is on track for 40% by 2030, over 10 years ahead of the IEA ’s 2015 forecast and already avoids about 1.8 million barrels a day of oil demand.
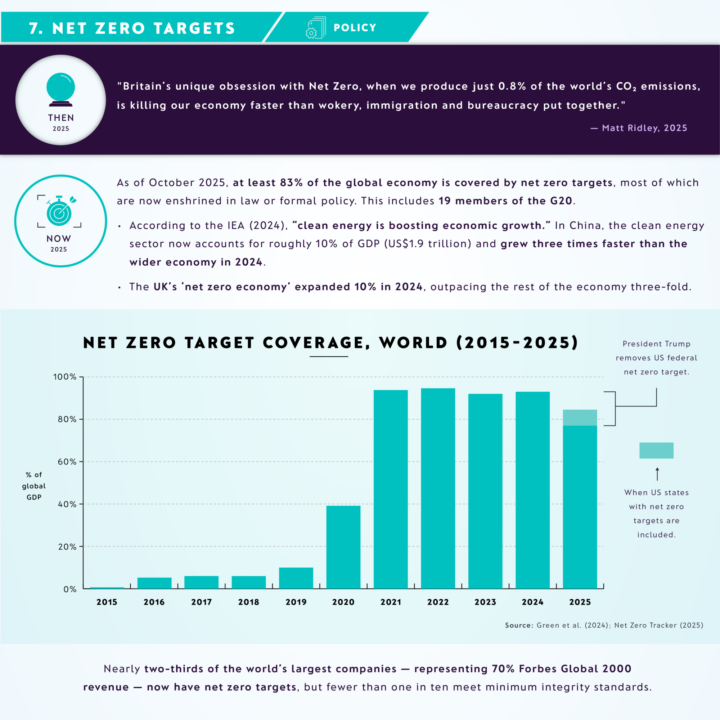
● Climate policy has matured: framework climate laws have more than tripled since 2015; national climate policy tools are up seven-fold, and at least 83% of the global economy remains covered by net zero targets including 19 G20 members, despite the US federal retreat from climate policy under President Trump.
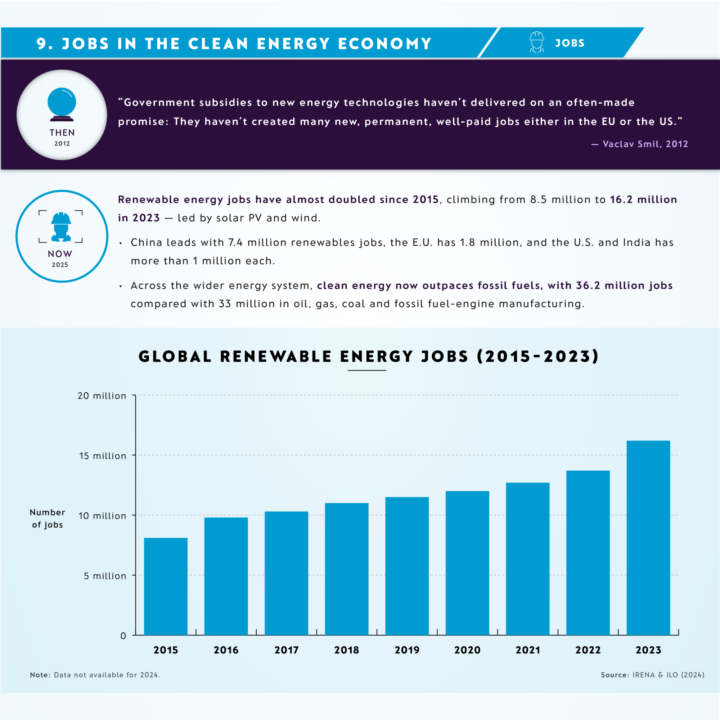
● Growth in clean energy jobs: clean-energy jobs (36.2 million) now outnumber those in oil, gas and coal and fossil-engine manufacturing (32.1 million). Renewables jobs almost doubled from 8.5 million in 2015 to 16.2 million in 2023.
Meanwhile, the UK has walked the talk — cutting its greenhouse gas emissions by 53% between 1990 and 2023, while growing its economy by 82%. In 2024, renewables contributed more electricity to the UK grid than fossil fuels for the first time. And in 2024, the UK arrived at COP29 with an early and bold new carbon-cutting nationally determined contribution (NDC) to reduce emissions by at least 81% by 2035.
The past decade has shown that technology, ambition and governance can shift faster than anyone thought possible. Progress, while still deeply uneven, is now measurable and irrefutable.
Ten years post-Paris, the direction of travel is clear: the clean-energy transition is more advanced than analysts projected a decade ago — and more advanced than many citizens realise. The challenge now is to turn this real-economy momentum into a decisive structural bend in the global emissions curve, while scaling up finance and technology flows — especially for developing economies — and ensuring the benefits are felt by communities and people everywhere.
COP30 in Belém — where all countries are expected to have submitted new emissions-cutting nationally determined contributions — offers a pivotal opportunity to consolidate this progress in the face of US intransigence. If it can deliver on its goals — reinforcing multilateralism, ratcheting up mitigation ambition and investing in nature — it can lay the groundwork for the next great leap in global climate ambition over the coming decade.
Lead author John Lang also created an infographic contrasting the then — near-Paris expectations and commentary — with the now — today’s outcomes.
View it here: 10 Years Post-Paris Infographic: A decade that defied predictions.