
Dec 14, 2025
IndexBox has just published a new report: United Kingdom – Ferro-Alloys – Market Analysis, Forecast, Size, Trends And Insights.
The UK ferro-alloys market, valued at $428M in 2024, is forecast to grow slightly with a volume CAGR of +0.8% through 2035. Consumption is led by ferro-chromium, miscellaneous ferro-alloys, and ferro-manganese, while domestic production is focused on high-value ferro-molybdenum. The UK is a net importer, sourcing mainly from South Africa, Norway, and Indonesia, and is a significant exporter of high-value ferro-molybdenum, primarily to the Netherlands and Germany. Market dynamics show a shift towards higher-value products, with ferro-molybdenum driving both import and export values despite overall flat volume trends.
Key Findings
UK market forecast for slow growth with a +0.8% volume CAGR to 192K tons and a +0.5% value CAGR to $454M by 2035Domestic production is volatile and focused on high-value ferro-molybdenum, which dominates export valueThe UK is heavily import-dependent, with South Africa, Norway, and Indonesia as key suppliers by volumeFerro-molybdenum is the highest-value product, driving both import growth and commanding premium export pricesExport volumes are declining but remain high-value, with the Netherlands as the top destination by revenueMarket Forecast
Driven by rising demand for ferro-alloys in the UK, the market is expected to start an upward consumption trend over the next decade. The performance of the market is forecast to increase slightly, with an anticipated CAGR of +0.8% for the period from 2024 to 2035, which is projected to bring the market volume to 192K tons by the end of 2035.
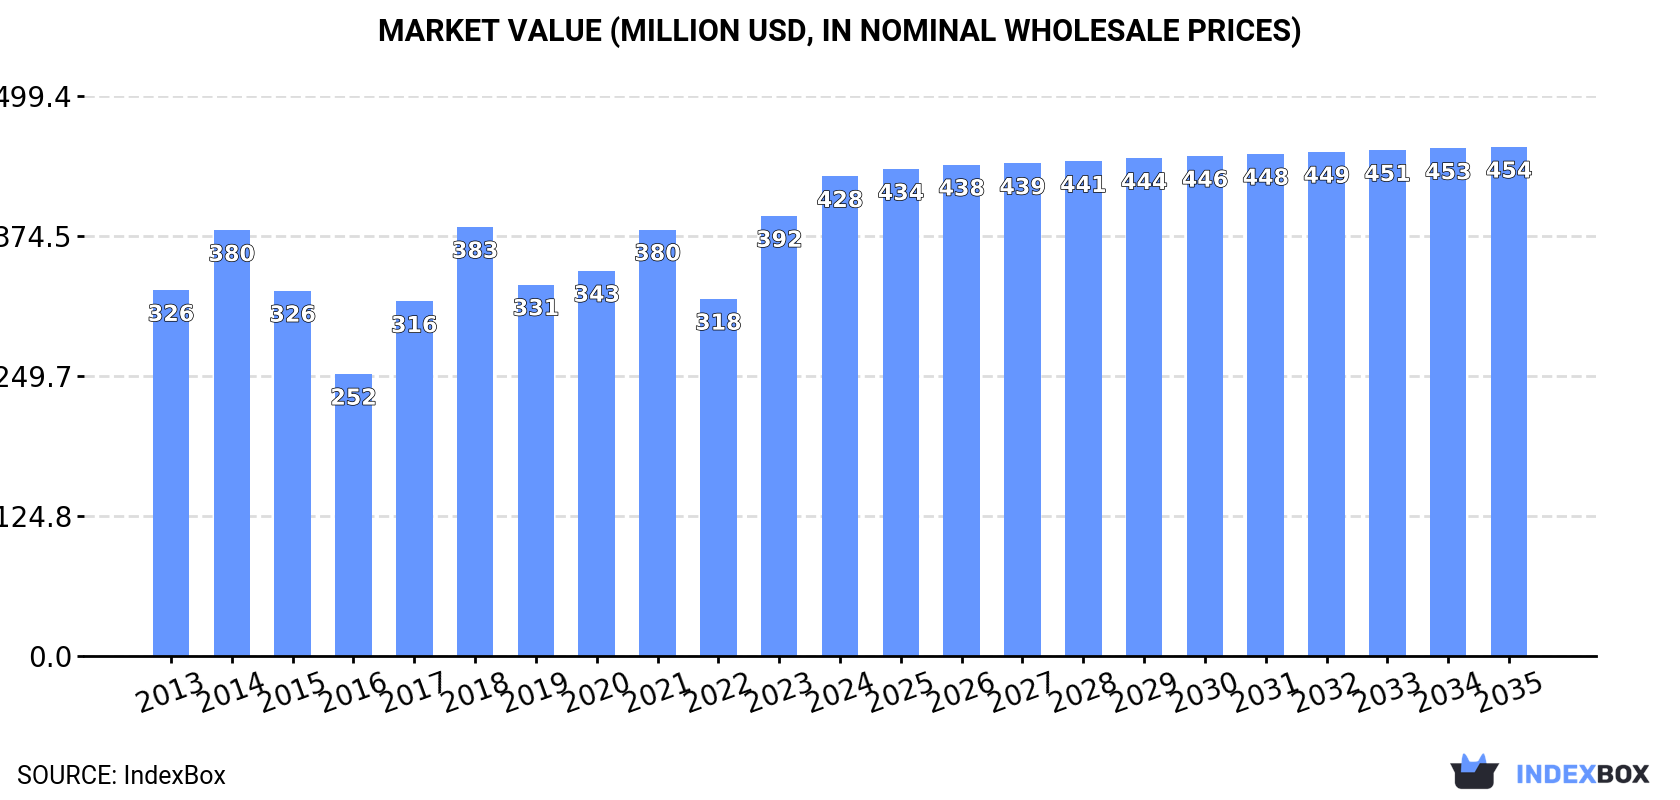
In value terms, the market is forecast to increase with an anticipated CAGR of +0.5% for the period from 2024 to 2035, which is projected to bring the market value to $454M (in nominal wholesale prices) by the end of 2035.
 ConsumptionUnited Kingdom’s Consumption of Ferro-Alloys
In 2024, approx. 175K tons of ferro-alloys were consumed in the UK; growing by 5.4% against the previous year’s figure. In general, consumption, however, showed a relatively flat trend pattern. Over the period under review, consumption reached the peak volume at 197K tons in 2014; however, from 2015 to 2024, consumption stood at a somewhat lower figure.
The size of the ferro-alloys market in the UK amounted to $428M in 2024, growing by 9% against the previous year. This figure reflects the total revenues of producers and importers (excluding logistics costs, retail marketing costs, and retailers’ margins, which will be included in the final consumer price). The market value increased at an average annual rate of +2.5% from 2013 to 2024; the trend pattern indicated some noticeable fluctuations being recorded throughout the analyzed period. Over the period under review, the market hit record highs in 2024 and is likely to see gradual growth in years to come.
Consumption By Type
Ferro-chromium (53K tons), miscellaneous ferro-alloys (40K tons) and ferro-manganese (31K tons) were the main products of ferro-alloys consumption in the UK, together comprising 70% of the total volume. Ferro-silico-manganese, ferro-silicon, ferro-molybdenum and ferro-titanium and ferro-silico-titanium lagged somewhat behind, together comprising a further 30%.
From 2013 to 2024, the biggest increases were recorded for ferro-molybdenum (with a CAGR of +17.5%), while consumption for the other products experienced more modest paces of growth.
In value terms, ferro-alloys with the largest market size in the UK were ferro-molybdenum ($177M), ferro-chromium ($89M) and miscellaneous ferro-alloys ($71M), together accounting for 79% of the total market.
Ferro-molybdenum, with a CAGR of +19.5%, saw the highest rates of growth with regard to market size in terms of the main consumed products over the period under review, while market for the other products experienced more modest paces of growth.
ProductionUnited Kingdom’s Production of Ferro-Alloys
In 2024, the amount of ferro-alloys produced in the UK shrank to 44K tons, waning by -7.4% against the previous year. In general, the total production indicated mild growth from 2013 to 2024: its volume increased at an average annual rate of +1.7% over the last eleven years. The trend pattern, however, indicated some noticeable fluctuations being recorded throughout the analyzed period. Based on 2024 figures, production decreased by -19.2% against 2021 indices. The growth pace was the most rapid in 2021 when the production volume increased by 105% against the previous year. As a result, production attained the peak volume of 55K tons. From 2022 to 2024, production growth failed to regain momentum.
In value terms, ferro-alloys production contracted dramatically to $525M in 2024 estimated in export price. Over the period under review, production, however, posted a measured expansion. The growth pace was the most rapid in 2021 with an increase of 157%. Ferro-alloys production peaked at $625M in 2023, and then declined dramatically in the following year.
Production By Type
Ferro-manganese (17K tons), ferro-molybdenum (14K tons) and ferro-titanium and ferro-silico-titanium (13K tons) were the main products of ferro-alloys production in the UK.
From 2013 to 2024, the most notable rate of growth in terms of production, amongst the leading produced products, was attained by ferro-manganese (with a CAGR of +355.0%), while production for the other products experienced mixed trend patterns.
In value terms, ferro-molybdenum ($403M) led the market, alone. The second position in the ranking was held by ferro-titanium and ferro-silico-titanium ($60M).
From 2013 to 2024, the average annual rate of growth in terms of the value of ferro-molybdenum production stood at +2.9%. With regard to the other produced products, the following average annual rates of growth were recorded: ferro-titanium and ferro-silico-titanium (-5.2% per year) and ferro-manganese (+349.4% per year).
ImportsUnited Kingdom’s Imports of Ferro-Alloys
In 2024, overseas purchases of ferro-alloys were finally on the rise to reach 153K tons for the first time since 2021, thus ending a two-year declining trend. Overall, imports, however, saw a perceptible decline. The most prominent rate of growth was recorded in 2017 when imports increased by 9.7%. Imports peaked at 220K tons in 2014; however, from 2015 to 2024, imports stood at a somewhat lower figure.
In value terms, ferro-alloys imports shrank to $319M in 2024. In general, imports, however, recorded a relatively flat trend pattern. The pace of growth appeared the most rapid in 2021 when imports increased by 62%. Imports peaked at $408M in 2022; however, from 2023 to 2024, imports remained at a lower figure.
Imports By Country
South Africa (39K tons), Norway (28K tons) and Indonesia (26K tons) were the main suppliers of ferro-alloys imports to the UK, together comprising 61% of total imports.
From 2013 to 2024, the most notable rate of growth in terms of purchases, amongst the main suppliers, was attained by South Africa (with a CAGR of +36.1%), while imports for the other leaders experienced more modest paces of growth.
In value terms, South Africa ($45M), Norway ($41M) and Indonesia ($39M) were the largest ferro-alloys suppliers to the UK, together comprising 39% of total imports. Brazil, India, France, Kazakhstan, Finland, the Netherlands, Georgia, Ukraine, Malaysia and Spain lagged somewhat behind, together comprising a further 30%.
Kazakhstan, with a CAGR of +41.7%, recorded the highest rates of growth with regard to the value of imports, in terms of the main suppliers over the period under review, while purchases for the other leaders experienced more modest paces of growth.
Imports By Type
Ferro-chromium (55K tons), miscellaneous ferro-alloys (40K tons) and ferro-silico-manganese (25K tons) were the main products of ferro-alloys imports to the UK, with a combined 78% share of total imports.
From 2013 to 2024, the most notable rate of growth in terms of purchases, amongst the major product types, was attained by ferro-chromium (with a CAGR of +5.5%), while imports for the other products experienced more modest paces of growth.
In value terms, miscellaneous ferro-alloys ($138M), ferro-chromium ($88M) and ferro-silico-manganese ($32M) were the most imported types of ferro-alloys in the UK, with a combined 81% share of total imports. Ferro-silicon, ferro-manganese, ferro-molybdenum and ferro-titanium and ferro-silico-titanium lagged somewhat behind, together comprising a further 19%.
Ferro-molybdenum, with a CAGR of +9.5%, saw the highest growth rate of the value of imports, among the main product categories over the period under review, while purchases for the other products experienced more modest paces of growth.
Import Prices By Type
The average ferro-alloys import price stood at $2,093 per ton in 2024, dropping by -17.6% against the previous year. Over the period under review, the import price, however, saw a moderate increase. The most prominent rate of growth was recorded in 2021 an increase of 55%. Over the period under review, average import prices reached the peak figure at $2,822 per ton in 2022; however, from 2023 to 2024, import prices remained at a lower figure.
Prices varied noticeably by the product type; the product with the highest price was ferro-molybdenum ($34,053 per ton), while the price for ferro-silico-manganese ($1,286 per ton) was amongst the lowest.
From 2013 to 2024, the most notable rate of growth in terms of prices was attained by ferro-molybdenum (+5.8%), while the prices for the other products experienced more modest paces of growth.
Import Prices By Country
The average ferro-alloys import price stood at $2,093 per ton in 2024, dropping by -17.6% against the previous year. In general, the import price, however, recorded temperate growth. The pace of growth appeared the most rapid in 2021 when the average import price increased by 55% against the previous year. Over the period under review, average import prices reached the maximum at $2,822 per ton in 2022; however, from 2023 to 2024, import prices failed to regain momentum.
There were significant differences in the average prices amongst the major supplying countries. In 2024, amid the top importers, the country with the highest price was Brazil ($6,693 per ton), while the price for Malaysia ($944 per ton) was amongst the lowest.
From 2013 to 2024, the most notable rate of growth in terms of prices was attained by Spain (+7.1%), while the prices for the other major suppliers experienced more modest paces of growth.
ExportsUnited Kingdom’s Exports of Ferro-Alloys
For the seventh consecutive year, the UK recorded decline in overseas shipments of ferro-alloys, which decreased by -3.2% to 22K tons in 2024. Over the period under review, exports recorded a deep setback. The most prominent rate of growth was recorded in 2017 when exports increased by 13% against the previous year. Over the period under review, the exports hit record highs at 60K tons in 2014; however, from 2015 to 2024, the exports stood at a somewhat lower figure.
In value terms, ferro-alloys exports fell significantly to $331M in 2024. In general, exports showed a slight decrease. The pace of growth was the most pronounced in 2021 when exports increased by 105%. The exports peaked at $414M in 2023, and then shrank notably in the following year.
Exports By Country
The Netherlands (5.6K tons), Germany (3.1K tons) and Japan (2.9K tons) were the main destinations of ferro-alloys exports from the UK, together comprising 53% of total exports. South Korea, Sweden, Spain, the United States, Greece, Turkey, Poland, Italy, France and Belgium lagged somewhat behind, together accounting for a further 37%.
From 2013 to 2024, the biggest increases were recorded for Turkey (with a CAGR of +16.2%), while shipments for the other leaders experienced more modest paces of growth.
In value terms, the Netherlands ($126M) remains the key foreign market for ferro-alloys exports from the UK, comprising 38% of total exports. The second position in the ranking was held by Germany ($55M), with a 17% share of total exports. It was followed by Spain, with a 12% share.
From 2013 to 2024, the average annual growth rate of value to the Netherlands amounted to +9.0%. Exports to the other major destinations recorded the following average annual rates of exports growth: Germany (-3.0% per year) and Spain (-0.1% per year).
Exports By Type
Ferro-titanium and ferro-silico-titanium (9.9K tons), ferro-molybdenum (7.9K tons) and ferro-chromium (1.8K tons) were the main products of ferro-alloys exports from the UK, with a combined 90% share of total exports.
From 2013 to 2024, the biggest increases were recorded for ferro-chromium (with a CAGR of -3.8%), while shipments for the other products experienced a decline.
In value terms, ferro-molybdenum ($273M) remains the largest type of ferro-alloys exported from the UK, comprising 82% of total exports. The second position in the ranking was held by ferro-titanium and ferro-silico-titanium ($45M), with a 14% share of total exports. It was followed by ferro-chromium, with a 1.7% share.
From 2013 to 2024, the average annual growth rate of the value of ferro-molybdenum exports stood at +1.7%. With regard to the other exported products, the following average annual rates of growth were recorded: ferro-titanium and ferro-silico-titanium (-7.4% per year) and ferro-chromium (-2.7% per year).
Export Prices By Type
The average ferro-alloys export price stood at $15,286 per ton in 2024, falling by -17.4% against the previous year. Overall, the export price, however, posted resilient growth. The most prominent rate of growth was recorded in 2021 an increase of 108% against the previous year. Over the period under review, the average export prices attained the maximum at $18,498 per ton in 2023, and then contracted significantly in the following year.
There were significant differences in the average prices for the major types of exported product. In 2024, the product with the highest price was ferro-molybdenum ($34,452 per ton), while the average price for exports of ferro-silico-manganese ($840 per ton) was amongst the lowest.
From 2013 to 2024, the most notable rate of growth in terms of prices was recorded for the following types: ferro-silico-manganese (+7.1%), while the prices for the other products experienced more modest paces of growth.
Export Prices By Country
In 2024, the average ferro-alloys export price amounted to $15,286 per ton, with a decrease of -17.4% against the previous year. Over the period under review, the export price, however, continues to indicate strong growth. The most prominent rate of growth was recorded in 2021 when the average export price increased by 108% against the previous year. The export price peaked at $18,498 per ton in 2023, and then shrank dramatically in the following year.
There were significant differences in the average prices for the major export markets. In 2024, amid the top suppliers, the country with the highest price was Italy ($33,710 per ton), while the average price for exports to Greece ($2,543 per ton) was amongst the lowest.
From 2013 to 2024, the most notable rate of growth in terms of prices was recorded for supplies to the Netherlands (+20.4%), while the prices for the other major destinations experienced more modest paces of growth.