
Feb 22, 2026
IndexBox has just published a new report: United Kingdom – Spherical Roller Bearings – Market Analysis, Forecast, Size, Trends And Insights.
The UK spherical roller bearing market saw significant growth in 2024, with consumption surging 73% to 4K tons and revenue jumping 108% to $138M. Domestic production increased to 4.3K tons. While imports fell to 1.1K tons, export volume declined sharply to 1.4K tons. The market is forecast to grow at a decelerating pace, with volume projected to reach 4.9K tons (CAGR +1.9%) and value to hit $200M (CAGR +3.4%) by 2035. Globally, Thailand and Belgium are leading importers, while China, Germany, and Sweden are top exporters.
Key Findings
UK market consumption surged 73% to 4K tons in 2024, with revenue up 108% to $138MMarket forecast to 2035 projects decelerating growth to 4.9K tons volume (CAGR +1.9%) and $200M value (CAGR +3.4%)UK imports declined by 24% to 1.1K tons in 2024, while exports fell sharply by 56.5% to 1.4K tonsGlobal import leaders are Thailand and Belgium, while China, Germany, and Sweden dominate exportsUK export price rose 30% to $37,877 per ton, significantly higher than the global low of Thailand at $3,253 per tonMarket Forecast
Driven by increasing demand for spherical roller bearings in the UK, the market is expected to continue an upward consumption trend over the next decade. Market performance is forecast to decelerate, expanding with an anticipated CAGR of +1.9% for the period from 2024 to 2035, which is projected to bring the market volume to 4.9K tons by the end of 2035.
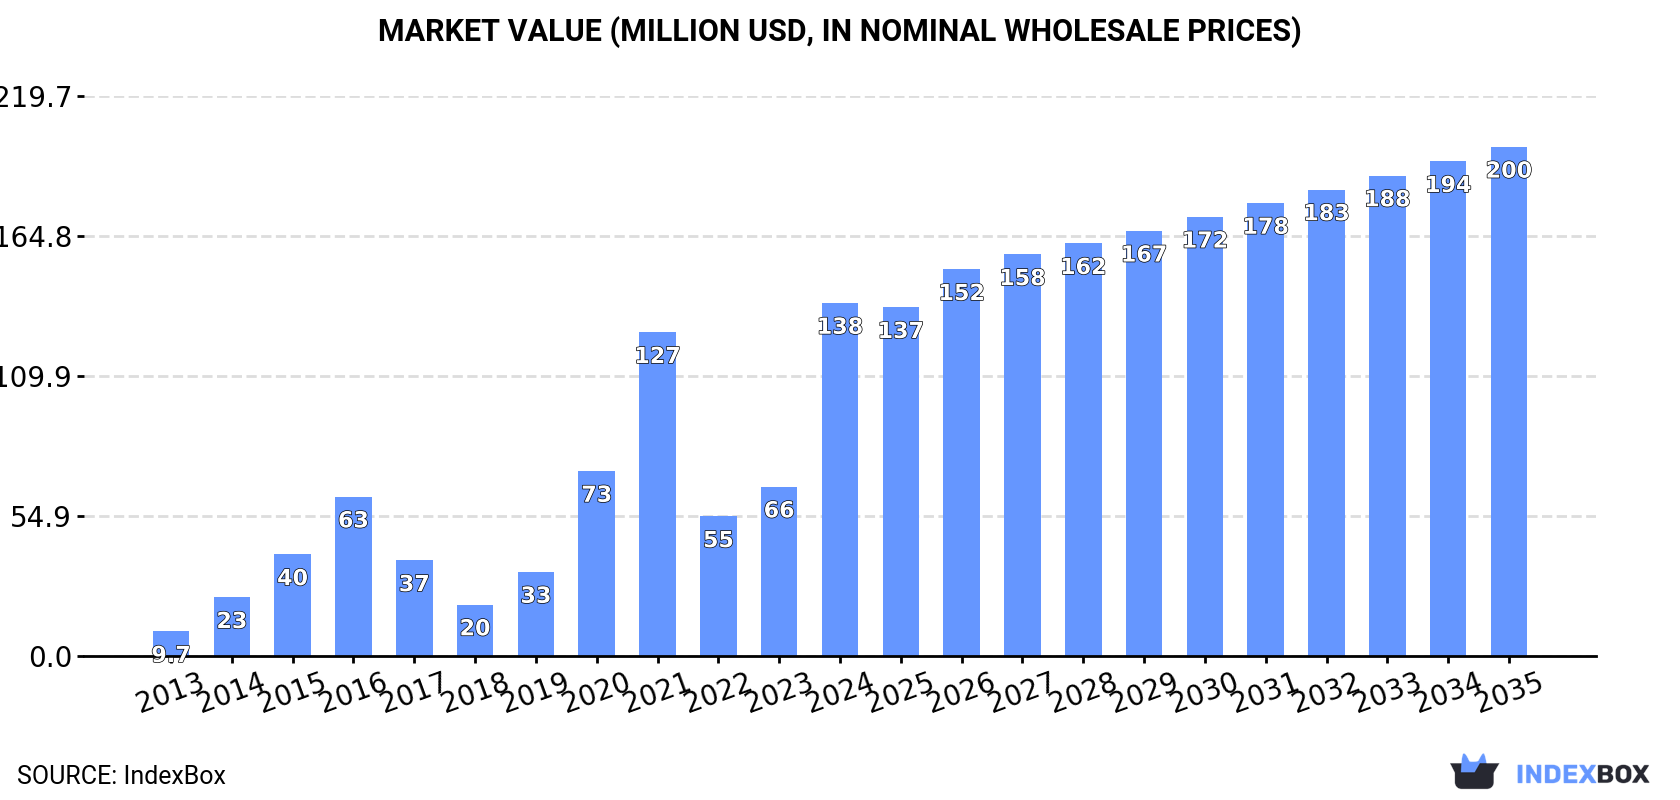
In value terms, the market is forecast to increase with an anticipated CAGR of +3.4% for the period from 2024 to 2035, which is projected to bring the market value to $200M (in nominal wholesale prices) by the end of 2035.
 ConsumptionUnited Kingdom’s Consumption of Spherical Roller Bearings
In 2024, approx. 4K tons of spherical roller bearings were consumed in the UK; increasing by 73% compared with 2023. Over the period under review, consumption continues to indicate a significant expansion. The UK consumption peaked in 2024 and is likely to see steady growth in years to come.
The revenue of the spherical roller bearing market in the UK soared to $138M in 2024, picking up by 108% against the previous year. This figure reflects the total revenues of producers and importers (excluding logistics costs, retail marketing costs, and retailers’ margins, which will be included in the final consumer price). In general, consumption saw a significant increase. Over the period under review, the market reached the peak level in 2024 and is expected to retain growth in the immediate term.
ProductionUnited Kingdom’s Production of Spherical Roller Bearings
In 2024, production of spherical roller bearings in the UK expanded significantly to 4.3K tons, rising by 6.3% against the previous year’s figure. Overall, production showed a relatively flat trend pattern. The pace of growth was the most pronounced in 2022 when the production volume increased by 29%. The UK production peaked at 5K tons in 2017; however, from 2018 to 2024, production remained at a lower figure.
In value terms, spherical roller bearing production soared to $153M in 2024 estimated in export price. The total output value increased at an average annual rate of +2.5% from 2013 to 2024; the trend pattern remained consistent, with somewhat noticeable fluctuations in certain years. As a result, production attained the peak level and is likely to continue growth in the immediate term.
ImportsUnited Kingdom’s Imports of Spherical Roller Bearings
In 2024, approx. 1.1K tons of spherical roller bearings were imported into the UK; which is down by -24.1% compared with the year before. In general, imports continue to indicate a perceptible curtailment. The pace of growth was the most pronounced in 2021 with an increase of 29%. The UK imports peaked at 1.6K tons in 2013; however, from 2014 to 2024, imports stood at a somewhat lower figure.
In value terms, spherical roller bearing imports reduced to $34M in 2024. Overall, imports saw a pronounced descent. The most prominent rate of growth was recorded in 2021 with an increase of 21%. The UK imports peaked at $48M in 2013; however, from 2014 to 2024, imports remained at a lower figure.
Imports By Country
In 2024, Thailand (17K tons) and Belgium (14K tons) represented the key importers of spherical roller bearingsacross the globe, together amounting to near 22% of total imports. India (8.7K tons) held a 6.3% share (based on physical terms) of total imports, which put it in second place, followed by the United States (6.2%), Germany (5.7%), China (5.4%) and Brazil (4.7%). South Korea (4.9K tons), Russia (4.9K tons), France (4.7K tons), Singapore (2.9K tons) and Denmark (1.3K tons) followed a long way behind the leaders.
From 2013 to 2024, the most notable rate of growth in terms of purchases, amongst the main importing countries, was attained by Belgium (with a CAGR of +25.0%), while imports for the other leaders experienced more modest paces of growth.
In value terms, the United States ($236M), Belgium ($175M) and India ($173M) were the countries with the highest levels of imports in 2024, together accounting for 28% of total imports.
In terms of the main importing countries, Belgium, with a CAGR of +19.4%, recorded the highest rates of growth with regard to the value of imports, over the period under review, while purchases for the other leaders experienced more modest paces of growth.
Import Prices By Country
The import price in the UK stood at $31,236 per ton in 2024, growing by 22% against the previous year. In general, the import price recorded a relatively flat trend pattern. The pace of growth was the most pronounced in 2017 an increase of 38%. The UK import price peaked at $33,469 per ton in 2015; however, from 2016 to 2024, import prices stood at a somewhat lower figure.
There were significant differences in the average prices amongst the major importing countries. In 2024, amid the top importers, the country with the highest price was the United States ($27,282 per ton), while Thailand ($2,248 per ton) was amongst the lowest.
From 2013 to 2024, the most notable rate of growth in terms of prices was attained by Denmark (+3.2%), while the other leaders experienced more modest paces of growth.
ExportsUnited Kingdom’s Exports of Spherical Roller Bearings
In 2024, the amount of spherical roller bearings exported from the UK reduced sharply to 1.4K tons, waning by -56.5% on the previous year’s figure. In general, exports recorded a abrupt contraction. The pace of growth was the most pronounced in 2022 with an increase of 224% against the previous year. The the UK exports peaked at 5.3K tons in 2013; however, from 2014 to 2024, the exports failed to regain momentum.
In value terms, spherical roller bearing exports declined significantly to $51M in 2024. Overall, exports saw a abrupt shrinkage. The pace of growth appeared the most rapid in 2022 with an increase of 148% against the previous year. The the UK exports peaked at $154M in 2014; however, from 2015 to 2024, the exports stood at a somewhat lower figure.
Exports By Country
China was the largest exporting country with an export of about 47K tons, which accounted for 32% of total exports. It was distantly followed by Germany (16K tons), Sweden (16K tons), Japan (15K tons), Romania (11K tons), Thailand (7.6K tons), Belgium (7.4K tons) and Singapore (2.5K tons), together creating a 51% share of total exports. The United States (2.3K tons), France (3.5K tons) and Malaysia (4K tons) took a minor share of total exports.
Exports from China increased at an average annual rate of +16.7% from 2013 to 2024. At the same time, Thailand (+57.5%), Belgium (+17.6%), Malaysia (+5.3%), Romania (+5.0%) and France (+1.2%) displayed positive paces of growth. Moreover, Thailand emerged as the fastest-growing exporter exported in the world, with a CAGR of +57.5% from 2013-2024. Japan experienced a relatively flat trend pattern. By contrast, Germany (-1.1%), Sweden (-4.5%), the United States (-9.4%) and Singapore (-10.5%) illustrated a downward trend over the same period. From 2013 to 2024, the share of China, Thailand, Belgium and Romania increased by +25, +5, +3.9 and +2 percentage points, respectively. The shares of the other countries remained relatively stable throughout the analyzed period.
In value terms, the largest spherical roller bearing supplying countries from the UK were Sweden ($338M), Germany ($324M) and China ($260M), together accounting for 44% of total exports. Japan, the United States, Belgium, Romania, Malaysia, France, Singapore and Thailand lagged somewhat behind, together accounting for a further 40%.
Thailand, with a CAGR of +33.4%, recorded the highest rates of growth with regard to the value of exports, in terms of the main exporting countries over the period under review, while shipments for the other leaders experienced more modest paces of growth.
Export Prices By Country
In 2024, the export price in the UK amounted to $37,877 per ton, with an increase of 30% against the previous year. Over the last eleven years, it increased at an average annual rate of +2.5%. As a result, the export price attained the peak level and is likely to continue growth in the immediate term.
Prices varied noticeably by country of origin: amid the top suppliers, the country with the highest price was the United States ($68,162 per ton), while Thailand ($3,253 per ton) was amongst the lowest.
From 2013 to 2024, the most notable rate of growth in terms of prices was attained by the United States (+11.7%), while the other leaders experienced more modest paces of growth.
Source: IndexBox Market Intelligence Platform
This report provides a comprehensive view of the spherical roller bearing industry in the United Kingdom, tracking demand, supply, and trade flows across the national value chain. It explains how demand across key channels and end-use segments shapes consumption patterns, while also mapping the role of input availability, production efficiency, and regulatory standards on supply.
Beyond headline metrics, the study benchmarks prices, margins, and trade routes so you can see where value is created and how it moves between domestic suppliers and international partners. The analysis is designed to support strategic planning, market entry, portfolio prioritization, and risk management in the spherical roller bearing landscape in the United Kingdom.
Quick navigation
Key findings
Domestic demand is shaped by both household and industrial usage, with trade flows linking local supply to imports and exports.
Pricing dynamics reflect unit values, freight costs, exchange rates, and regulatory shifts that affect sourcing decisions.
Supply depends on input availability and production efficiency, creating a distinct national cost curve.
Market concentration varies by segment, creating different competitive landscapes and entry barriers.
The 2035 outlook highlights where capacity investment and demand growth are most aligned within the country.
Report scope
The report combines market sizing with trade intelligence and price analytics for the United Kingdom. It covers both historical performance and the forward outlook to 2035, allowing you to compare cycles, structural shifts, and policy impacts.
Market size and growth in value and volume terms
Consumption structure by end-use segments
Production capacity, output, and cost dynamics
Trade flows, exporters, importers, and balances
Price benchmarks, unit values, and margin signals
Competitive context and market entry conditions
Product coverageProdcom 28151055 – Spherical roller bearingsCountry coverageCountry profile and benchmarks
This report provides a consistent view of market size, trade balance, prices, and per-capita indicators for the United Kingdom. The profile highlights demand structure and trade position, enabling benchmarking against regional and global peers.
Methodology
The analysis is built on a multi-source framework that combines official statistics, trade records, company disclosures, and expert validation. Data are standardized, reconciled, and cross-checked to ensure consistency across time series.
International trade data (exports, imports, and mirror statistics)
National production and consumption statistics
Company-level information from financial filings and public releases
Price series and unit value benchmarks
Analyst review, outlier checks, and time-series validation
All data are normalized to a common product definition and mapped to a consistent set of codes. This ensures that comparisons across time are aligned and actionable.
Forecasts to 2035
The forecast horizon extends to 2035 and is based on a structured model that links spherical roller bearing demand and supply to macroeconomic indicators, trade patterns, and sector-specific drivers. The model captures both cyclical and structural factors and reflects known policy and technology shifts in the United Kingdom.
Historical baseline: 2012-2025
Forecast horizon: 2026-2035
Scenario-based sensitivity to income growth, substitution, and regulation
Capacity and investment outlook for major producing companies
Each projection is built from national historical patterns and the broader regional context, allowing the report to show where growth is concentrated and where risks are elevated.
Price analysis and trade dynamics
Prices are analyzed in detail, including export and import unit values, regional spreads, and changes in trade costs. The report highlights how seasonality, freight rates, exchange rates, and supply disruptions influence pricing and margins.
Price benchmarks by country and sub-region
Export and import unit value trends
Seasonality and calendar effects in trade flows
Price outlook to 2035 under baseline assumptions
Profiles of market participants
Key producers, exporters, and distributors are profiled with a focus on their operational scale, geographic footprint, product mix, and market positioning. This helps identify competitive pressure points, partnership opportunities, and routes to differentiation.
Business focus and production capabilities
Geographic reach and distribution networks
Cost structure and pricing strategy indicators
Compliance, certification, and sustainability context
How to use this report
Quantify domestic demand and identify the most attractive segments
Evaluate export opportunities and prioritize target destinations
Track price dynamics and protect margins
Benchmark performance against leading competitors
Build evidence-based forecasts for investment decisions
This report is designed for manufacturers, distributors, importers, wholesalers, investors, and advisors who need a clear, data-driven picture of spherical roller bearing dynamics in the United Kingdom.
FAQ
What is included in the spherical roller bearing market in the United Kingdom?
The market size aggregates consumption and trade data, presented in both value and volume terms.
How are the forecasts to 2035 built?
The projections combine historical trends with macroeconomic indicators, trade dynamics, and sector-specific drivers.
Does the report cover prices and margins?
Yes, it includes export and import unit values, regional spreads, and a pricing outlook to 2035.
Which benchmarks are included?
The report benchmarks market size, trade balance, prices, and per-capita indicators for the United Kingdom.
Can this report support market entry decisions?
Yes, it highlights demand hotspots, trade routes, pricing trends, and competitive context.