

Feb 22, 2026
IndexBox has just published a new report: United Kingdom – Iodine – Market Analysis, Forecast, Size, Trends And Insights.
This article provides a comprehensive analysis of the United Kingdom’s iodine market for 2024, with a forecast to 2035. In 2024, UK iodine consumption fell to 744 tons, while domestic production saw a sharp decline of -74.8% to 121 tons. To meet demand, imports rose by 27% to 842 tons, primarily sourced from Turkmenistan, Japan, and Chile. Exports decreased by -20.1% to 219 tons, with India as the main destination. The market is forecast to grow, reaching 1.3K tons (CAGR +4.9%) and a value of $106M (CAGR +9.0%) by 2035, driven by rising demand.
Key Findings
UK iodine market is forecast to grow to 1.3K tons by 2035, with a volume CAGR of +4.9% and a value CAGR of +9.0%Domestic production collapsed by -74.8% in 2024, creating greater reliance on importsImports surged 27% in 2024, led by Turkmenistan, Japan, and Chile, which together supplied 78% of volumeIndia is the dominant export destination, receiving 63% of UK iodine exports by volumeAverage import price fell -28.4% in 2024 but remains significantly higher than historical levelsMarket Forecast
Driven by rising demand for iodine in the UK, the market is expected to start an upward consumption trend over the next decade. The performance of the market is forecast to increase slightly, with an anticipated CAGR of +4.9% for the period from 2024 to 2035, which is projected to bring the market volume to 1.3K tons by the end of 2035.
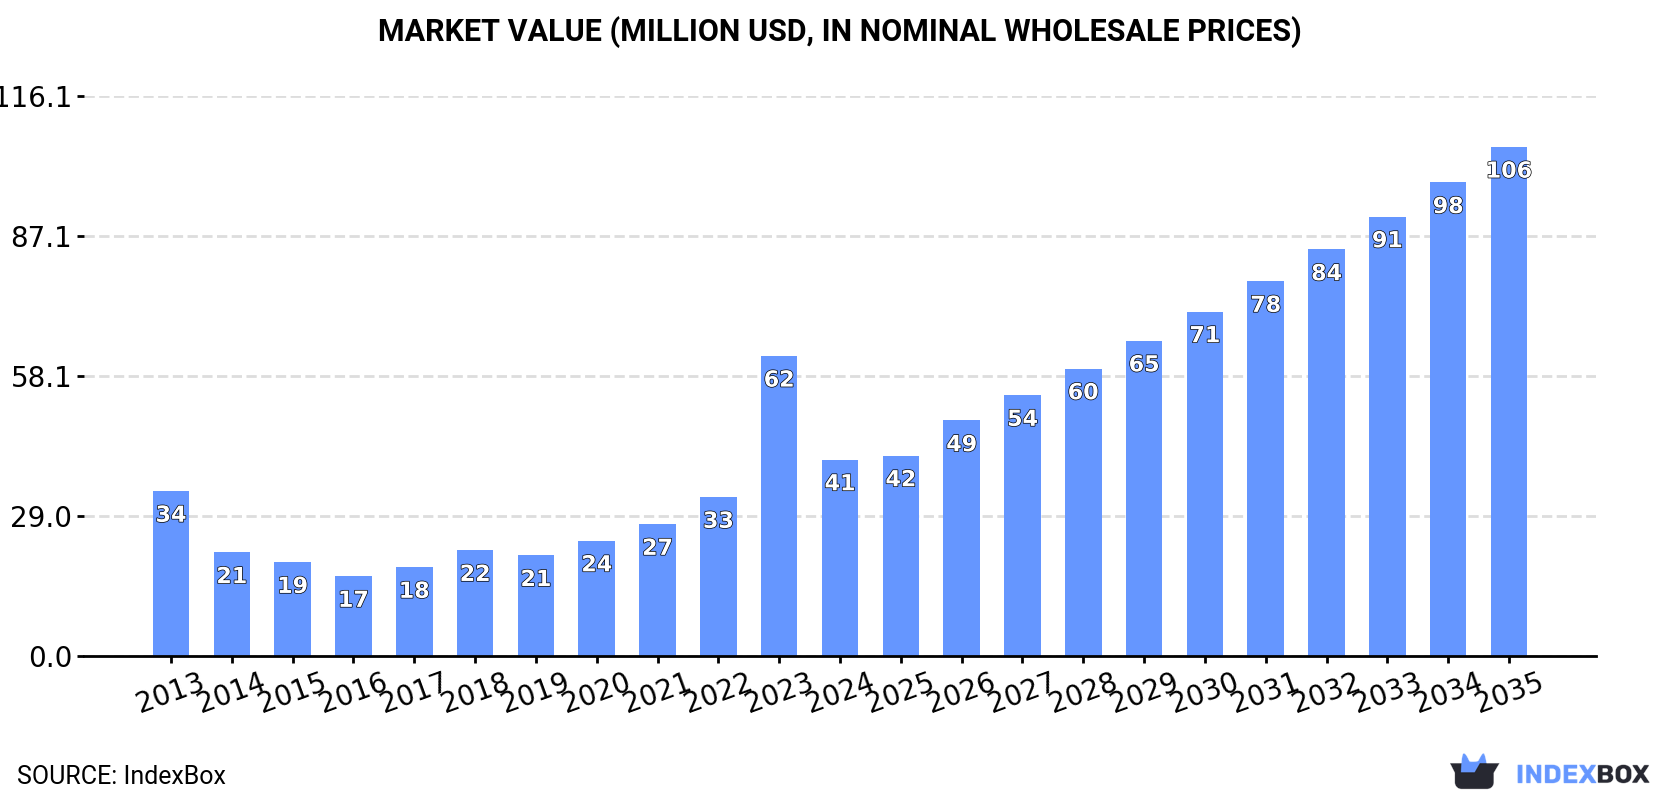
In value terms, the market is forecast to increase with an anticipated CAGR of +9.0% for the period from 2024 to 2035, which is projected to bring the market value to $106M (in nominal wholesale prices) by the end of 2035.
 ConsumptionUnited Kingdom’s Consumption of Iodine
In 2024, the amount of iodine consumed in the UK dropped to 744 tons, which is down by -14.2% compared with 2023. Over the period under review, consumption recorded a perceptible shrinkage. Over the period under review, consumption hit record highs at 932 tons in 2013; however, from 2014 to 2024, consumption stood at a somewhat lower figure.
The revenue of the iodine market in the UK declined markedly to $41M in 2024, shrinking by -34.6% against the previous year. This figure reflects the total revenues of producers and importers (excluding logistics costs, retail marketing costs, and retailers’ margins, which will be included in the final consumer price). In general, consumption, however, showed a slight increase. As a result, consumption attained the peak level of $62M, and then contracted significantly in the following year.
ProductionUnited Kingdom’s Production of Iodine
In 2024, after two years of growth, there was significant decline in production of iodine, when its volume decreased by -74.8% to 121 tons. Over the period under review, production continues to indicate a abrupt setback. The pace of growth was the most pronounced in 2023 when the production volume increased by 542% against the previous year. As a result, production reached the peak volume of 480 tons, and then dropped sharply in the following year.
In value terms, iodine production shrank remarkably to $6.4M in 2024 estimated in export price. Overall, production continues to indicate a relatively flat trend pattern. The pace of growth appeared the most rapid in 2023 with an increase of 810%. As a result, production attained the peak level of $27M, and then shrank notably in the following year.
ImportsUnited Kingdom’s Imports of Iodine
In 2024, overseas purchases of iodine increased by 27% to 842 tons for the first time since 2021, thus ending a two-year declining trend. In general, imports, however, saw a pronounced decrease. The most prominent rate of growth was recorded in 2017 when imports increased by 68%. Imports peaked at 1.1K tons in 2013; however, from 2014 to 2024, imports remained at a lower figure.
In value terms, iodine imports declined to $55M in 2024. Overall, imports showed tangible growth. The pace of growth appeared the most rapid in 2022 when imports increased by 54%. Over the period under review, imports attained the peak figure at $61M in 2023, and then fell in the following year.
Imports By Country
Turkmenistan (242 tons), Japan (236 tons) and Chile (175 tons) were the main suppliers of iodine imports to the UK, with a combined 78% share of total imports. The Netherlands, the United States, China, Germany and Belgium lagged somewhat behind, together comprising a further 22%.
From 2013 to 2024, the most notable rate of growth in terms of purchases, amongst the main suppliers, was attained by the United States (with a CAGR of +67.8%), while imports for the other leaders experienced more modest paces of growth.
In value terms, the largest iodine suppliers to the UK were Japan ($16M), Turkmenistan ($15M) and Chile ($12M), together comprising 78% of total imports.
Turkmenistan, with a CAGR of +89.5%, saw the highest rates of growth with regard to the value of imports, in terms of the main suppliers over the period under review, while purchases for the other leaders experienced more modest paces of growth.
Import Prices By Country
In 2024, the average iodine import price amounted to $65,628 per ton, with a decrease of -28.4% against the previous year. Overall, the import price, however, continues to indicate a prominent increase. The most prominent rate of growth was recorded in 2022 an increase of 61% against the previous year. Over the period under review, average import prices reached the peak figure at $91,661 per ton in 2023, and then declined rapidly in the following year.
Prices varied noticeably by country of origin: amid the top importers, the country with the highest price was Belgium ($134,200 per ton), while the price for the United States ($58,197 per ton) was amongst the lowest.
From 2013 to 2024, the most notable rate of growth in terms of prices was attained by Turkmenistan (+22.0%), while the prices for the other major suppliers experienced more modest paces of growth.
ExportsUnited Kingdom’s Exports of Iodine
In 2024, the amount of iodine exported from the UK shrank notably to 219 tons, with a decrease of -20.1% compared with 2023 figures. Overall, exports, however, continue to indicate a relatively flat trend pattern. The pace of growth was the most pronounced in 2022 when exports increased by 97% against the previous year. As a result, the exports reached the peak of 297 tons. From 2023 to 2024, the growth of the exports remained at a lower figure.
In value terms, iodine exports fell notably to $15M in 2024. In general, exports, however, posted pronounced growth. The pace of growth was the most pronounced in 2022 with an increase of 237%. Over the period under review, the exports attained the maximum at $20M in 2023, and then shrank markedly in the following year.
Exports By Country
India (139 tons) was the main destination for iodine exports from the UK, with a 63% share of total exports. Moreover, iodine exports to India exceeded the volume sent to the second major destination, Germany (28 tons), fivefold. China (20 tons) ranked third in terms of total exports with a 9% share.
From 2013 to 2024, the average annual rate of growth in terms of volume to India stood at +24.6%. Exports to the other major destinations recorded the following average annual rates of exports growth: Germany (-5.8% per year) and China (+5.8% per year).
In value terms, India ($9.1M) remains the key foreign market for iodine exports from the UK, comprising 62% of total exports. The second position in the ranking was held by Germany ($2.3M), with a 15% share of total exports. It was followed by China, with a 9% share.
From 2013 to 2024, the average annual rate of growth in terms of value to India stood at +29.1%. Exports to the other major destinations recorded the following average annual rates of exports growth: Germany (-0.3% per year) and China (+7.1% per year).
Export Prices By Country
The average iodine export price stood at $67,728 per ton in 2024, falling by -6% against the previous year. Overall, the export price, however, enjoyed a perceptible expansion. The pace of growth appeared the most rapid in 2022 when the average export price increased by 71% against the previous year. The export price peaked at $72,085 per ton in 2023, and then declined in the following year.
There were significant differences in the average prices for the major external markets. In 2024, amid the top suppliers, the country with the highest price was Egypt ($81,289 per ton), while the average price for exports to the Netherlands ($53,182 per ton) was amongst the lowest.
From 2013 to 2024, the most notable rate of growth in terms of prices was recorded for supplies to Poland (+9.3%), while the prices for the other major destinations experienced more modest paces of growth.
Source: IndexBox Market Intelligence Platform
This report provides a comprehensive view of the iodine industry in the United Kingdom, tracking demand, supply, and trade flows across the national value chain. It explains how demand across key channels and end-use segments shapes consumption patterns, while also mapping the role of input availability, production efficiency, and regulatory standards on supply.
Beyond headline metrics, the study benchmarks prices, margins, and trade routes so you can see where value is created and how it moves between domestic suppliers and international partners. The analysis is designed to support strategic planning, market entry, portfolio prioritization, and risk management in the iodine landscape in the United Kingdom.
Quick navigation
Key findings
Domestic demand is shaped by both household and industrial usage, with trade flows linking local supply to imports and exports.
Pricing dynamics reflect unit values, freight costs, exchange rates, and regulatory shifts that affect sourcing decisions.
Supply depends on input availability and production efficiency, creating a distinct national cost curve.
Market concentration varies by segment, creating different competitive landscapes and entry barriers.
The 2035 outlook highlights where capacity investment and demand growth are most aligned within the country.
Report scope
The report combines market sizing with trade intelligence and price analytics for the United Kingdom. It covers both historical performance and the forward outlook to 2035, allowing you to compare cycles, structural shifts, and policy impacts.
Market size and growth in value and volume terms
Consumption structure by end-use segments
Production capacity, output, and cost dynamics
Trade flows, exporters, importers, and balances
Price benchmarks, unit values, and margin signals
Competitive context and market entry conditions
Product coverageCountry coverageCountry profile and benchmarks
This report provides a consistent view of market size, trade balance, prices, and per-capita indicators for the United Kingdom. The profile highlights demand structure and trade position, enabling benchmarking against regional and global peers.
Methodology
The analysis is built on a multi-source framework that combines official statistics, trade records, company disclosures, and expert validation. Data are standardized, reconciled, and cross-checked to ensure consistency across time series.
International trade data (exports, imports, and mirror statistics)
National production and consumption statistics
Company-level information from financial filings and public releases
Price series and unit value benchmarks
Analyst review, outlier checks, and time-series validation
All data are normalized to a common product definition and mapped to a consistent set of codes. This ensures that comparisons across time are aligned and actionable.
Forecasts to 2035
The forecast horizon extends to 2035 and is based on a structured model that links iodine demand and supply to macroeconomic indicators, trade patterns, and sector-specific drivers. The model captures both cyclical and structural factors and reflects known policy and technology shifts in the United Kingdom.
Historical baseline: 2012-2025
Forecast horizon: 2026-2035
Scenario-based sensitivity to income growth, substitution, and regulation
Capacity and investment outlook for major producing companies
Each projection is built from national historical patterns and the broader regional context, allowing the report to show where growth is concentrated and where risks are elevated.
Price analysis and trade dynamics
Prices are analyzed in detail, including export and import unit values, regional spreads, and changes in trade costs. The report highlights how seasonality, freight rates, exchange rates, and supply disruptions influence pricing and margins.
Price benchmarks by country and sub-region
Export and import unit value trends
Seasonality and calendar effects in trade flows
Price outlook to 2035 under baseline assumptions
Profiles of market participants
Key producers, exporters, and distributors are profiled with a focus on their operational scale, geographic footprint, product mix, and market positioning. This helps identify competitive pressure points, partnership opportunities, and routes to differentiation.
Business focus and production capabilities
Geographic reach and distribution networks
Cost structure and pricing strategy indicators
Compliance, certification, and sustainability context
How to use this report
Quantify domestic demand and identify the most attractive segments
Evaluate export opportunities and prioritize target destinations
Track price dynamics and protect margins
Benchmark performance against leading competitors
Build evidence-based forecasts for investment decisions
This report is designed for manufacturers, distributors, importers, wholesalers, investors, and advisors who need a clear, data-driven picture of iodine dynamics in the United Kingdom.
FAQ
What is included in the iodine market in the United Kingdom?
The market size aggregates consumption and trade data, presented in both value and volume terms.
How are the forecasts to 2035 built?
The projections combine historical trends with macroeconomic indicators, trade dynamics, and sector-specific drivers.
Does the report cover prices and margins?
Yes, it includes export and import unit values, regional spreads, and a pricing outlook to 2035.
Which benchmarks are included?
The report benchmarks market size, trade balance, prices, and per-capita indicators for the United Kingdom.
Can this report support market entry decisions?
Yes, it highlights demand hotspots, trade routes, pricing trends, and competitive context.