
Feb 22, 2026
IndexBox has just published a new report: United Kingdom – Buttermilk And Buttermilk Powder – Market Analysis, Forecast, Size, Trends and Insights.
The UK buttermilk and buttermilk powder market experienced a sharp decline in consumption and value in 2024, falling to 52K tons and $137M respectively from previous highs. Domestic production also decreased to 15K tons. Imports dropped significantly to 75K tons, primarily sourced from France, Germany, and Poland, while exports grew to 38K tons, led by shipments to the Philippines and Ireland. The market is forecast for a modest recovery, with a projected volume of 60K tons and a value of $172M by 2035, representing CAGRs of +1.4% and +2.1% respectively.
Key Findings
UK market consumption and value dropped sharply in 2024 to 52K tons and $137M, far below previous peaksMarket is forecast for a slight decade-long recovery with a +1.4% volume and +2.1% value CAGR, reaching 60K tons and $172M by 2035Domestic production is low and declining, accounting for only about 29% of 2024 consumptionImports fell by 42.9% in 2024 but remain crucial, with France, Germany, and Poland as the top suppliersExports are growing strongly, up 19% in 2024, with the Philippines and Ireland as key destinations, but at a much lower average price than importsMarket Forecast
Driven by rising demand for buttermilk and buttermilk powder in the UK, the market is expected to start an upward consumption trend over the next decade. The performance of the market is forecast to increase slightly, with an anticipated CAGR of +1.4% for the period from 2024 to 2035, which is projected to bring the market volume to 60K tons by the end of 2035.
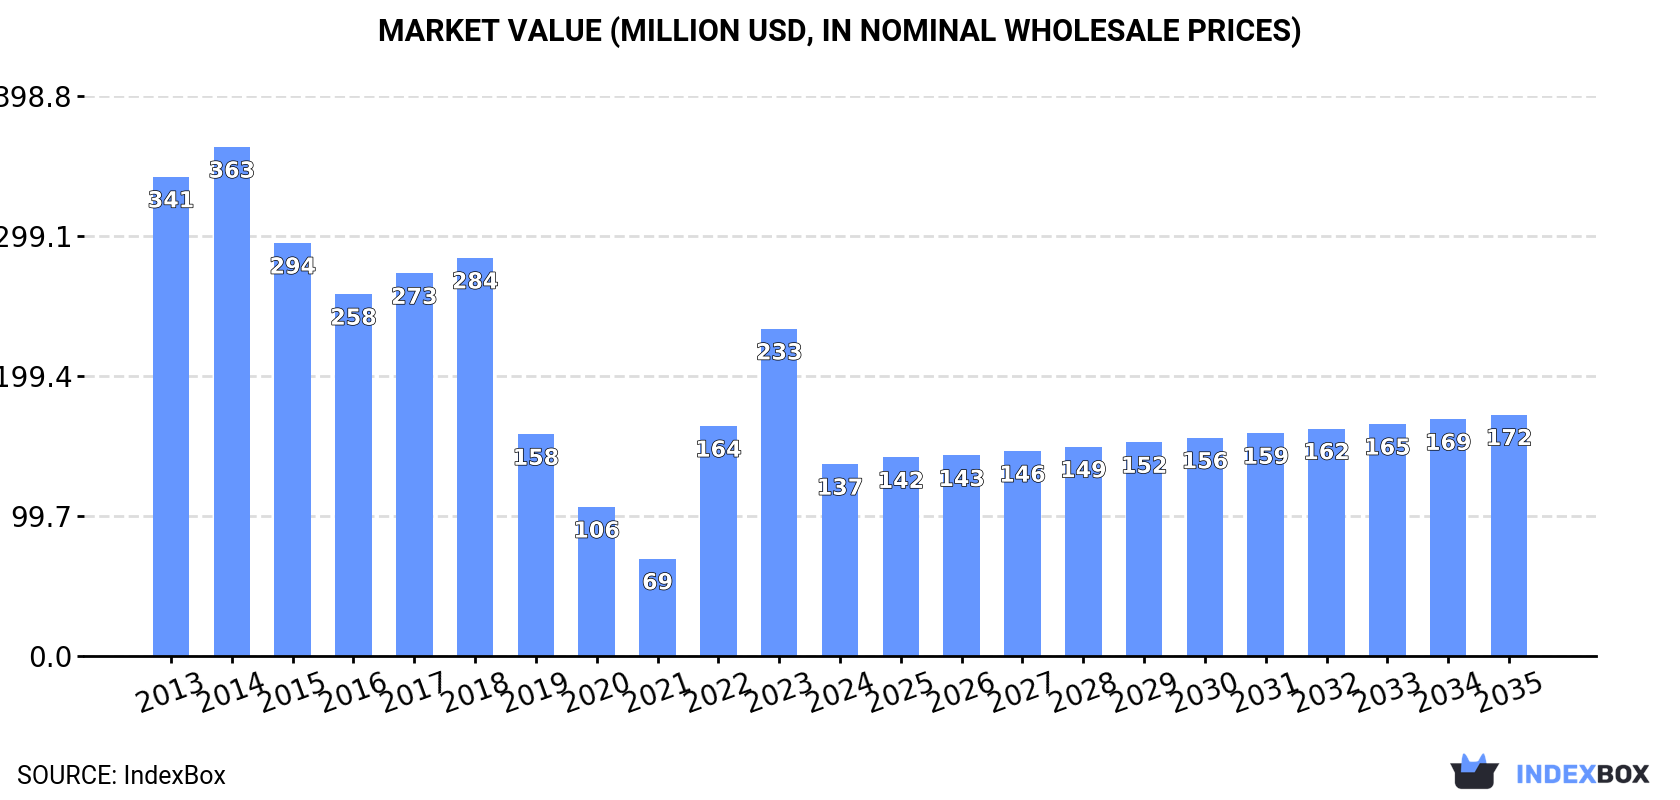
In value terms, the market is forecast to increase with an anticipated CAGR of +2.1% for the period from 2024 to 2035, which is projected to bring the market value to $172M (in nominal wholesale prices) by the end of 2035.
 ConsumptionUnited Kingdom’s Consumption of Buttermilk And Buttermilk Powder
After two years of growth, consumption of buttermilk and buttermilk powder decreased by -55.1% to 52K tons in 2024. Over the period under review, consumption saw a deep setback. Over the period under review, consumption attained the peak volume at 278K tons in 2016; however, from 2017 to 2024, consumption remained at a lower figure.
The value of the buttermilk and buttermilk powder market in the UK dropped remarkably to $137M in 2024, with a decrease of -41.3% against the previous year. This figure reflects the total revenues of producers and importers (excluding logistics costs, retail marketing costs, and retailers’ margins, which will be included in the final consumer price). In general, consumption continues to indicate a abrupt downturn. Buttermilk and buttermilk powder consumption peaked at $363M in 2014; however, from 2015 to 2024, consumption remained at a lower figure.
ProductionUnited Kingdom’s Production of Buttermilk And Buttermilk Powder
In 2024, approx. 15K tons of buttermilk and buttermilk powder were produced in the UK; waning by -1.9% compared with 2023 figures. Overall, production continues to indicate a abrupt curtailment. The growth pace was the most rapid in 2016 with an increase of 71%. As a result, production reached the peak volume of 92K tons. From 2017 to 2024, production growth remained at a somewhat lower figure.
In value terms, buttermilk and buttermilk powder production declined to $14M in 2024 estimated in export price. Over the period under review, production recorded a drastic downturn. The pace of growth appeared the most rapid in 2017 when the production volume increased by 73% against the previous year. As a result, production reached the peak level of $29M. From 2018 to 2024, production growth remained at a somewhat lower figure.
ImportsUnited Kingdom’s Imports of Buttermilk And Buttermilk Powder
In 2024, after two years of growth, there was significant decline in purchases abroad of buttermilk and buttermilk powder, when their volume decreased by -42.9% to 75K tons. Overall, imports continue to indicate a deep reduction. The pace of growth was the most pronounced in 2022 with an increase of 112%. Over the period under review, imports reached the peak figure at 212K tons in 2013; however, from 2014 to 2024, imports stood at a somewhat lower figure.
In value terms, buttermilk and buttermilk powder imports fell sharply to $153M in 2024. Over the period under review, imports showed a deep slump. The most prominent rate of growth was recorded in 2022 when imports increased by 135% against the previous year. Over the period under review, imports attained the peak figure at $372M in 2014; however, from 2015 to 2024, imports remained at a lower figure.
Imports By Country
France (34K tons), Germany (18K tons) and Poland (12K tons) were the main suppliers of buttermilk and buttermilk powder imports to the UK, with a combined 84% share of total imports. Ireland, the Netherlands, Belgium, Luxembourg and Spain lagged somewhat behind, together accounting for a further 13%.
From 2013 to 2024, the biggest increases were recorded for Luxembourg (with a CAGR of +234.7%), while purchases for the other leaders experienced more modest paces of growth.
In value terms, France ($68M), Germany ($39M) and Poland ($21M) constituted the largest buttermilk and buttermilk powder suppliers to the UK, together comprising 84% of total imports. Ireland, Belgium, the Netherlands, Luxembourg and Spain lagged somewhat behind, together comprising a further 12%.
Luxembourg, with a CAGR of +270.1%, saw the highest rates of growth with regard to the value of imports, in terms of the main suppliers over the period under review, while purchases for the other leaders experienced more modest paces of growth.
Import Prices By Country
The average buttermilk and buttermilk powder import price stood at $2,025 per ton in 2024, with an increase of 9.8% against the previous year. Over the last eleven years, it increased at an average annual rate of +2.0%. The most prominent rate of growth was recorded in 2022 when the average import price increased by 11%. Over the period under review, average import prices hit record highs in 2024 and is likely to see steady growth in years to come.
Prices varied noticeably by country of origin: amid the top importers, the country with the highest price was Ireland ($2,604 per ton), while the price for the Netherlands ($1,044 per ton) was amongst the lowest.
From 2013 to 2024, the most notable rate of growth in terms of prices was attained by Luxembourg (+10.6%), while the prices for the other major suppliers experienced more modest paces of growth.
ExportsUnited Kingdom’s Exports of Buttermilk And Buttermilk Powder
For the third year in a row, the UK recorded growth in shipments abroad of buttermilk and buttermilk powder, which increased by 19% to 38K tons in 2024. Overall, exports showed a buoyant expansion. The pace of growth was the most pronounced in 2016 when exports increased by 76% against the previous year. The exports peaked in 2024 and are expected to retain growth in years to come.
In value terms, buttermilk and buttermilk powder exports surged to $30M in 2024. Over the period under review, total exports indicated a mild expansion from 2013 to 2024: its value increased at an average annual rate of +1.0% over the last eleven-year period. The trend pattern, however, indicated some noticeable fluctuations being recorded throughout the analyzed period. Based on 2024 figures, exports decreased by -9.8% against 2022 indices. The most prominent rate of growth was recorded in 2017 with an increase of 31% against the previous year. As a result, the exports attained the peak of $40M. From 2018 to 2024, the growth of the exports remained at a lower figure.
Exports By Country
Ireland (5.4K tons) was the main destination for buttermilk and buttermilk powder exports from the UK, with a 14% share of total exports. Moreover, buttermilk and buttermilk powder exports to Ireland exceeded the volume sent to the second major destination, the Philippines (2.4K tons), twofold. France (1K tons) ranked third in terms of total exports with a 2.6% share.
From 2013 to 2024, the average annual growth rate of volume to Ireland stood at -3.7%. Exports to the other major destinations recorded the following average annual rates of exports growth: the Philippines (+36.6% per year) and France (+7.6% per year).
In value terms, the largest markets for buttermilk and buttermilk powder exported from the UK were the Philippines ($6.3M), Ireland ($3.4M) and Malaysia ($2.6M), together comprising 41% of total exports. The United Arab Emirates, France, Egypt, Thailand, Saudi Arabia and the Netherlands lagged somewhat behind, together comprising a further 25%.
Among the main countries of destination, Saudi Arabia, with a CAGR of +70.2%, recorded the highest rates of growth with regard to the value of exports, over the period under review, while shipments for the other leaders experienced more modest paces of growth.
Export Prices By Country
The average buttermilk and buttermilk powder export price stood at $778 per ton in 2024, remaining constant against the previous year. In general, the export price, however, continues to indicate a abrupt downturn. The pace of growth was the most pronounced in 2021 an increase of 59%. The export price peaked at $2,387 per ton in 2014; however, from 2015 to 2024, the export prices remained at a lower figure.
There were significant differences in the average prices for the major export markets. In 2024, amid the top suppliers, the country with the highest price was the United Arab Emirates ($3,033 per ton), while the average price for exports to Ireland ($619 per ton) was amongst the lowest.
From 2013 to 2024, the most notable rate of growth in terms of prices was recorded for supplies to Egypt (+8.2%), while the prices for the other major destinations experienced more modest paces of growth.
Source: IndexBox Market Intelligence Platform
This report provides a comprehensive view of the buttermilk and buttermilk powder industry in the United Kingdom, tracking demand, supply, and trade flows across the national value chain. It explains how demand across key channels and end-use segments shapes consumption patterns, while also mapping the role of input availability, production efficiency, and regulatory standards on supply.
Beyond headline metrics, the study benchmarks prices, margins, and trade routes so you can see where value is created and how it moves between domestic suppliers and international partners. The analysis is designed to support strategic planning, market entry, portfolio prioritization, and risk management in the buttermilk and buttermilk powder landscape in the United Kingdom.
Quick navigation
Key findings
Domestic demand is shaped by both household and industrial usage, with trade flows linking local supply to imports and exports.
Pricing dynamics reflect unit values, freight costs, exchange rates, and regulatory shifts that affect sourcing decisions.
Supply depends on input availability and production efficiency, creating a distinct national cost curve.
Market concentration varies by segment, creating different competitive landscapes and entry barriers.
The 2035 outlook highlights where capacity investment and demand growth are most aligned within the country.
Report scope
The report combines market sizing with trade intelligence and price analytics for the United Kingdom. It covers both historical performance and the forward outlook to 2035, allowing you to compare cycles, structural shifts, and policy impacts.
Market size and growth in value and volume terms
Consumption structure by end-use segments
Production capacity, output, and cost dynamics
Trade flows, exporters, importers, and balances
Price benchmarks, unit values, and margin signals
Competitive context and market entry conditions
Product coverageFCL 893 – Buttermilk, Curdled Milk, Acidified MilkCountry coverageCountry profile and benchmarks
This report provides a consistent view of market size, trade balance, prices, and per-capita indicators for the United Kingdom. The profile highlights demand structure and trade position, enabling benchmarking against regional and global peers.
Methodology
The analysis is built on a multi-source framework that combines official statistics, trade records, company disclosures, and expert validation. Data are standardized, reconciled, and cross-checked to ensure consistency across time series.
International trade data (exports, imports, and mirror statistics)
National production and consumption statistics
Company-level information from financial filings and public releases
Price series and unit value benchmarks
Analyst review, outlier checks, and time-series validation
All data are normalized to a common product definition and mapped to a consistent set of codes. This ensures that comparisons across time are aligned and actionable.
Forecasts to 2035
The forecast horizon extends to 2035 and is based on a structured model that links buttermilk and buttermilk powder demand and supply to macroeconomic indicators, trade patterns, and sector-specific drivers. The model captures both cyclical and structural factors and reflects known policy and technology shifts in the United Kingdom.
Historical baseline: 2012-2025
Forecast horizon: 2026-2035
Scenario-based sensitivity to income growth, substitution, and regulation
Capacity and investment outlook for major producing companies
Each projection is built from national historical patterns and the broader regional context, allowing the report to show where growth is concentrated and where risks are elevated.
Price analysis and trade dynamics
Prices are analyzed in detail, including export and import unit values, regional spreads, and changes in trade costs. The report highlights how seasonality, freight rates, exchange rates, and supply disruptions influence pricing and margins.
Price benchmarks by country and sub-region
Export and import unit value trends
Seasonality and calendar effects in trade flows
Price outlook to 2035 under baseline assumptions
Profiles of market participants
Key producers, exporters, and distributors are profiled with a focus on their operational scale, geographic footprint, product mix, and market positioning. This helps identify competitive pressure points, partnership opportunities, and routes to differentiation.
Business focus and production capabilities
Geographic reach and distribution networks
Cost structure and pricing strategy indicators
Compliance, certification, and sustainability context
How to use this report
Quantify domestic demand and identify the most attractive segments
Evaluate export opportunities and prioritize target destinations
Track price dynamics and protect margins
Benchmark performance against leading competitors
Build evidence-based forecasts for investment decisions
This report is designed for manufacturers, distributors, importers, wholesalers, investors, and advisors who need a clear, data-driven picture of buttermilk and buttermilk powder dynamics in the United Kingdom.
FAQ
What is included in the buttermilk and buttermilk powder market in the United Kingdom?
The market size aggregates consumption and trade data, presented in both value and volume terms.
How are the forecasts to 2035 built?
The projections combine historical trends with macroeconomic indicators, trade dynamics, and sector-specific drivers.
Does the report cover prices and margins?
Yes, it includes export and import unit values, regional spreads, and a pricing outlook to 2035.
Which benchmarks are included?
The report benchmarks market size, trade balance, prices, and per-capita indicators for the United Kingdom.
Can this report support market entry decisions?
Yes, it highlights demand hotspots, trade routes, pricing trends, and competitive context.