

GDP growth in the euro area and the EU
In the second quarter of 2026, seasonally adjusted GDP increased by 0.6% in the euro area and by 0.7% in the EU, compared with the previous quarter, according to an estimate published by Eurostat, the statistical office of the European Union. In the first quarter of 2026, GDP had remained stable in the euro area and had increased by 0.1% in the EU.
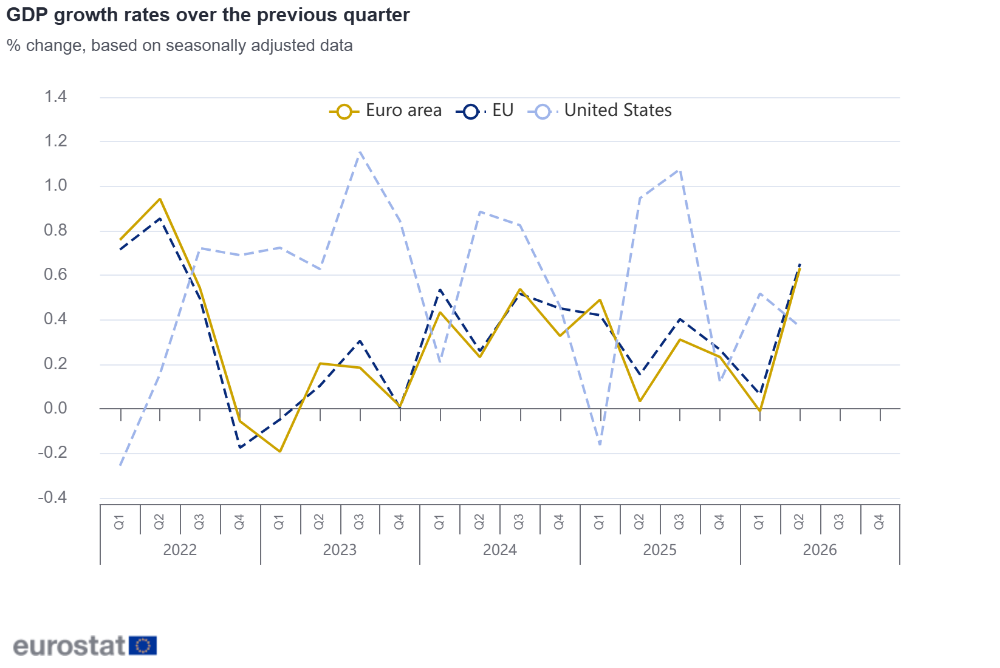
Compared with the same quarter of the previous year, seasonally adjusted GDP increased by 1.2% in the euro area and by 1.4% in the EU in the second quarter of 2026, after +0.6% in the euro area and +0.9% in the EU in the previous quarter.
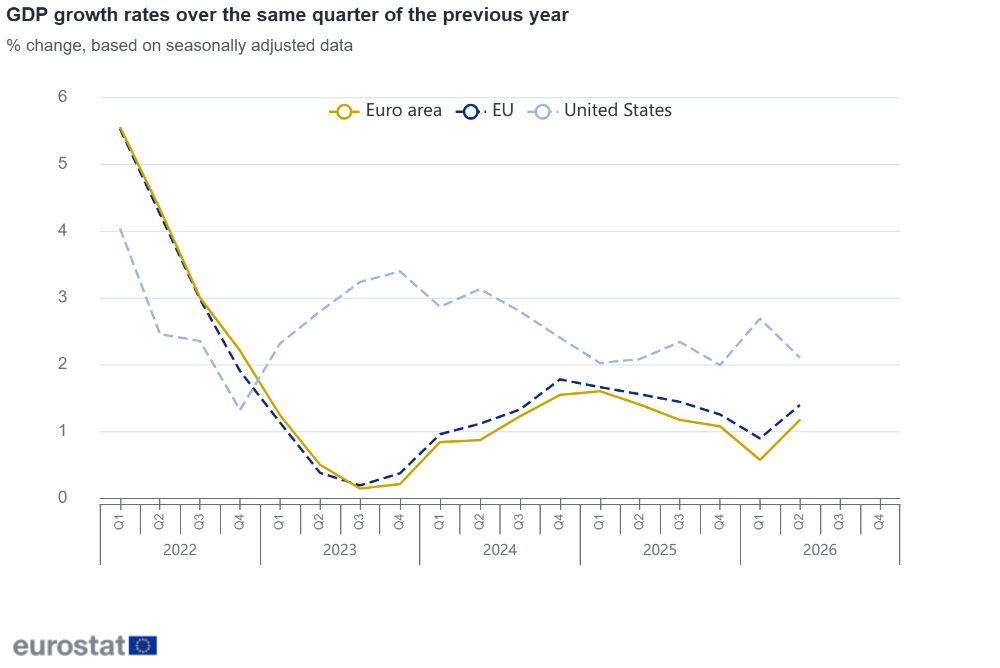
During the second quarter of 2026, GDP in the United States increased by 0.4% compared to the previous quarter (after +0.5% in the first quarter of 2026). Compared with the same quarter of the previous year, GDP increased by 2.1% (after +2.7% in the previous quarter).
GDP growth by Member State
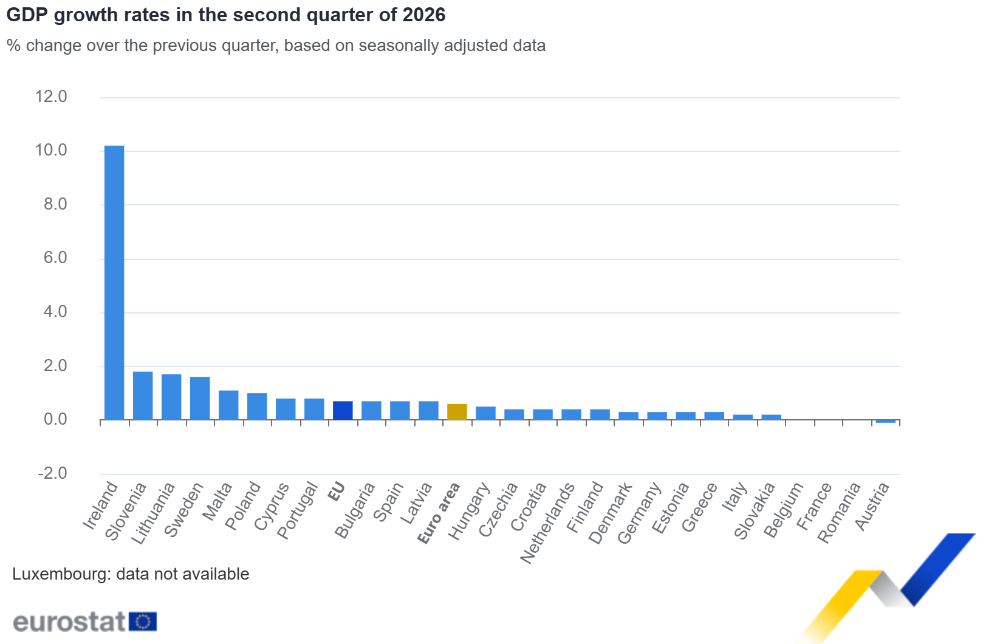
In the second quarter of 2026, Ireland (+10.2%) recorded the highest increase compared to the previous quarter, followed by Slovenia (+1.8%) and Lithuania (+1.7%). Austria (-0.1%) was the only Member State that recorded a decrease compared to the previous quarter.
Contributions to GDP growth
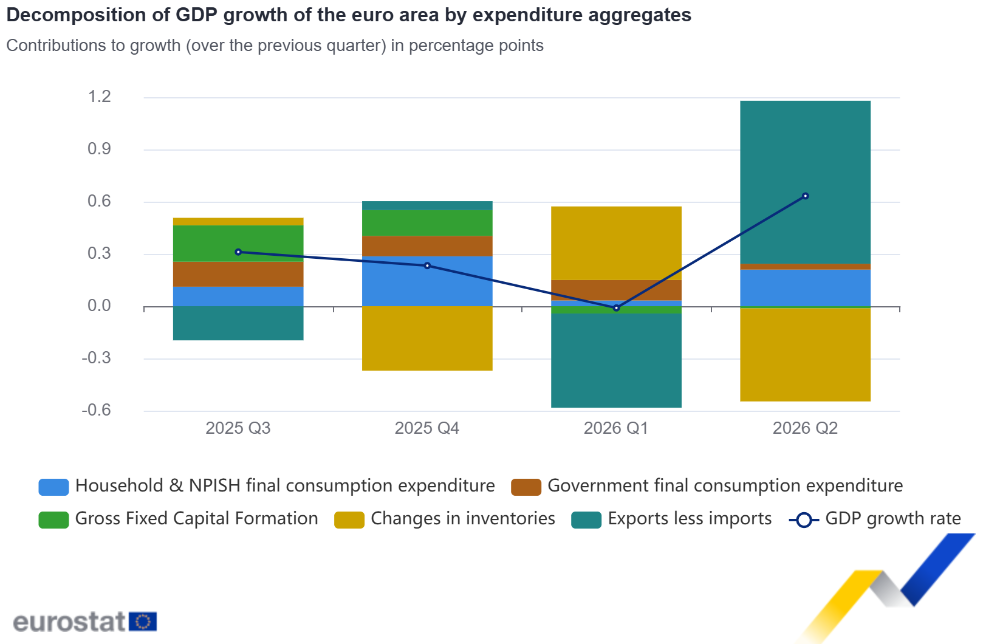
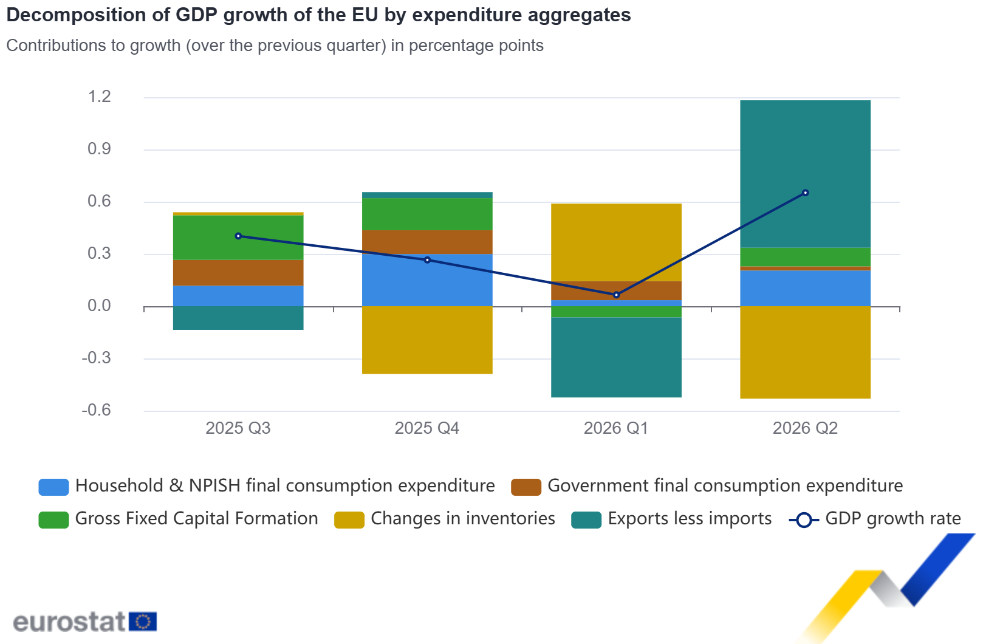
In the second quarter of 2026, the contribution to GDP growth to the previous quarter from:
household final consumption expenditure was positive for both the euro area and the EU (+0.2 percentage points – pp for both),
government final consumption expenditure was negligible for both the euro area and the EU,
gross fixed capital formation was negligible for the euro area and positive for the EU (+0.1 pp),
changes in inventories was negative for the euro area and the EU (-0.5 pp for both), and
exports less imports was positive for both the euro area (+0.9 pp) and the EU (+0.8 pp).
Employment in the euro area and the EU
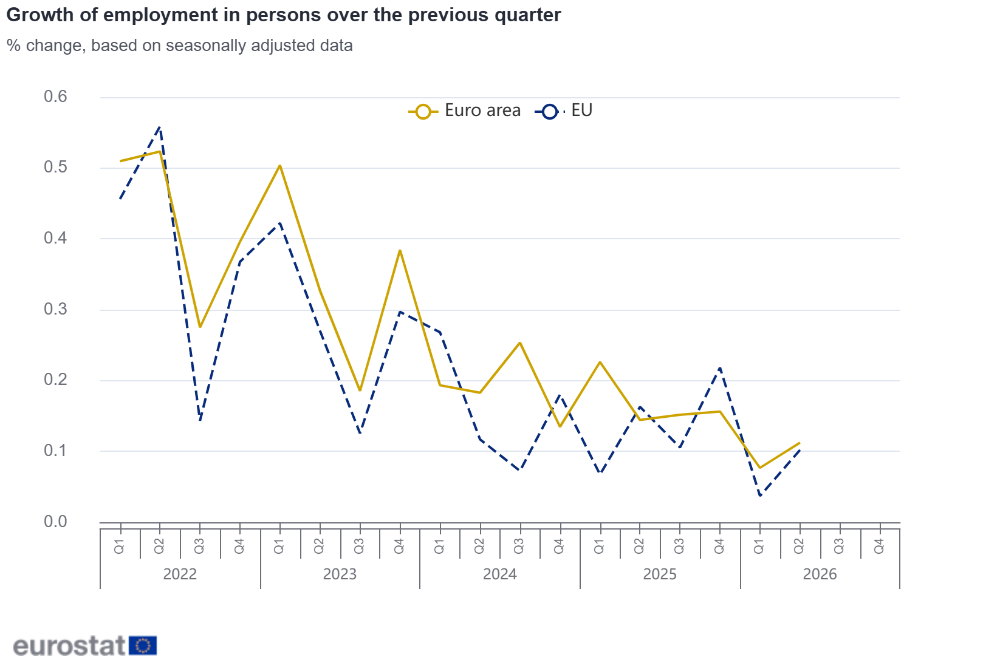
Based on seasonally adjusted figures, Eurostat estimates that, in the second quarter of 2026, 221.4 million people were employed in the EU, of which 176.4 million were in the euro area.
The number of employed persons increased by 0.1% in both the euro area and the EU, compared with the previous quarter. In the first quarter of 2026, employment had increased by 0.1% in the euro area and had remained stable in the EU.
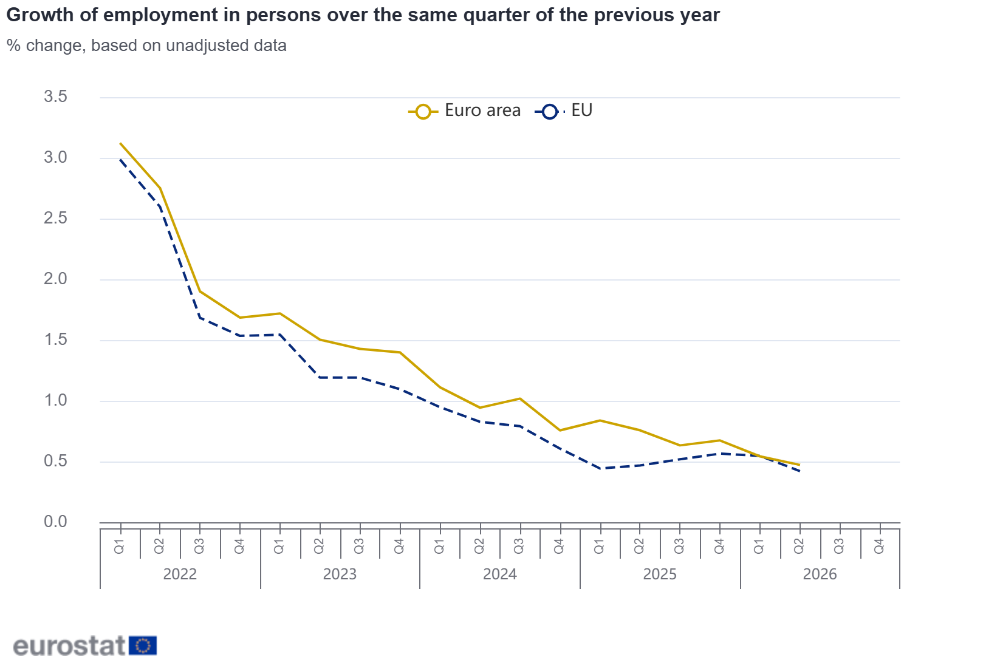
Compared with the same quarter of the previous year, employment increased by 0.5% in the euro area and by 0.4% in the EU in the second quarter of 2026, after +0.5% in both areas in the first quarter of 2026.
Hours worked increased by 0.1% in both the euro area and the EU in the second quarter of 2026, compared with the previous quarter. Compared with the same quarter of the previous year, hours worked increased by 0.7% in the euro area and by 0.8% in the EU.
These data provide a picture of labour input consistent with the output and income measure of national accounts.
Employment growth by Member State
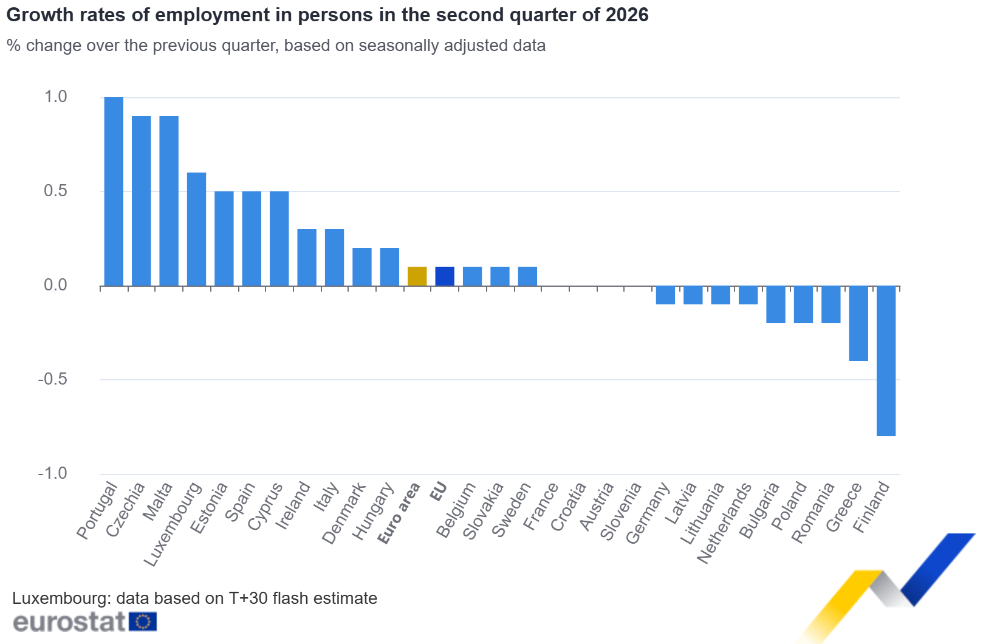
In the second quarter of 2026, Portugal (+1.0%), Czechia and Malta (both +0.9%) recorded the highest increase of employment in persons compared to the previous quarter. The highest declines of employment were recorded in Finland (-0.8%) and Greece (-0.4%).
Tables
Growth rates of GDP in volume
(based on seasonally adjusted* data)
Percentage change compared with the previous quarter
Percentage change compared with the same quarter of the previous year
2025Q3
2025Q4
2026Q1
2026Q2
2025Q3
2025Q4
2026Q1
2026Q2
0.3
0.2
0.0
0.6
1.2
1.1
0.6
1.2
0.4
0.3
0.1
0.7
1.4
1.3
0.9
1.4
0.2
0.1
0.2
0.0
1.0
0.9
0.8
0.5
0.7
0.7
0.7
0.7
3.1
2.9
3.0
2.8
0.7
0.7
0.2
0.4
2.8
2.8
2.2
1.9
2.3
0.4
1.5
0.3
4.6
3.2
6.1
4.6
0.0
0.3
0.4
0.3
0.3
0.3
0.7
1.0
0.2
0.3
1.0
0.3
1.5
1.6
2.7
1.8
1.4
-3.3
-7.8
10.2
5.1
-0.1
-13.4
-0.4
0.6
0.7
0.2
0.3
2.1
2.3
2.0
1.9
0.6
0.8
0.6
0.7
2.7
2.7
2.7
2.7
0.4
0.3
-0.2
0.0
0.8
1.1
0.7
0.5
0.3
1.2
-0.1
0.4
2.9
3.4
2.3
1.7
0.2
0.3
0.3
0.2
0.7
0.9
0.8
1.0
0.8
1.2
0.5
0.8
3.5
4.2
3.0
3.3
0.9
0.7
0.6
0.7
2.3
2.7
2.6
3.0
0.3
1.9
-0.1
1.7
2.2
3.3
2.8
3.8
1.2
0.0
0.0
:
3.2
2.1
1.6
:
0.2
0.2
0.8
0.5
0.8
0.8
1.8
1.7
1.5
1.8
0.5
1.1
4.7
6.2
4.6
5.0
0.4
0.4
0.3
0.4
1.4
1.6
1.4
1.3
0.3
0.2
0.1
-0.1
1.3
1.1
0.8
0.4
1.1
1.0
0.6
1.0
4.1
3.8
3.5
3.8
0.6
0.9
0.1
0.8
2.2
1.9
2.4
2.5
0.0
-1.9
-0.1
0.0
1.4
-1.4
-1.1
-2.0
1.2
0.7
1.1
1.8
1.7
1.7
3.5
4.8
0.3
0.2
0.2
0.2
0.9
0.8
0.9
0.9
0.0
0.4
0.8
0.4
0.5
0.6
1.2
1.6
0.6
1.1
-0.1
1.6
2.2
2.2
2.0
3.3
0.7
-0.9
3.7
-3.0
1.0
2.3
3.7
0.3
1.2
-0.6
0.4
0.7
2.3
2.0
1.9
1.6
-0.4
0.5
0.6
1.9
0.9
1.0
0.7
2.6
1.1
0.1
0.5
0.4
2.3
2.0
2.7
2.1
GDP and expenditure components seasonally adjusted, chain-linked volumes
Percentage change compared with the previous quarter
Percentage change compared with the same quarter of
the previous year
Euro area
EU
Euro area
EU
0.3
0.4
1.2
1.4
0.2
0.3
1.1
1.3
0.0
0.1
0.6
0.9
0.6
0.7
1.2
1.4
0.2
0.2
1.3
1.5
0.5
0.6
1.2
1.4
0.1
0.1
1.0
1.1
0.4
0.4
1.2
1.2
0.7
0.7
1.4
1.6
0.5
0.6
1.6
1.8
0.5
0.5
2.3
2.6
0.2
0.1
1.9
2.0
1.0
1.2
3.0
3.0
0.7
0.9
2.9
2.8
-0.2
-0.3
0.3
0.7
-0.1
0.5
1.4
2.3
0.6
0.8
2.3
2.7
0.4
0.5
2.2
2.6
-0.6
-0.3
-0.1
0.7
3.4
3.2
3.9
4.2
1.1
1.1
3.6
3.7
0.4
0.4
3.6
3.6
0.6
0.7
1.9
2.4
1.5
1.6
3.6
3.9
Contribution of expenditure components to change of GDP
seasonally adjusted, chain-linked volumes
Contribution in percentage points to GDP change compared with the previous quarter
Contribution in percentage points to GDP change compared with the same quarter of the previous year
Euro area
EU
Euro area
EU
0.1
0.1
0.7
0.8
0.3
0.3
0.7
0.7
0.0
0.0
0.5
0.6
0.2
0.2
0.6
0.7
0.1
0.1
0.3
0.4
0.1
0.1
0.3
0.4
0.1
0.1
0.5
0.6
0.0
0.0
0.4
0.4
0.2
0.3
0.6
0.6
0.1
0.2
0.6
0.6
0.0
-0.1
0.1
0.1
0.0
0.1
0.3
0.5
0.0
0.0
0.0
0.0
-0.4
-0.4
0.0
-0.1
0.4
0.4
0.4
0.3
-0.5
-0.5
-0.4
-0.5
0.3
0.4
1.1
1.4
0.2
0.2
1.1
1.3
-0.3
-0.1
-0.1
0.4
1.6
1.6
1.9
2.1
-0.5
-0.5
-1.6
-1.7
-0.2
-0.2
-1.6
-1.7
-0.3
-0.3
-0.8
-1.1
-0.7
-0.7
-1.6
-1.8
Growth rates of employment in persons*
Percentage change compared with the previous quarter
Percentage change compared with the same quarter of the previous year
2025Q3
2025Q4
2026Q1
2026Q2
2025Q3
2025Q4
2026Q1
2026Q2
0.2
0.2
0.1
0.1
0.6
0.7
0.5
0.5
0.1
0.2
0.0
0.1
0.5
0.6
0.5
0.4
0.0
0.0
0.1
0.1
0.4
0.3
0.2
0.3
0.2
0.3
-0.1
-0.2
2.3
2.5
1.2
-0.4
0.3
0.3
0.1
0.9
1.4
1.4
1.1
1.5
0.3
0.3
0.2
0.2
1.0
1.0
0.9
1.0
-0.1
-0.1
-0.1
-0.1
-0.2
-0.3
-0.4
-0.5
0.6
-1.8
0.9
0.5
1.0
-1.1
0.3
0.1
-0.1
1.0
-0.6
0.3
0.9
1.9
0.0
0.7
0.0
0.3
0.1
-0.4
1.1
0.9
0.5
0.1
0.7
0.7
0.3
0.5
2.7
2.6
2.6
2.3
-0.1
0.1
0.0
0.0
0.0
0.1
0.0
0.0
1.2
0.2
-0.1
0.0
1.6
1.8
1.2
1.1
0.2
0.4
0.5
0.3
0.6
1.2
1.2
1.4
0.5
0.7
0.0
0.5
1.4
2.0
2.0
1.6
0.6
0.6
0.1
-0.1
-0.5
1.3
1.3
1.1
1.0
-2.3
1.8
-0.1
-0.3
-1.9
-0.3
-0.1
0.5
0.4
0.4
0.6
1.4
1.5
1.6
1.8
0.2
0.2
0.1
0.2
0.5
0.6
0.5
0.6
1.0
1.0
1.3
0.9
3.7
4.3
4.7
4.4
0.2
-0.3
0.1
-0.1
0.8
0.4
0.1
-0.2
-0.1
0.0
-0.2
0.0
-0.1
0.0
-0.2
-0.2
0.2
0.3
0.1
-0.2
0.7
0.7
1.3
0.2
0.9
0.5
-0.2
1.0
2.7
2.8
1.9
2.2
-1.2
1.3
-1.1
-0.2
-2.5
-2.5
-1.2
-1.3
0.1
0.1
0.2
0.0
-0.4
-0.2
0.4
0.3
-0.1
0.1
-0.1
0.1
-0.2
-0.2
-0.1
0.0
0.0
0.2
-0.2
-0.8
-0.8
0.1
0.1
-0.9
0.0
0.1
0.1
0.1
0.0
0.3
0.4
0.5
0.3
-0.1
0.4
0.3
0.6
0.1
0.7
0.8
0.1
0.2
0.2
0.2
0.6
0.6
0.6
0.7
-0.1
0.0
0.3
0.5
0.4
0.1
0.1
0.8
Notes for users
Revisions
Flash estimates of employment and GDP growth were published in the Euro indicators release issued on 14 August 2026. They were based on a more limited data set than the one used for the present release and additionally, on preliminary estimates that have now been revised by some Member States. Revisions for the last quarter are highlighted in bold in the table below:
To the previous quarter (Q/Q-1)
To the previous year (Q/Q-4)
Previous
Current
Previous
Current
Euro area
EU
Euro area
EU
Euro area
EU
Euro area
EU
0.4
0.5
0.6
0.7
1.0
1.2
1.2
1.4
0.1
0.1
0.1
0.1
0.5
0.5
0.5
0.4
With this release, euro area and EU employment and GDP figures for earlier quarters are also revised.
All estimates presented in this release may be revised with the database update scheduled for 20 October 2026.
Revisions of quarterly GDP estimates are continuously monitored. Further information can be found on Eurostat website.
Release schedule
This news release presents estimates for euro area and EU GDP and employment based on national accounts transmissions from all Member States due after t+2 months.
A further estimation is done at around t+110 days after some countries transmit updated estimates.
To increase the timeliness of key indicators, Eurostat also publishes flash estimates for GDP (after around 30 and 45 days) and employment (after around 45 days). The flash estimates are based on estimates provided by most EU Member States on a voluntary basis.
Methods and definitions
European quarterly national accounts are compiled in accordance with the European System of Accounts 2010 (ESA 2010). They include key policy indicators on GDP and employment.
Gross domestic product (GDP) at market prices measures the production activity of resident producer units. Growth rates are based on chain-linked volumes.
Employment covers employees and self-employed working in resident production units (domestic concept). Employment flash estimates are limited to total employment in persons, but regular estimates also cover hours worked and industry breakdowns.
Geographical information
Euro area (EA21): Belgium, Bulgaria, Germany, Estonia, Ireland, Greece, Spain, France, Croatia, Italy, Cyprus, Latvia, Lithuania, Luxembourg, Malta, the Netherlands, Austria, Portugal, Slovenia, Slovakia and Finland.
European Union (EU27): Belgium, Bulgaria, Czechia, Denmark, Germany, Estonia, Ireland, Greece, Spain, France, Croatia, Italy, Cyprus, Latvia, Lithuania, Luxembourg, Hungary, Malta, the Netherlands, Austria, Poland, Portugal, Romania, Slovenia, Slovakia, Finland and Sweden.
For more information