

Overview
At the end of the second quarter of 2026, the general government gross debt to GDP ratio in the euro area (EA21) stood at 88.8%, an increase compared with 88.4% at the end of the first quarter of 2026. In the EU, the ratio also increased from 82.5% to 82.9%.
Compared with the second quarter of 2025, the government debt to GDP ratio increased in both the euro area (from 87.3% to 88.8%) and the EU (from 81.4% to 82.9%).
At the end of the second quarter of 2026, the general government debt was made up of 84.5% debt securities in the euro area and 83.9% in the EU, 13.1% loans in the euro area and 13.8% in the EU and 2.4% currency and deposits in both the euro area and the EU.
Due to the involvement of EU Member States’ governments in lending to certain Member States, quarterly data on intergovernmental lending (IGL) are also published. The IGL as percentage of GDP at the end of the second quarter of 2026 stood at 1.3% in the euro area and at 1.1% in the EU.
These data are released by Eurostat, the statistical office of the European Union.
Euro area and EU general government gross debt
2025Q2
2026Q1p
2026Q2p
Euro area
(million euro)
13 705 629
14 245 798
14 438 114
(% of GDP)
87.3
88.4
88.8
(million euro)
347 121
356 562
345 843
(% of total debt)
2.5
2.5
2.4
(million euro)
11 542 693
12 005 756
12 204 655
(% of total debt)
84.2
84.3
84.5
(million euro)
1 815 815
1 883 481
1 887 616
(% of total debt)
13.2
13.2
13.1
(million euro)
217 984
209 208
206 730
(% of GDP)
1.4
1.3
1.3
EU
(million euro)
15 048 285
15 707 443
15 950 729
(% of GDP)
81.4
82.5
82.9
(million euro)
373 975
386 077
376 208
(% of total debt)
2.5
2.5
2.4
(million euro)
12 590 379
13 138 420
13 378 271
(% of total debt)
83.7
83.6
83.9
(million euro)
2 083 929
2 182 948
2 196 250
(% of total debt)
13.8
13.9
13.8
(million euro)
217 984
209 208
206 730
(% of GDP)
1.2
1.1
1.1
Government debt at the end of the second quarter of 2026 by Member State
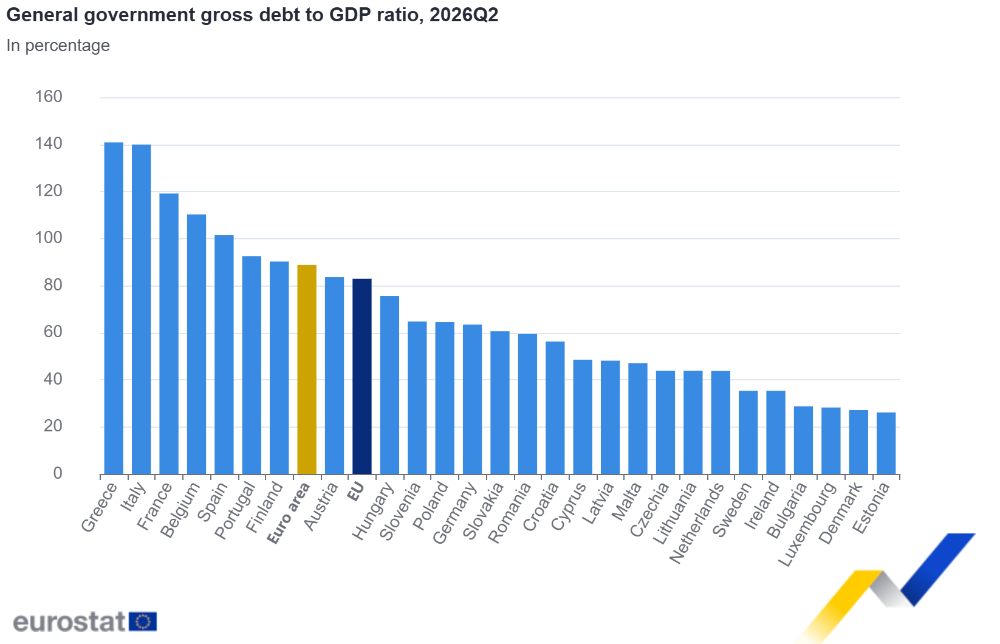
The highest ratios of government debt to GDP at the end of the second quarter of 2026 were recorded in Greece (140.8%), Italy (139.9%), France (119.1%), Belgium (110.2%) and Spain (101.4%), and the lowest ratios were recorded in Estonia (26.1%), Denmark (27.1%), Luxembourg (28.2%) and Bulgaria (28.7%).
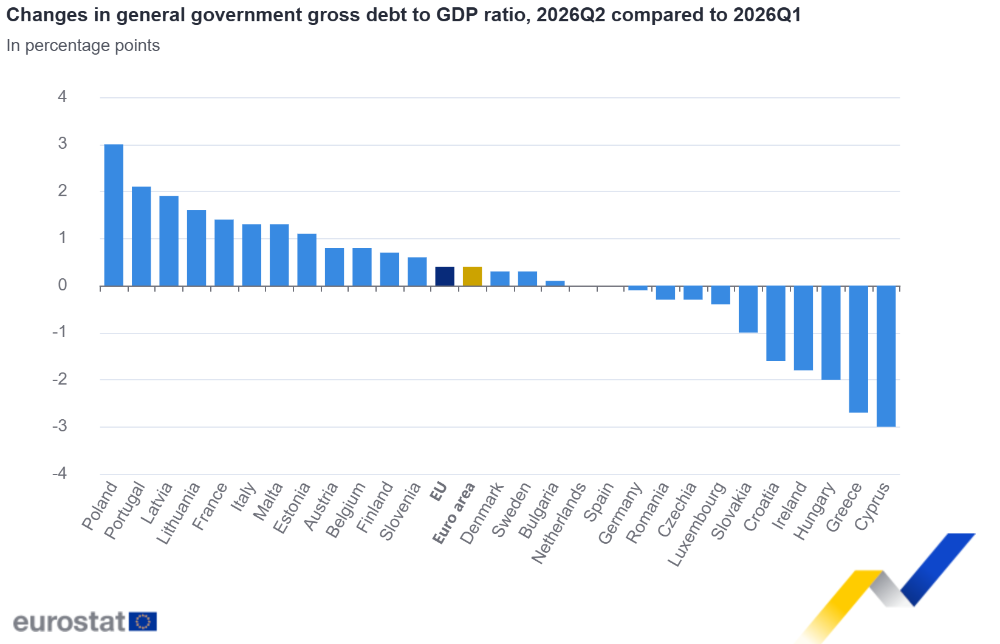
Compared with the first quarter of 2026, fifteen Member States registered an increase in their debt to GDP ratio at the end of the second quarter of 2026, ten registered a decrease, and the ratio remained stable in the Netherlands and Spain. The largest increases in the ratio were observed in Poland (+3.0 percentage points – pp), Portugal (+2.1 pp), Latvia (+1.9 pp), Lithuania (+1.6 pp), France (+1.4 pp), Italy and Malta (both +1.3 pp) and Estonia (+1.1 pp). The largest decreases were recorded in Cyprus (-3.0 pp), Greece (-2.7 pp), Hungary (-2.0 pp), Ireland (-1.8 pp), Croatia (-1.6 pp) and Slovakia (-1.0 pp).
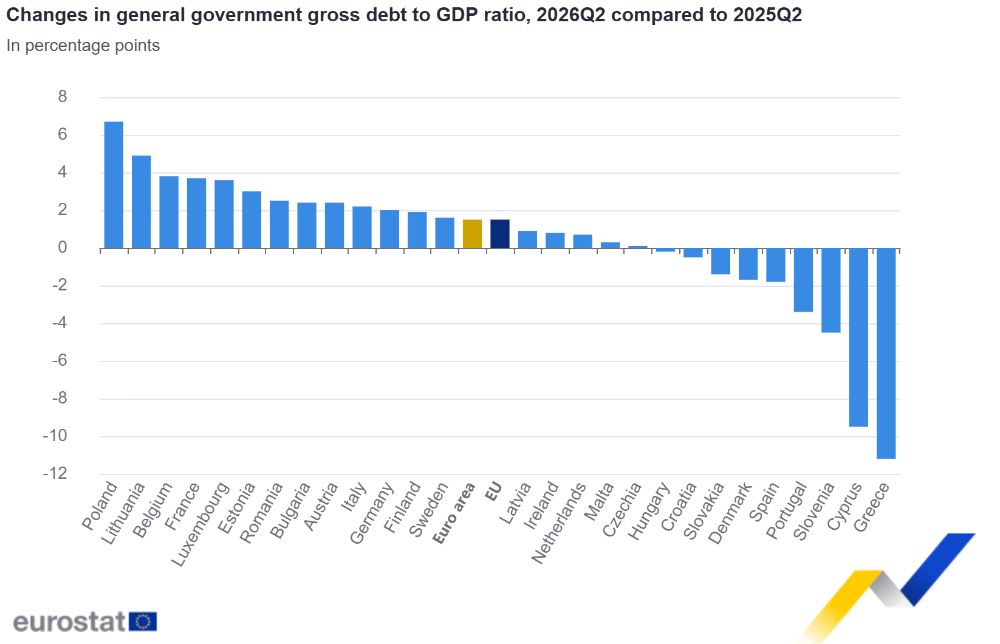
Compared with the second quarter of 2025, eighteen Member States registered an increase in their debt to GDP ratio at the end of the second quarter of 2026 and nine Member States registered a decrease. The largest increases in the ratio were recorded in Poland (+6.7 pp), Lithuania (+4.9 pp), Belgium (+3.8 pp), France (+3.7 pp), Luxembourg (+3.6 pp), and Estonia (+3.0 pp). The largest decreases were observed in Greece (-11.2 pp), Cyprus (-9.5 pp), Slovenia (-4.5 pp) and Portugal (-3.4 pp).
Tables
General government gross debt by Member State
General government gross debt
Millions of national currency
% of GDP
Difference in pp of GDP 2026Q2p compared with:
2025Q2
2026Q1p
2026Q2p
2025Q2
2026Q1p
2026Q2p
2025Q2
2026Q1p
EUR
13 705 629
14 245 798
14 438 114
87.3
88.4
88.8
1.5
0.4
EUR
15 048 285
15 707 443
15 950 729
81.4
82.5
82.9
1.5
0.4
EUR
670 114
707 143
719 077
106.4
109.4
110.2
3.8
0.8
EUR*
28 386
34 395
35 396
26.3
28.6
28.7
2.4
0.1
CZK
3 627 252
3 827 516
3 842 374
43.7
44.1
43.8
0.1
-0.3
DKK
884 929
839 692
857 358
28.8
26.8
27.1
-1.7
0.3
EUR
2 734 013
2 902 263
2 924 674
61.4
63.5
63.4
2.0
-0.1
EUR
9 468
10 636
11 259
23.1
25.0
26.1
3.0
1.1
EUR
207 211
215 414
205 850
34.4
37.0
35.3
0.8
-1.8
EUR
368 613
360 123
358 647
152.0
143.5
140.8
-11.2
-2.7
EUR
1 690 911
1 739 641
1 762 936
103.2
101.4
101.4
-1.8
0.0
EUR
3 417 162
3 535 929
3 595 525
115.4
117.7
119.1
3.7
1.4
EUR
50 925
55 217
54 729
56.7
57.8
56.2
-0.5
-1.6
EUR
3 072 197
3 159 453
3 208 524
137.6
138.6
139.9
2.2
1.3
EUR
21 703
20 034
19 203
58.1
51.5
48.5
-9.5
-3.0
EUR
19 770
20 428
21 634
47.1
46.2
48.1
0.9
1.9
EUR
32 007
36 453
38 771
38.9
42.1
43.8
4.9
1.6
EUR
21 797
26 450
26 547
24.6
28.6
28.2
3.6
-0.4
HUF
63 981 921
68 980 022
67 863 758
75.8
77.6
75.6
-0.2
-2.0
EUR
11 086
11 461
11 977
46.7
45.7
47.0
0.3
1.3
EUR
491 517
517 377
523 795
43.0
43.8
43.7
0.7
0.0
EUR
412 517
431 684
438 856
81.2
82.7
83.6
2.4
0.8
PLN
2 186 148
2 444 285
2 598 330
57.8
61.6
64.5
6.7
3.0
EUR
287 146
282 983
293 726
95.9
90.4
92.5
-3.4
2.1
RON
1 039 857
1 169 870
1 196 438
57.0
59.7
59.4
2.5
-0.3
EUR
47 625
46 323
47 707
69.2
64.1
64.7
-4.5
0.6
EUR
83 475
86 784
86 423
61.9
61.6
60.6
-1.4
-1.0
EUR
245 967
254 813
259 585
88.3
89.5
90.2
1.9
0.7
SEK
2 199 844
2 348 383
2 395 981
33.8
35.0
35.3
1.6
0.3
NOK
2 303 056
2 711 042
3 427 445
41.8
49.1
60.8
19.1
11.7
General government gross debt by Member State
Components of general government gross debt, in % of GDP
IGL (assets)
Currency and deposits
Debt Securities
Loans
% of GDP
2026Q2p
2026Q2p
2026Q2p
2026Q2p
2.1
75.1
11.6
1.3
2.0
69.5
11.4
1.1
0.2
95.8
14.2
1.2
1.5
23.4
3.8
0.0
0.4
40.1
3.3
0.0
0.5
24.6
2.0
0.0
0.3
50.6
12.5
1.3
0.2
16.2
9.7
1.1
4.3
23.7
7.3
0.3
3.0
39.5
98.3
0.0
0.3
90.4
10.6
1.5
1.4
106.9
10.7
1.5
0.1
41.6
14.5
0.0
8.1
117.5
14.2
1.7
0.5
29.3
18.8
0.7
1.8
43.6
2.7
0.0
0.6
35.2
8.0
0.0
0.4
24.3
3.5
0.6
0.7
67.1
7.7
0.0
1.6
41.6
3.9
0.8
0.1
37.7
5.9
1.1
0.4
74.5
8.7
1.3
0.3
47.7
16.5
0.0
16.6
55.1
20.8
0.1
1.2
47.6
10.7
0.0
0.3
54.5
9.9
1.4
0.1
54.5
5.9
1.4
0.2
69.7
20.3
1.7
2.9
20.5
11.9
0.0
–
16.7
44.1
–
Notes for users
Methods and definitions
Quarterly data on government debt are collected from the Member States according to European System of Accounts (ESA 2010), see Annex B, ESA 2010 transmission programme, and refer to the Maastricht debt definition, used in the context of the Excessive Deficit Procedure (EDP). Annual EDP data, last notified in October 2026, are the subject of a thorough verification by Eurostat.
The general government gross debt is defined as the consolidated gross debt of the whole general government sector outstanding at the end of the quarter (at face value). General government debt consists of liabilities of general government in the following financial instruments: currency and deposits (AF.2), debt securities (AF.3) and loans (AF.4), as defined in ESA 2010.
The debt to GDP ratio is calculated for each quarter using the sum of quarterly GDP for the four last quarters. Quarterly data on GDP are the most recent ones transmitted by the EU Member States. While quarterly debt figures are consistent with annual debt figures at coinciding publications, differences between annual and quarterly GDP figures affecting the debt to GDP ratio occur for Bulgaria, Greece and Poland.
For the purpose of proper consolidation of general government debt and to provide users with information, Eurostat publishes data on government loans (IGL) to other EU governments. The concepts and definitions are based on ESA 2010 and on the rules relating to the statistics for the EDP. The data covered is the stock of loans and partly deposits related to claims on other EU Member States, including loans made through the European Financial Stability Facility (EFSF). The valuation basis is the stock of loans at face value outstanding at end of each quarter. From the first quarter of 2011 onwards, the intergovernmental lending figures relate mainly to lending to Greece, Ireland and Portugal and include loans made by the EFSF.
For stock data such as general government debt, end of period exchange rates are used in the compilation of the EU aggregates. For flow data, such as GDP, average exchange rates are used. The EU aggregates, denominated in euro, can fluctuate as a result of exchange rate movements between the euro and other EU currencies.
All quarterly government finance statistics data for the first and second quarter of 2026 have been labelled provisional.
Country-specific metadata are published.
Geographical Information
Euro area (EA21): Belgium, Bulgaria, Germany, Estonia, Ireland, Greece, Spain, France, Croatia, Italy, Cyprus, Latvia, Lithuania, Luxembourg, Malta, the Netherlands, Austria, Portugal, Slovenia, Slovakia and Finland.
European Union (EU 27): Belgium, Bulgaria, Czechia, Denmark, Germany, Estonia, Ireland, Greece, Spain, France, Croatia, Italy, Cyprus, Latvia, Lithuania, Luxembourg, Hungary, Malta, the Netherlands, Austria, Poland, Portugal, Romania, Slovenia, Slovakia, Finland and Sweden.
For more information