

Aug 22, 2025
IndexBox has just published a new report: United Kingdom – Silver Including Silver Plated With Gold Or Platinum – Market Analysis, Forecast, Size, Trends and Insights.
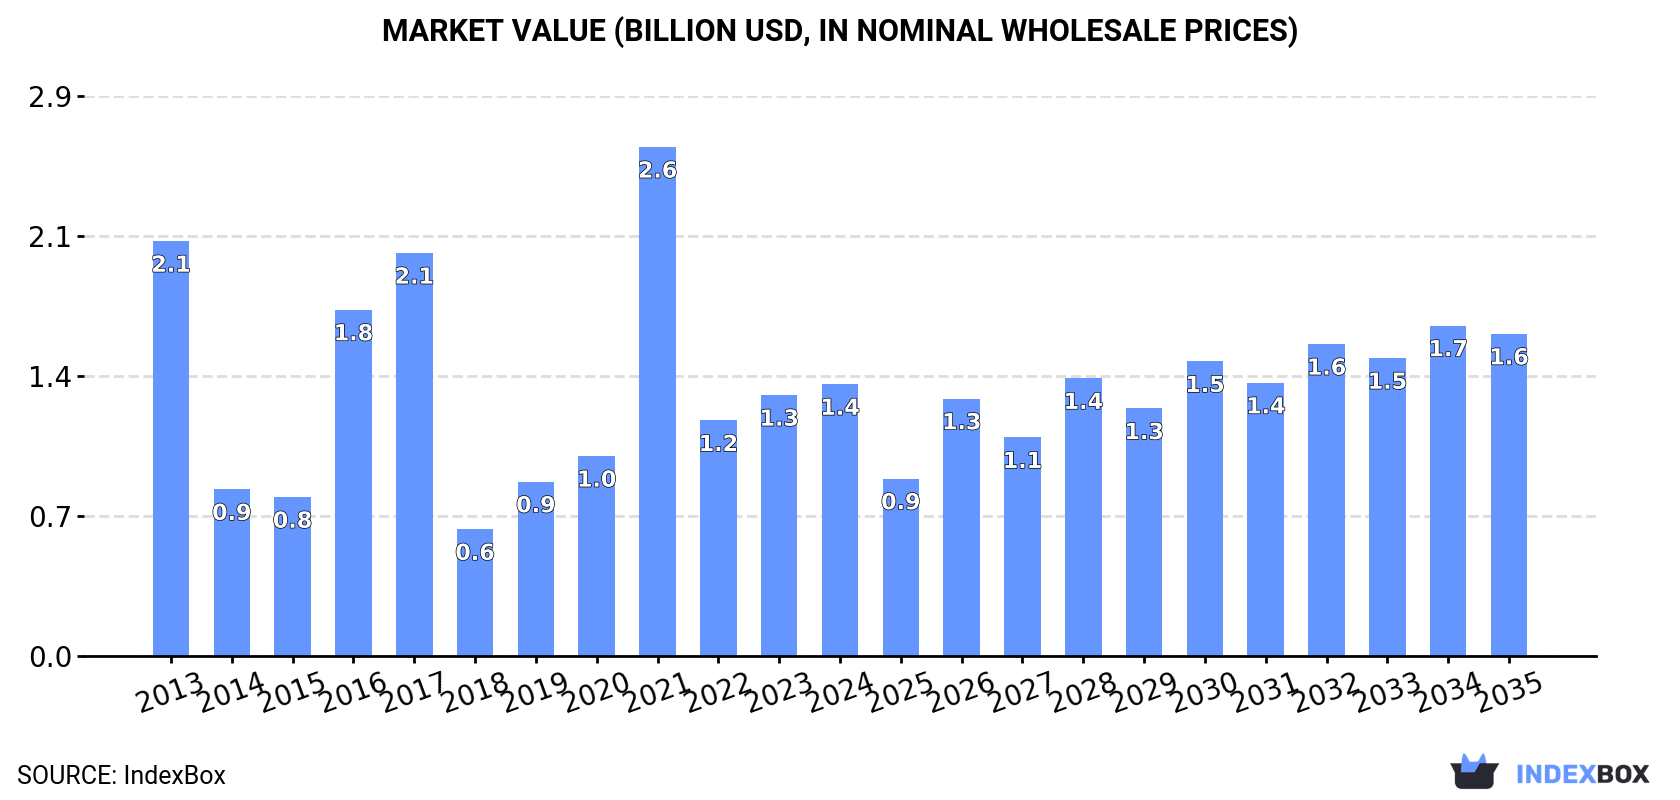
The silver market in the UK is anticipated to experience a gradual increase in both volume and value over the next decade, with a forecasted CAGR of +1.3% in volume and +1.6% in value. By the end of 2035, the market volume is projected to reach 2K tons and the market value is expected to reach $1.6B in nominal prices.
Market Forecast
Driven by rising demand for silver in the UK, the market is expected to start an upward consumption trend over the next decade. The performance of the market is forecast to increase slightly, with an anticipated CAGR of +1.3% for the period from 2024 to 2035, which is projected to bring the market volume to 2K tons by the end of 2035.
In value terms, the market is forecast to increase with an anticipated CAGR of +1.6% for the period from 2024 to 2035, which is projected to bring the market value to $1.6B (in nominal wholesale prices) by the end of 2035.
 ConsumptionUnited Kingdom’s Consumption of Silver Including Silver Plated With Gold Or Platinum
In 2024, approx. 1.7K tons of silver including silver plated with gold or platinum were consumed in the UK; with a decrease of -8.3% against the previous year. Over the period under review, consumption recorded a mild curtailment. Silver consumption peaked at 4.1K tons in 2017; however, from 2018 to 2024, consumption remained at a lower figure.
The revenue of the silver market in the UK rose slightly to $1.4B in 2024, surging by 4.2% against the previous year. This figure reflects the total revenues of producers and importers (excluding logistics costs, retail marketing costs, and retailers’ margins, which will be included in the final consumer price). In general, consumption recorded a perceptible curtailment. As a result, consumption reached the peak level of $2.6B. From 2022 to 2024, the growth of the market remained at a somewhat lower figure.
ProductionUnited Kingdom’s Production of Silver Including Silver Plated With Gold Or Platinum
In 2024, production of silver including silver plated with gold or platinum in the UK shrank to 857 tons, falling by -8.3% on the year before. Overall, production, however, saw a strong increase. The growth pace was the most rapid in 2022 with an increase of 24,175%. As a result, production attained the peak volume of 11K tons. From 2023 to 2024, production growth remained at a somewhat lower figure.
In value terms, silver production amounted to $649M in 2024 estimated in export price. Over the period under review, production, however, posted resilient growth. The most prominent rate of growth was recorded in 2022 when the production volume increased by 21,224%. As a result, production reached the peak level of $7.1B. From 2023 to 2024, production growth remained at a somewhat lower figure.
ImportsUnited Kingdom’s Imports of Silver Including Silver Plated With Gold Or Platinum
In 2024, imports of silver including silver plated with gold or platinum into the UK rose significantly to 5.1K tons, increasing by 8% compared with 2023. Overall, imports, however, continue to indicate a mild reduction. The most prominent rate of growth was recorded in 2021 with an increase of 83% against the previous year. As a result, imports reached the peak of 7.7K tons. From 2022 to 2024, the growth of imports failed to regain momentum.
In value terms, silver imports soared to $4.4B in 2024. Over the period under review, imports, however, recorded a slight downturn. The growth pace was the most rapid in 2021 when imports increased by 125% against the previous year. As a result, imports reached the peak of $6.2B. From 2022 to 2024, the growth of imports failed to regain momentum.
Imports By Country
China (1.8K tons), Germany (1.1K tons) and Poland (548 tons) were the main suppliers of silver imports to the UK, together accounting for 66% of total imports.
From 2013 to 2024, the biggest increases were recorded for China (with a CAGR of +20.2%), while purchases for the other leaders experienced more modest paces of growth.
In value terms, China ($1.6B), Germany ($883M) and Poland ($492M) appeared to be the largest silver suppliers to the UK, together accounting for 68% of total imports.
China, with a CAGR of +21.6%, saw the highest rates of growth with regard to the value of imports, in terms of the main suppliers over the period under review, while purchases for the other leaders experienced more modest paces of growth.
Import Prices By Country
The average silver import price stood at $851,651 per ton in 2024, rising by 16% against the previous year. In general, the import price saw a relatively flat trend pattern. The most prominent rate of growth was recorded in 2020 an increase of 30% against the previous year. The import price peaked in 2024 and is likely to see gradual growth in the immediate term.
Prices varied noticeably by country of origin: amid the top importers, the country with the highest price was India ($1,002,638 per ton), while the price for the United States ($336,414 per ton) was amongst the lowest.
From 2013 to 2024, the most notable rate of growth in terms of prices was attained by India (+5.0%), while the prices for the other major suppliers experienced more modest paces of growth.
ExportsUnited Kingdom’s Exports of Silver Including Silver Plated With Gold Or Platinum
In 2024, approx. 4.3K tons of silver including silver plated with gold or platinum were exported from the UK; surging by 12% on 2023 figures. Over the period under review, exports, however, saw a relatively flat trend pattern. The pace of growth appeared the most rapid in 2022 when exports increased by 171%. As a result, the exports reached the peak of 12K tons. From 2023 to 2024, the growth of the exports remained at a lower figure.
In value terms, silver exports skyrocketed to $3.6B in 2024. In general, exports continue to indicate a mild expansion. The most prominent rate of growth was recorded in 2020 when exports increased by 215% against the previous year. The exports peaked at $8.1B in 2022; however, from 2023 to 2024, the exports stood at a somewhat lower figure.
Exports By Country
India (2.8K tons) was the main destination for silver exports from the UK, with a 65% share of total exports. Moreover, silver exports to India exceeded the volume sent to the second major destination, the United Arab Emirates (674 tons), fourfold. The third position in this ranking was held by the United States (370 tons), with an 8.7% share.
From 2013 to 2024, the average annual growth rate of volume to India amounted to -2.1%. Exports to the other major destinations recorded the following average annual rates of exports growth: the United Arab Emirates (+20.5% per year) and the United States (+23.4% per year).
In value terms, India ($2.4B) remains the key foreign market for silver including silver plated with gold or platinum exports from the UK, comprising 65% of total exports. The second position in the ranking was taken by the United Arab Emirates ($496M), with a 14% share of total exports. It was followed by the United States, with a 10% share.
From 2013 to 2024, the average annual rate of growth in terms of value to India was relatively modest. Exports to the other major destinations recorded the following average annual rates of exports growth: the United Arab Emirates (+25.8% per year) and the United States (+27.6% per year).
Export Prices By Country
The average silver export price stood at $848,360 per ton in 2024, surging by 15% against the previous year. Over the period under review, export price indicated tangible growth from 2013 to 2024: its price increased at an average annual rate of +2.4% over the last eleven-year period. The trend pattern, however, indicated some noticeable fluctuations being recorded throughout the analyzed period. Based on 2024 figures, silver export price increased by +3.3% against 2021 indices. The pace of growth was the most pronounced in 2020 an increase of 35% against the previous year. Over the period under review, the average export prices hit record highs in 2024 and is likely to continue growth in years to come.
Average prices varied somewhat for the major external markets. In 2024, amid the top suppliers, the highest price was recorded for prices to the United States ($1,001,885 per ton) and Belgium ($971,719 per ton), while the average price for exports to Spain ($669,344 per ton) and Turkey ($726,144 per ton) were amongst the lowest.
From 2013 to 2024, the most notable rate of growth in terms of prices was recorded for supplies to Spain (+6.5%), while the prices for the other major destinations experienced more modest paces of growth.