
Drunk driving deaths in America are often described as tragic but inevitable, a stubborn reality of car culture, nightlife, and human error. But the data tells a far less comforting story. Where you live can dramatically shape your odds of dying in an alcohol-related crash.
In some major U.S. cities, drunk drivers are involved in fewer than 5% of fatal crashes. In others, they account for more than one in three. That is not a marginal difference. It is a gulf that suggests local decisions, enforcement priorities, infrastructure, and community norms may matter far more than we assume.
If federal law sets the legal limit at 0.08 nationwide, why do outcomes vary so sharply from city to city? Why does one metropolitan area keep DUI-related deaths comparatively rare, while another sees them become a defining feature of its fatal crash statistics?
The following analysis of federal crash data from 2019 to 2023 reveals a stark divide across America’s 50 largest cities. Western and Sunbelt metros dominate the list of the most dangerous places for alcohol-related fatal crashes, while Northeastern cities consistently rank among the safest. The disparities are not subtle, and they are not random.
What emerges is a picture of preventable loss, uneven accountability, and clear evidence that some cities have found ways to reduce drunk driving deaths, while others have not.
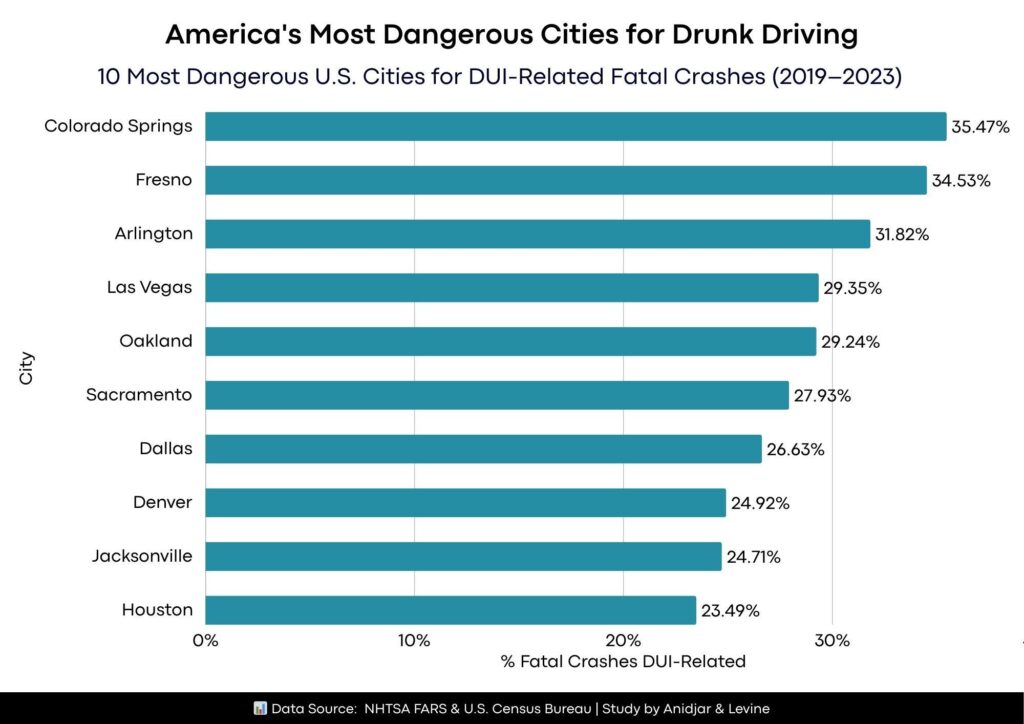
Colorado Springs, America’s most dangerous city for drunk driving, records 35.47% of all fatal crashes involving alcohol-impaired drivers, more than eight times the rate of the safest city at just 4.14%.Western and Sunbelt cities dominate the danger list, with nine of the 10 most dangerous cities for DUI-related fatalities located in the West, Southwest, or South, while Northeastern cities consistently rank among the safest.The three safest major cities, Philadelphia, Miami, and Columbus, each record DUI-related fatal crash rates below 7%, demonstrating that drunk driving deaths are not inevitable in America’s largest metropolitan areas.
In Colorado Springs, more than one in three fatal crashes involves a drunk driver. In Philadelphia, it’s fewer than one in 25. Same country, same federal highways, same legal drinking age, yet an 8.6-fold difference in outcomes. The difference wasn’t luck. It was the location.
The study, conducted by Anidjar & Levine, analyzed National Highway Traffic Safety Administration (NHTSA) fatal crash data from 2019–2023 across the 50 most populous U.S. cities, examining the percentage of fatal crashes involving alcohol-impaired drivers (BAC of 0.08 g/dL or higher). The primary metric was calculated by dividing average annual DUI fatalities by average annual total fatal crashes for each city.
America’s Most Dangerous Cities for Drunk Driving
10 Most Dangerous U.S. Cities for DUI-Related Fatal Crashes (2019–2023)
RankCityState% Fatal Crashes DUI-RelatedAvg. Annual DUI Fatalities1Colorado SpringsColorado35.47%172FresnoCalifornia34.53%213ArlingtonTexas31.82%114Las VegasNevada29.35%115OaklandCalifornia29.24%106SacramentoCalifornia27.93%167DallasTexas26.63%528DenverColorado24.92%169JacksonvilleFlorida24.71%3810HoustonTexas23.49%66
The nation’s most dangerous city records more than one in three fatal crashes involving alcohol, nearly 1 percentage points higher than the second-ranked city and more than double the national average.
Expert Commentary
Looking at the study, a spokesperson from Anidjar & Levine commented:
“These findings reveal that drunk driving fatalities are not inevitable, they’re preventable. The dramatic differences between cities, even within the same state, show that local enforcement, infrastructure, and community awareness programs can save lives. Every percentage point reduction represents families spared from tragedy.”
America’s Safest Major Cities for Drunk Driving
10 Safest Major U.S. Cities for DUI-Related Fatal Crashes (2019–2023)
RankCityState% Fatal Crashes DUI-RelatedAvg. Annual DUI Fatalities50PhiladelphiaPennsylvania4.14%549MiamiFlorida6.01%448ColumbusOhio6.83%647AtlantaGeorgia6.97%646ChicagoIllinois7.44%1345TulsaOklahoma7.69%544New York CityNew York7.84%1843MilwaukeeWisconsin7.96%542MemphisTennessee8.32%1641Fort WorthTexas8.33%9
The safest city records a DUI rate less than one-eighth that of the most dangerous, averaging only five alcohol-related fatalities per year despite being the nation’s sixth-largest city.
States with Multiple Major Cities: Combined Death Toll Comparison
States with Multiple Cities: DUI Fatality Comparison (2019–2023)
StateCitiesCombined Avg. Annual DUI DeathsMost Dangerous City (% DUI)Safest City (% DUI)Texas7200Arlington (31.82%)Fort Worth (8.33%)California9129Fresno (34.53%)Los Angeles (10.69%)Arizona376Mesa (23.08%)Tucson (16.44%)Florida348Jacksonville (24.71%)Miami (6.01%)Colorado233Colorado Springs (35.47%)Denver (24.92%)
One state’s seven major cities combine for 200 DUI fatalities annually, more than one-third of the 731 deaths across all 50 cities studied. Within-state variation is dramatic, with neighboring cities in the same metropolitan area recording rates nearly four times apart, underscoring that municipal factors outweigh state-level policies.
The Pandemic Effect: How 2021 Became the Deadliest Year
Year-Over-Year DUI Fatalities Across 50 Major U.S. Cities (2019–2023)
YearTotal DUI FatalitiesYear-Over-Year ChangeChange from 2019 Baseline2019539——2020726+25.2%+25.2%2021905+25.5%+57.1%2022659-11.9%+38.4%2023453-31.3%-4.8%
The deadliest year recorded 748 DUI fatalities, a 57% increase from the pre-pandemic baseline, as emptier roads encouraged riskier driving behavior. The 2023 total of 453 deaths marks the lowest in five years and the first drop below pre-pandemic levels, demonstrating that the surge was temporary and recovery is achievable.
Same State, Different Outcomes: The Local Factor
Within-State Contrasts: Most vs. Least Dangerous Cities by State
StateMost Dangerous CityDUI RateSafest CityDUI RateDifferenceFloridaJacksonville24.71%Miami6.01%4.1xTexasArlington31.82%Fort Worth8.33%3.8xCaliforniaFresno34.53%Los Angeles10.69%3.2xTennesseeNashville11.46%Memphis8.32%1.4xOklahomaOklahoma City11.11%Tulsa7.69%1.4x
Cities in the same state, operating under identical DUI laws, record rates differing by as much as 4.1 times, proving that local enforcement, transit availability, and urban design are decisive factors. These disparities suggest that high-risk cities could learn from safer in-state counterparts without requiring state-level policy changes.
Methodology
This analysis examined National Highway Traffic Safety Administration (NHTSA) Fatality Analysis Reporting System (FARS) data from January 1, 2019, through December 31, 2023 for the 50 largest U.S. cities, defining DUI-related crashes as fatal motor vehicle incidents involving at least one driver with a blood alcohol concentration of 0.08 g/dL. The primary metric was calculated by dividing average annual DUI fatalities by average annual total fatal crashes for each city.
Jordan French is the Founder and Executive Editor of Grit Daily Group , encompassing Financial Tech Times, Smartech Daily, Transit Tomorrow, BlockTelegraph, Meditech Today, High Net Worth magazine, Luxury Miami magazine, CEO Official magazine, Luxury LA magazine, and flagship outlet, Grit Daily. The champion of live journalism, Grit Daily’s team hails from ABC, CBS, CNN, Entrepreneur, Fast Company, Forbes, Fox, PopSugar, SF Chronicle, VentureBeat, Verge, Vice, and Vox. An award-winning journalist, he was on the editorial staff at TheStreet.com and a Fast 50 and Inc. 500-ranked entrepreneur with one sale. Formerly an engineer and intellectual-property attorney, his third company, BeeHex, rose to fame for its “3D printed pizza for astronauts” and is now a military contractor. A prolific investor, he’s invested in 50+ early stage startups with 10+ exits through 2023.