

If you are wondering whether Farmers & Merchants Bank of Long Beach is priced attractively at around US$8,435 per share, you are not alone. This article is built to help you frame that question clearly. The stock has been relatively steady in the short term, with a 0.2% 7 day decline and returns of 1.0% over 30 days, 1.9% year to date and 50.9% over the last year, plus 29.0% over 3 years and 24.3% over 5 years. Recent coverage of Farmers & Merchants Bank of Long Beach has focused on its position as a long established community bank and on how investors view traditional banks compared with other financial names. This helps frame why a stock with modest recent short term moves can still attract attention. Commentary has also highlighted how thinly traded over the counter names can see sentiment shift quickly when new information or renewed interest appears. Despite that backdrop, the company currently scores 0 out of 6 on our undervaluation checks. Next we will walk through the standard valuation tools investors often rely on and then finish with a more rounded way to think about what this price might really mean.
Farmers & Merchants Bank of Long Beach scores just 0/6 on our valuation checks. See what other red flags we found in the full valuation breakdown.
Approach 1: Farmers & Merchants Bank of Long Beach Excess Returns Analysis
The Excess Returns model asks a simple question: Is Farmers & Merchants Bank of Long Beach earning more on its equity than it costs to fund that equity, and are those extra returns worth paying for at today’s price?
Here, the key building blocks are a Book Value of $11,620.52 per share and a Stable EPS estimate of $500.67 per share, based on the median return on equity from the past 5 years. The Stable Book Value used in the model is $11,098.15 per share, drawn from the median book value over the same period, and the Average Return on Equity is 4.51%.
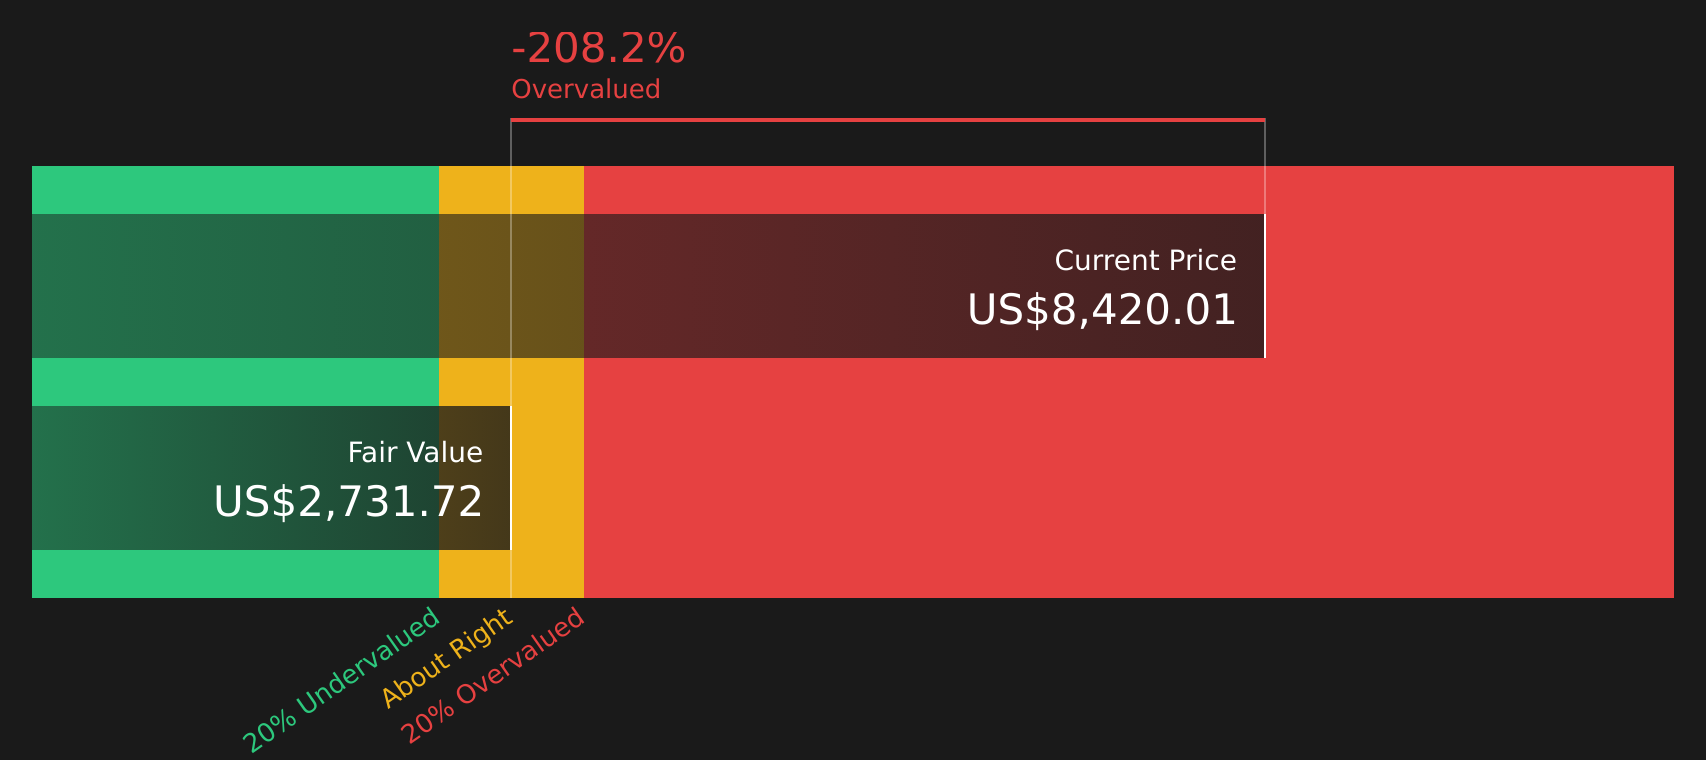
The model applies a Cost of Equity of $878.87 per share, which produces an Excess Return of $378.20 per share, meaning earnings used in the model do not fully cover the implied equity charge. When those excess returns are capitalised, the Excess Returns valuation points to an intrinsic value of about $2,710.60 per share.
Compared with the current share price of around $8,435, this framework suggests the stock is very richly priced, with an implied premium of about 211.2%.
Result: OVERVALUED
Our Excess Returns analysis suggests Farmers & Merchants Bank of Long Beach may be overvalued by 211.2%. Discover 54 high quality undervalued stocks or create your own screener to find better value opportunities.
 FMBL Discounted Cash Flow as at Feb 2026
Approach 2: Farmers & Merchants Bank of Long Beach Price vs Earnings
For a profitable company, the P/E ratio is a straightforward way to think about value because it ties the share price directly to the earnings that support it. In simple terms, the higher the P/E, the more you are paying for each dollar of earnings, which only tends to feel comfortable if you see those earnings as relatively resilient or expect them to grow.
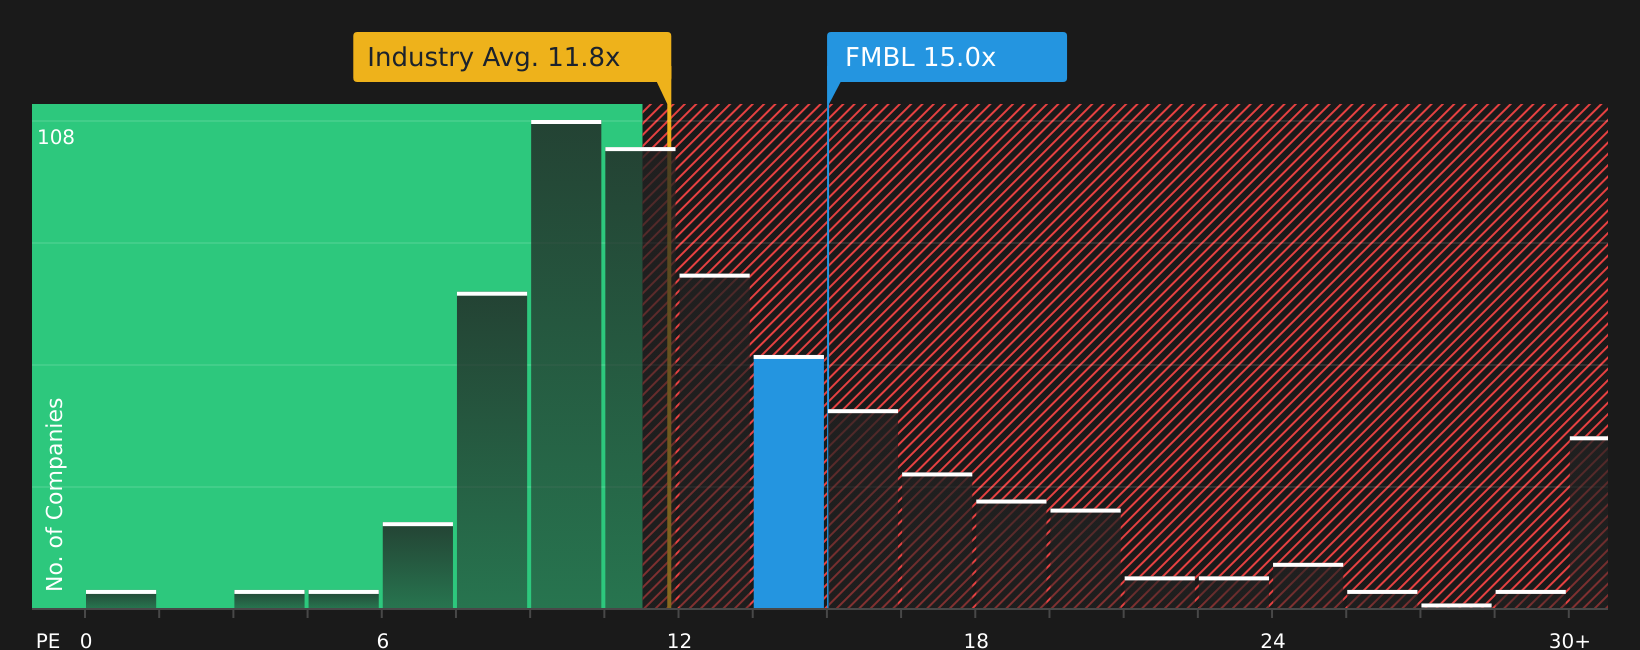
What counts as a “normal” P/E depends a lot on growth expectations and risk. Faster, more predictable earnings often justify a higher multiple, while a more uncertain or slower earnings profile usually lines up with a lower one. Farmers & Merchants Bank of Long Beach currently trades on a P/E of about 15.0x, compared with the Banks industry average of roughly 11.8x and a peer group average of around 14.4x.
Simply Wall St also uses a proprietary “Fair Ratio” for P/E, which is the multiple it would expect given factors such as earnings growth, profit margins, industry, market cap and risk profile. This can be more useful than just lining the stock up against peers or the industry because it adjusts for the company’s specific characteristics rather than assuming all banks deserve similar multiples. For Farmers & Merchants Bank of Long Beach, the current P/E of 15.0x sits above this Fair Ratio benchmark, which points to the shares looking expensive on this measure.
Result: OVERVALUED
 OTCPK:FMBL P/E Ratio as at Feb 2026
P/E ratios tell one story, but what if the real opportunity lies elsewhere? Start investing in legacies, not executives. Discover our 19 top founder-led companies.
Upgrade Your Decision Making: Choose your Farmers & Merchants Bank of Long Beach Narrative
Earlier we mentioned that there is an even better way to understand valuation, so let us introduce you to Narratives, which are simply your story about a company, backed by your own view of fair value and your estimates for future revenue, earnings and margins.
A Narrative connects three pieces in one place: the business story you believe, the financial forecast that flows from that story, and the fair value you get when you run those numbers.
On Simply Wall St, millions of investors build and share these Narratives on the Community page. There you can quickly see how your view of Farmers & Merchants Bank of Long Beach compares with others and how their assumed fair values line up against the current share price.
Because Narratives update when new information such as news or earnings is added to the platform, they can help you decide whether the current price looks attractive, stretched or somewhere in between based on your own expectations rather than a single static model. For example, one investor might see Farmers & Merchants Bank of Long Beach as worth far more than today’s US$8,435 price, while another might see fair value closer to the Excess Returns estimate of about US$2,710.60.
Do you think there’s more to the story for Farmers & Merchants Bank of Long Beach? Head over to our Community to see what others are saying!
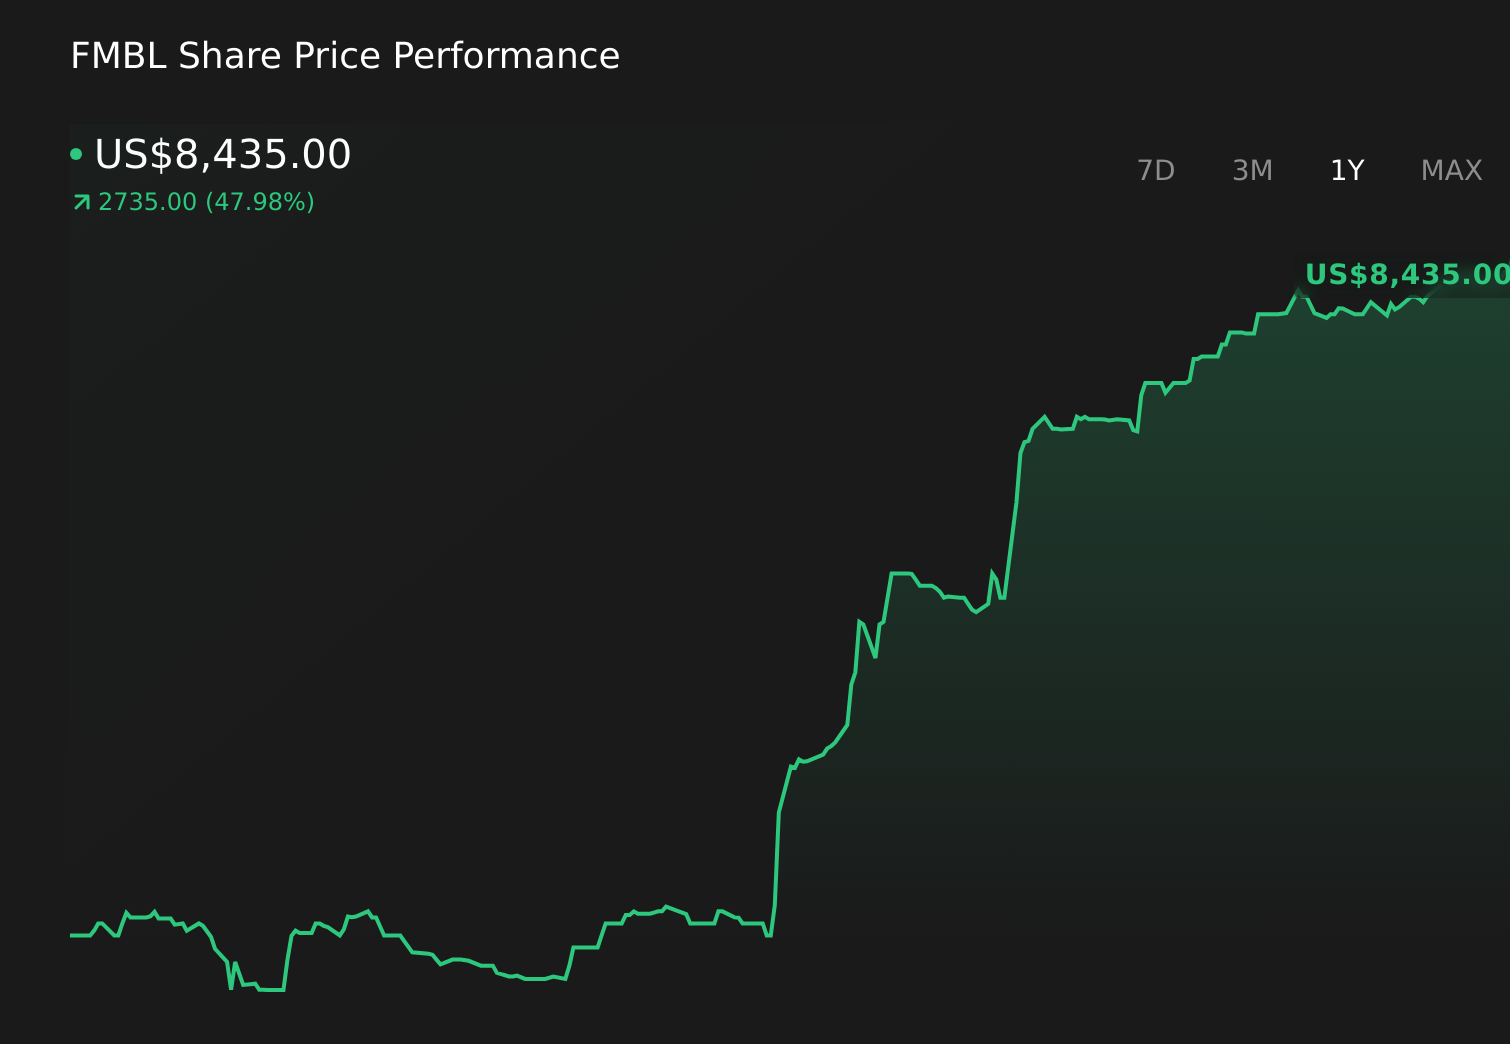 OTCPK:FMBL 1-Year Stock Price Chart
This article by Simply Wall St is general in nature. We provide commentary based on historical data
and analyst forecasts only using an unbiased methodology and our articles are not intended to be financial advice. It does not constitute a recommendation to buy or sell any stock, and does not take account of your objectives, or your
financial situation. We aim to bring you long-term focused analysis driven by fundamental data.
Note that our analysis may not factor in the latest price-sensitive company announcements or qualitative material.
Simply Wall St has no position in any stocks mentioned.
New: AI Stock Screener & Alerts
Our new AI Stock Screener scans the market every day to uncover opportunities.
• Dividend Powerhouses (3%+ Yield)
• Undervalued Small Caps with Insider Buying
• High growth Tech and AI Companies
Or build your own from over 50 metrics.
Have feedback on this article? Concerned about the content? Get in touch with us directly. Alternatively, email editorial-team@simplywallst.com