
Identifying SB 253-eligible firms
Our primary data are sourced from S&P Global Sustainable1 (formerly Trucost), which provides broad coverage of corporate greenhouse gas (GHG) emissions, using company disclosures where available and model-based estimates otherwise. Each observation is flagged as either company-disclosed or vendor-estimated10. The Sustainable1 emissions data follow the reporting-boundary definitions of the GHG Protocol. We verify key inferences using emissions data from alternative providers, including MSCI and Refinitiv/LSEG. We obtain financial accounting data from Compustat (S&P Global) and stock market data from the Center for Research in Security Prices (CRSP).
SB 253 applies to U.S.-incorporated entities with annual revenue exceeding $1 billion that do business in California. Importantly, the revenue threshold is based on total worldwide annual revenue, rather than revenue generated in California. SB 253 does not itself define “doing business in California,” but the California Air Resources Board’s draft regulations propose a definition derived from California’s tax code11. Under this definition, an entity is considered to be doing business in California if it is engaged in any transaction for financial or pecuniary gain and meets at least one of the following conditions during a reporting year: (a) it is organized or commercially domiciled in California, or (b) its California sales exceed an inflation-adjusted threshold ($757,070 for 2025) or 25% of total sales.
To identify SB 253–eligible firms, we therefore restrict the Sustainable1 universe to U.S.-incorporated companies with worldwide annual revenue exceeding $1 billion. This cutoff serves as a practical proxy for SB 253 eligibility because U.S.-incorporated firms of this size almost certainly meet California’s nexus thresholds for doing business in the state. Because these thresholds are relatively low, virtually all U.S.-incorporated firms with more than $1 billion in annual revenue fall within the law’s scope, regardless of headquarters location.
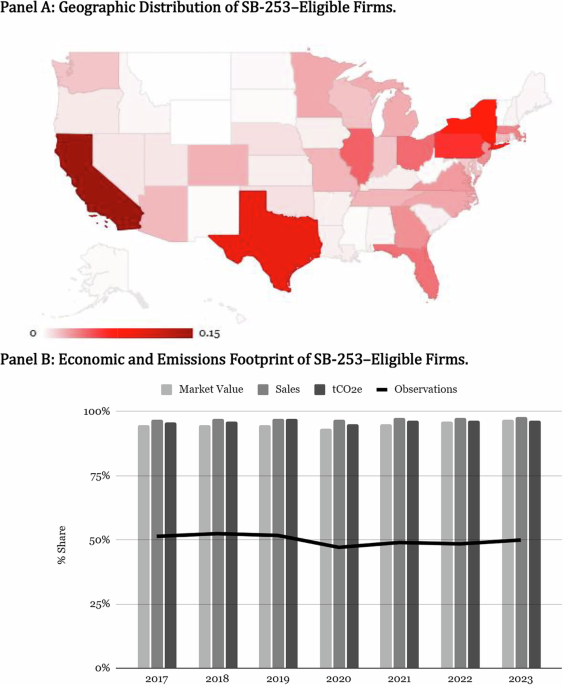
Using revenue data from the most recent fiscal year, we identify 2427 SB 253–eligible firms, tracking the California Air Resources Board’s (CARB) preliminary list of covered entities12. Although SB 253 is a California law, our data underscore that its reach extends nationwide. Panel A of Fig. 1 maps eligible firms by headquarters location, showing that California (15%), Texas (10%), and New York (8%) together account for roughly one-third of covered firms. For our main analysis, we use Sustainable1 full-scope emissions data from 2017–2023 and restrict the sample to publicly traded U.S. companies, yielding 8158 firm-year observations across 1553 unique firms. Panel B of Fig. 1 shows that this sample of SB 253–eligible firms represents roughly half of the Sustainable1 universe but accounts for 95% of aggregate market capitalization, 97% of sales, and 96% of total emissions. These patterns indicate that the $1 billion revenue threshold captures nearly all corporate emissions while deferring compliance costs for smaller firms until they grow beyond the disclosure cutoff.
Fig. 1: Identifying SB 253-eligible firms.
A Geographic distribution of SB-253–eligible firms. B Economic and emissions footprint of SB-253–eligible firms. A of this figure maps SB-253–eligible firms by headquarters. The color scale indicates the fraction of SB 253-eligible firms headquartered in each geographic location, expressed as a share of the total number of eligible firms. B shows that SB 253–eligible firms, though less than half of the Sustainable1 dataset, account for the majority of market capitalization, sales, and total GHG emissions measured in tons of CO2 equivalent (tCO₂e). Total emissions include Scopes 1, 2, and 3 from both upstream and downstream sources.
Emissions profile of SB 253-eligible firms
Figure 2 presents the emissions profile of SB 253–eligible firms. Panel A shows the distribution by year, and Panel B by Global Industry Classification Standard sector. Between 2017 and 2023, Scopes 1 and 2 account for 14% of total emissions, while Scope 3 accounts for the remaining 86%, split between 13% upstream and 73% downstream, underscoring the dominance of value-chain emissions. Sectoral differences are pronounced. Utilities report approximately 60% of emissions in Scopes 1 and 2 and 40% in Scope 3, whereas firms in Energy, Technology, Industrials, Consumer Discretionary, and Finance each exhibit more than 90% of emissions in Scope 3, with substantial variation in the upstream–downstream composition.
Fig. 2: SB 253 corporate emissions profile.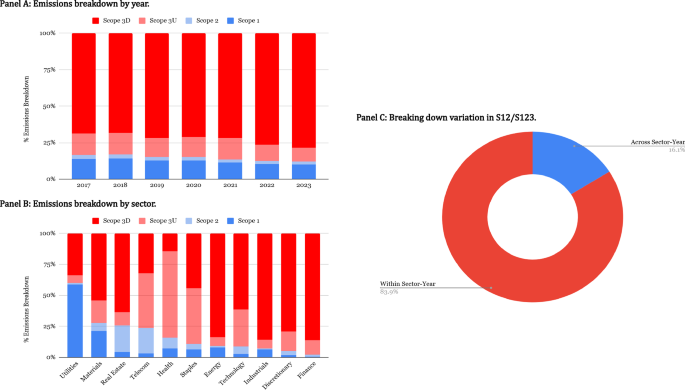
A Emissions breakdown by year. B Emissions breakdown by sector. C Breaking down variation in S12/S123. This figure presents the emissions profile of SB 253–eligible firms. A shows the distribution by year, and B by Global Industry Classification Standard sector. Between 2017 and 2023, Scopes 1 and 2 together accounted for 14% of total emissions, while Scope 3 made up 86%, underscoring the dominance of value-chain emissions. The share of Scope 3 varies across sectors, ranging from about 50% in Utilities to over 90% in Technology, Consumer Discretionary, and Finance. C Visualizes the breakdown of variation in the share of Scopes 1 and 2 relative to total emissions (S12/S123), based on a regression of S12/S123 on sector and year fixed effects. Sector-year effects explain 16% of the variation, with the remaining 84% reflecting within–sector–year firm-level heterogeneity.
By definition, full carbon intensity (S123/Sales) equals partial carbon intensity (S12/Sales) multiplied by the inverse of the share of Scopes 1 and 2 emissions in total emissions: \(\frac{{{{\rm{S}}}}123}{{{{\rm{Sales}}}}}=\frac{{{{\rm{S}}}}12}{{{{\rm{Sales}}}}}\times {\left(\frac{{{{\rm{S}}}}12}{{{{\rm{S}}}}123}\right)}^{-1}.\) This identity clarifies that heterogeneity in emissions composition, captured by S12/S123, is the key driver of reshuffling when moving from partial to full carbon-intensity metrics. In the absence of within–sector–year heterogeneity in S12/S123, partial and full emissions-intensity metrics would yield identical rankings. However, when firms within the same sector and year differ in the share of Scope 3 emissions in total emissions, transitioning from partial to full metrics would systematically alter relative sector-peer rankings. Panel C of Fig. 2 quantifies the degree of heterogeneity in emissions composition by examining variation in S12/S123. We regress S12/S123 on sector and year fixed effects and use the resulting R² to decompose its variation. Sector–year effects explain 16% of the variation in S12/S123, while the remaining 84% reflects within–sector–year heterogeneity. This residual within–sector–year heterogeneity in S12/S123 is critical for understanding why shifting from partial to full emissions-intensity metrics fundamentally alters relative carbon performance evaluations.
We note that the degree of within–sector–year heterogeneity in S12/S123 documented using vendor-estimated data is likely to underestimate the corresponding heterogeneity in firm-reported data. Vendor estimation models necessarily rely more heavily on industry-level averages and standardized assumptions, which may attenuate firm-specific differences in emissions profiles. Once firms disclose their full scope of emissions under mandatory reporting regimes such as California’s SB 253, reported Scope 3 data are likely to capture greater idiosyncratic variation across firms arising from differences in supply chains, production technologies, and downstream use. As a result, the true extent of heterogeneity—and the corresponding potential for reshuffling sector-peer rankings—is likely to be larger than what we observe in vendor-estimated data. Until such disclosures occur, our analysis necessarily provides prospective evidence.
SB 253 compliance costs
Figure 3 examines disclosure coverage to infer where the incremental compliance costs of SB 253 are likely to arise. Panel A shows that in 2017, about 52% of SB 253–eligible firms issued an annual sustainability report, a share that rose steadily to 97% by 2023. Over the same period, the share obtaining sustainability assurance increased from 15% to 40%. Unlike financial audits, sustainability assurance rarely reaches the “reasonable assurance” standard used in financial reporting; it is typically less comprehensive, provides only moderate confidence, and generally covers only Scopes 1 and 213. Under SB 253, however, assurance requirements will ratchet up: limited assurance for Scopes 1 and 2 by 2026, reasonable assurance by 2030, and limited assurance for Scope 3 by 2030. By 2023, nearly three-quarters of SB 253–eligible firms disclosed Scopes 1 and 2, and about half disclosed at least one of the fifteen Scope 3 Categories under the GHG Protocol14.
Fig. 3: SB 253 Corporate disclosure frequencies.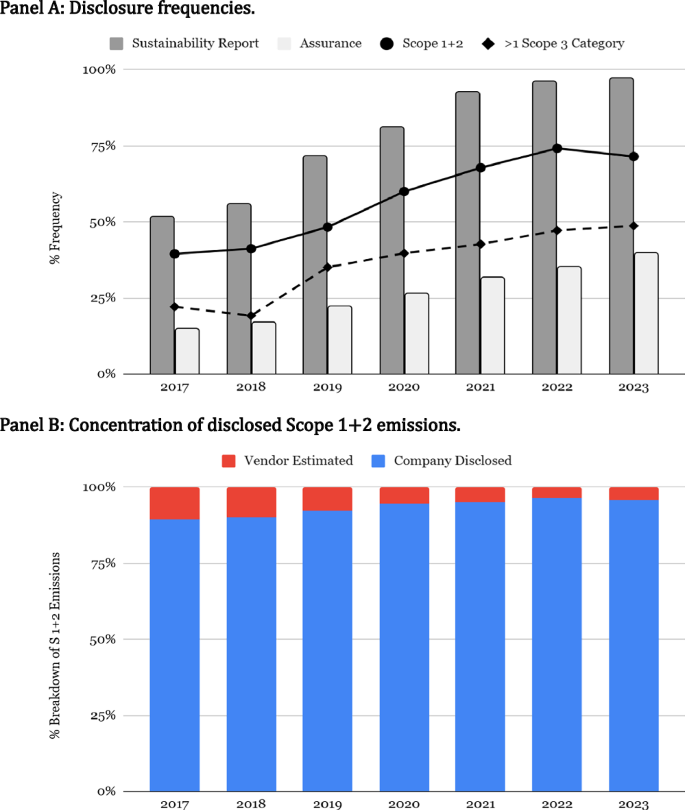
A Disclosure frequencies. B Concentration of disclosed Scopes 1 + 2 emissions. This figure examines disclosure coverage to infer where the incremental compliance costs of SB 253 are likely to arise. A shows that the share of firms issuing sustainability reports rose from 52% in 2017 to 97% in 2023, while assurance increased from 15% to 40%, though typically limited to Scopes 1 and 2. By 2023, nearly three-quarters of firms disclosed Scopes 1 and 2 and about half disclosed at least one Scope 3 category. B shows that disclosing firms accounted for 96% of aggregate Scopes 1 and 2 emissions, leaving only a small residual covered by vendor estimates. Together, these patterns suggest that compliance costs will be relatively low for Scopes 1 and 2 but higher for Scope 3, where disclosure remains incomplete and inconsistent.
Panel B breaks down Scope 1 and 2 emissions into company-disclosed versus vendor-estimated values. Firms disclosing Scopes 1 and 2 account for roughly three-quarters of SB 253–eligible firms but represent about 96% of aggregate emissions, indicating that disclosure is concentrated among the largest emitters. Vendor estimates therefore, cover only a small residual share of Scopes 1 and 2 emissions, underscoring substantial progress in operational emissions reporting. A comparable breakdown for Scope 3 emissions is not feasible in our setting because the Sustainable1 disclosure indicator captures only whether a firm discloses at least one Scope 3 category, rather than emissions by individual category. As a result, we do not separately quantify the share of total Scope 3 emissions that is company-disclosed versus vendor-estimated. However, our review of firms’ sustainability reports suggests that disclosures most frequently cover upstream Category 1 (Purchased Goods and Services) and downstream Category 11 (Use of Sold Products), with additional sector-specific patterns, such as Category 3 (Fuel- and Energy-Related Activities) for Utilities, Category 13 (Downstream Leased Assets) for Real Estate, and Category 15 (Investments) for Financials.
Taken together, these patterns imply that incremental compliance costs under SB 253 are likely to be relatively low for Scopes 1 and 2 among SB 253–eligible firms, where disclosure is already widespread. By contrast, compliance costs are likely to be substantially higher for Scope 3 emissions, where voluntary reporting remains incomplete, category-specific, and uneven across firms and sectors. Achieving compliance with SB 253’s Scope 3 requirements will require investments in new data collection processes, expanded engagement with suppliers and customers, and the development of estimation methodologies that propagate up and down the value chain. Additional costs will arise from building the internal controls, documentation, and governance structures necessary to support third-party assurance of value-chain emissions. These structures will be critical to ensuring that Scope 3 emissions reporting is reliable rather than mere guesswork.
From partial to full scope carbon metrics
Investors increasingly seek to incorporate carbon data into portfolio construction, typically comparing sector peers using emissions per dollar of revenue as the primary measure of carbon intensity15. To date, the focus has been on Scopes 1 and 2, which are more widely disclosed and relatively standardized, while Scope 3 data remain sparse and inconsistent. SB 253 will mandate disclosure of full-scope emissions, enabling investors to incorporate value-chain emissions into relative carbon performance evaluation. This raises the central question: how would shifting from partial (Scopes 1–2) to full-scope (Scopes 1–3) emissions-intensity metrics affect sector-peer evaluations and capital allocation?
Figure 4 quantifies the impact of shifting investor focus from partial carbon intensity, defined as Scopes 1 + 2 emissions per dollar of revenue (S12/Sales), to full carbon intensity, defined as Scope 1 + 2 + 3 emissions per dollar of revenue (S123/Sales), for sector-peer comparisons. We rank firms within each sector-year on both metrics and assign percentile ranks normalized between zero (least carbon-intensive) and one (most carbon-intensive). We compute percentile ranks separately for partial intensity, denoted R(S12/Sales), and full intensity, denoted R(S123/Sales).
Fig. 4: SB 253 partial-to-full intensity reshuffling.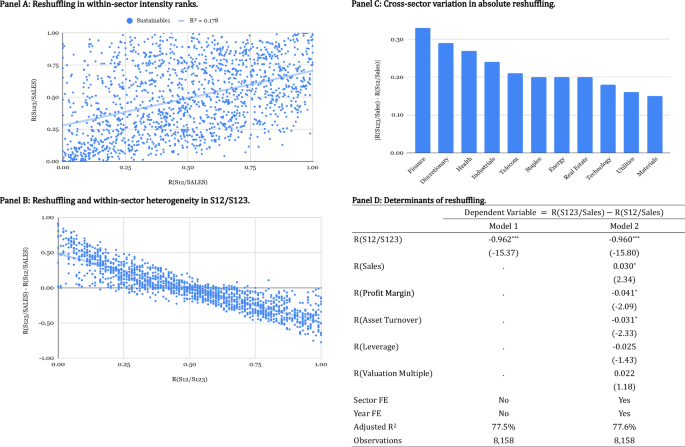
A Reshuffling in within-sector intensity ranks. B Reshuffling and within-sector heterogeneity in S12/S123. C Cross-sector variation in absolute reshuffling. D Determinants of reshuffling. This figure shows the impact of shifting from partial carbon intensity (Scopes 1 + 2 per sales) to full carbon intensity (Scopes 1 + 2 + 3 per sales) for sector-peer comparisons for our sample of SB 253–eligible firms between 2017 and 2023. A shows large deviations from the 45° line, with a Pearson correlation of 42% and an average spread of 23 percentile points between partial- and full-intensity ranks, indicating significant reshuffling. B shows that this reshuffling is systematically related to firms’ emissions mix (S12/S123). C reports average rank spreads ranging from about 15 percentile points for Utilities to about 30 percentile points for Consumer Discretionary and Finance. D reports cross-sectional regressions of the spread between full and partial intensity ranks on the share of Scopes 1 and 2 in total emissions (S12/S123), controlling for sector and year fixed effects and firm fundamentals, including percentile ranks of firm sales, profit margins (gross profits to sales), asset turnover (sales to total assets), leverage (total liabilities to total assets), and valuation multiples (market value to book value). We report t-statistics based on two-way clustered standard errors by sector and year in parentheses below the regression coefficient estimates. ***, and * denote statistical significance at the 1% and 10% levels (two-tailed), respectively.
Panel A plots firms’ average full-intensity ranks against their average partial-intensity ranks, with firm-level ranks averaged across all years in which each firm appears in the sample. If the two metrics were perfectly aligned, observations would fall on the 45° line. Instead, we observe substantial dispersion, indicating significant reshuffling of sector-peer rankings. The correlation between partial and full intensity ranks is 42%, and the average absolute difference in ranks is 23 percentile points. The reshuffling is closely related to firms’ emissions composition. Firms with a higher share of Scopes 1 + 2 emissions relative to total emissions tend to rank worse under partial intensity and better under full intensity. Panel B confirms this relationship, showing a correlation of –90% between the difference in full versus partial intensity ranks and S12/S123. Within-sector heterogeneity in emissions composition is therefore the primary driver of the reshuffling.
Panel C reports the average absolute rank spread by sector. The degree of reshuffling varies substantially across sectors, ranging from approximately 15 percentile points for Utilities, where Scope 3 accounts for about 40% of aggregate full-scope emissions, to roughly 30 percentile points for Consumer Discretionary and Finance, where Scope 3 accounts for 95% and 98% of emissions, respectively.
Panel D reports regressions of the rank spread between full and partial intensity on S12/S123, controlling for sector and year fixed effects and for firm fundamentals, including percentile ranks of sales, profit margins, asset turnover, leverage, and valuation multiples. S12/S123 alone explains 77.5% of the variation in rank spreads, while the incremental explanatory power of the other firm characteristics is only 0.1%. Taken together, these results identify within-sector heterogeneity in emissions composition as the dominant characteristic driving sector-peer reshuffling when moving from partial to full intensity rankings. In the absence of within-sector heterogeneity in S12/S123, shifting from partial to full carbon-intensity metrics would leave relative sector-peer rankings unchanged.
Firm-level examples help illustrate these patterns. Vistra Corp., a major U.S. utilities firm with Scope 3 emissions representing only about 5% of its total carbon footprint, ranks in the 97th percentile under partial intensity and shifts to the 100th percentile under full intensity, reflecting minimal change. Apple, with 88% of emissions in Scope 3, moves from the 8th percentile under partial intensity to the 43rd percentile under full intensity. Tesla, with 96% of total carbon emissions in Scope 3, shifts from the 14th to the 64th percentile, reflecting large upstream and downstream emissions associated with battery production and vehicle use.
Robustness to reporting quality and alternative data providers
To assess whether the reshuffling of sector-peer rankings when moving from partial to full emissions-intensity metrics reflects measurement error in Scope 3 emissions rather than underlying differences in emissions composition, we examine how the extent of reshuffling varies with the quality of firms’ sustainability reporting. We partition the sample using indicators of reporting quality that are likely to affect the reliability of Scope 3 emissions estimates. If reshuffling were primarily an artifact of noisy vendor estimates, it should be more pronounced among firms with lower-quality reporting and attenuated among firms with more developed disclosure practices.
We use four indicators of sustainability reporting quality. First, an indicator for fully modeled Scope 3 emissions identifies firms for which all Scope 3 categories are vendor-estimated rather than at least partially disclosed under the GHG Protocol. Second, an indicator for adoption of Sustainability Accounting Standards Board (SASB) standards, based on data from the IFRS Sustainability Alliance, captures alignment with investor-oriented sustainability standards emphasizing consistency, comparability, and decision-useful metrics. Third, an indicator for reporting under the Global Reporting Initiative (GRI) framework reflects broader sustainability disclosure practices. Fourth, an indicator for firms responding to the Carbon Disclosure Project (CDP) survey captures voluntary participation in detailed climate disclosure regimes.
Panel A of Fig. 5 reports the annual frequencies of these indicators. Between 2017 and 2023, the share of SB 253–eligible firms with fully modeled Scope 3 emissions declined from nearly 80% to about 50%. Over the same period, SASB adoption increased from 7% in 2018 to nearly 80% by 2022, GRI adoption roughly doubled, and CDP participation rose from 29% to 44%. Together, these trends indicate substantial changes in sustainability reporting quality over the sample period.
Fig. 5: Robustness to reporting quality and alternative data providers.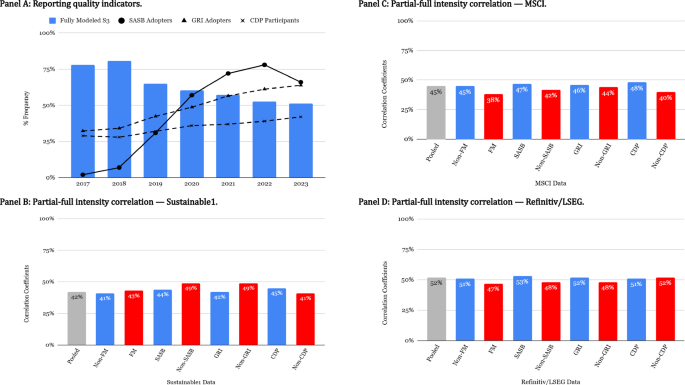
A Reporting quality indicators. B Partial-full intensity correlation—Sustainable1. C Partial-full intensity correlation—MSCI. D Partial-full intensity correlation—Refinitiv/LSEG. This figure shows robustness of the reshuffling in sector-peer rankings from partial to full carbon-intensity metrics to differences in reporting quality and emissions data providers. A Reports time-series variation in four reporting-quality indicators for SB 253–eligible firms: (a) FM vs. non-FM, identifying firms with fully modeled Scope 3 emissions (all Scope 3 categories vendor-estimated) versus firms disclosing at least one Scope 3 category under the GHG Protocol; (b) SASB vs. non-SASB, identifying firms reporting under Sustainability Accounting Standards Board standards; (c) GRI vs. non-GRI, identifying firms reporting under the Global Reporting Initiative framework; and (d) CDP vs. non-CDP, identifying firms responding to the CDP survey. B Reports the Pearson correlation between partial (S12/Sales) and full (S123/Sales) sector-peer carbon-intensity ranks across reporting-quality partitions, showing that the estimated correlation remains close to the full-sample value. C, D Replicate the analysis using emissions data from MSCI and Refinitiv/LSEG. Across all reporting-quality partitions and data providers, the overlap between partial and full intensity ranks remains tightly centered around a 45% correlation, indicating that the reshuffling documented in the paper reflects underlying heterogeneity in emissions composition rather than differences in reporting quality or idiosyncrasies of any single emissions data provider.
Panel B of Fig. 5 reports the degree of reshuffling from partial to full carbon-intensity metrics across reporting-quality partitions, measured by the correlation between partial and full intensity sector-peer ranks using Sustainable1 data. Across all partitions, the estimated correlation remains close to the full-sample value of 42%. There is no evidence that the extent of reshuffling varies systematically with reporting quality, alleviating concerns that the low overlap between partial and full rankings is driven by noise in vendor-estimated Scope 3 emissions.
We next assess robustness to alternative emissions data providers. Using emissions data from MSCI and Refinitiv/LSEG, we estimate the degree of reshuffling both unconditionally and within reporting-quality partitions. MSCI covers approximately 85% of SB 253-eligible firms, while Refinitiv/LSEG covers about 52% for Scopes 1 and 2 emissions, with more limited Scope 3 coverage for both providers. Although these datasets offer less comprehensive coverage of full-scope emissions than S&P Global Sustainable1, they provide a useful robustness check.
Despite differences in coverage, Panels C and D of Fig. 5 show that the correlation between partial- and full-intensity sector-peer ranks is highly consistent across data sources: 42% for Sustainable1, 45% for MSCI, and 52% for Refinitiv/LSEG. Across data providers and subsamples, the overlap between partial and full carbon-intensity rankings remains tightly centered around a 45% correlation, well below the 100% benchmark corresponding to perfect overlap. This consistency indicates that the observed reshuffling is not driven by idiosyncrasies of any single data source or by differences in reporting quality.
SB 253 and investment portfolios
The analysis above shows that incorporating value-chain emissions into carbon-intensity metrics substantially reshapes relative carbon performance rankings among sector peers. This reshuffling is systematic and is largely attributed to within-sector heterogeneity in emissions composition: firms with a larger share of Scopes 1 and 2 emissions in total emissions tend to rank worse under partial intensity but better under full intensity, relative to their sector peers.
If investors allocate capital within sectors based on relative carbon performance—as is common in carbon-tilting strategies—then a shift from partial (Scopes 1–2) to full-scope (Scopes 1–3) emissions-intensity metrics would translate into capital reallocation among sector peers. In what follows, our portfolio analysis quantifies the capital-reallocation effects of redefining carbon performance from partial to full-scope intensity metrics under California’s SB 253 disclosure mandate.
In a standard value-weighted portfolio, investors allocate capital to companies in proportion to their market capitalization. This approach underlies widely followed market indices such as the S&P, MSCI, and FTSE Russell families, which anchor trillions of dollars in public markets. A carbon-efficient variant adjusts portfolio weights to reduce exposure to firms that rank worse and increase exposure to firms that rank better on carbon intensity within their sector. This reshuffling is sector-neutral: it preserves the sector weights of the underlying index while reallocating capital among sector peers. Carbon-tilting strategies reward “best-in-class” companies within each sector and are often viewed as more effective for driving decarbonization than blanket divestment, which excludes entire sectors and reduces diversification16. By contrast, divestment strategies can have unintended consequences, shifting ownership without reducing underlying activity and weakening incentives for firm-level change17.
We construct a standard value-weighted portfolio of SB 253–eligible companies and two carbon-efficient variants: one based on partial intensity (R(S12/Sales)) and the other on full intensity (R(S123/Sales)). Portfolio construction details are provided in the “Methods”. Panel A of Fig. 6 presents the sector weights of the standard value-weighted portfolio over our sample period. By construction, the carbon-efficient portfolio variants preserve these sector weights and reallocate weights only within sectors. Investors evaluating these variants therefore, do not over- or under-weight sectors relative to the benchmark and do not sacrifice diversification. We assess portfolio performance along two dimensions: financial performance and carbon performance.
Fig. 6: Partial vs. full carbon-efficient portfolios.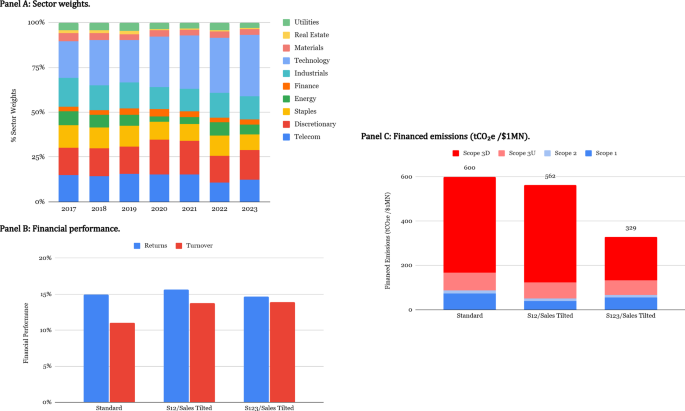
A Sector weights. B Financial performance. C Financed emissions (tCO₂e /$1MN). This figure shows, for our sample of SB 253–eligible firms between 2017 and 2023, the performance of standard and carbon-efficient portfolio variants. The S12/Sales-tilted portfolio reweights firms within sectors based on Scopes 1 and 2 intensity, while the S123/Sales-tilted portfolio reweights firms based on full-scope intensity, including Scope 3. A presents the sector weights of the standard portfolio, which are preserved in both carbon-efficient variants, with adjustments occurring only within sectors. B shows that the partial- and full-intensity variants delivered returns close to the benchmark but with higher turnover, implying greater transaction costs. C shows that the S12/Sales tilt reduced financed emissions by about 6%, while the S123/Sales tilt reduced financed emissions by 45%, including a 23% reduction in Scopes 1 and 2 and nearly a 50% reduction in Scope 3, driven largely by downstream emissions.
We measure financial performance using portfolio returns and portfolio turnover. Portfolio returns are computed as value-weighted returns based on firms’ market capitalizations and realized stock returns over the evaluation period. Portfolio turnover measures the extent of year-to-year changes in portfolio weights and serves as a proxy for rebalancing intensity and transaction costs: higher turnover indicates more frequent trading and higher implementation costs for investors. Panel B of Fig. 6 shows that both the partial- and full-intensity variants delivered average realized returns of about 15%, comparable to the standard portfolio. Turnover, however, was higher—14% compared to 11% for the standard portfolio—reflecting greater rebalancing intensity and, consequently, higher transaction costs associated with implementing full-scope carbon-intensity tilts.
We measure carbon performance using financed emissions, which attribute a firm’s emissions to investors in proportion to their ownership share18. For example, an investor with a 1% stake is assigned 1% of that firm’s emissions. Expressed in metric tons of CO₂ equivalent per $1 million invested, this metric standardizes a portfolio’s carbon footprint relative to invested capital. We compute financed emissions for both partial (Scopes 1 and 2) and full (Scopes 1, 2, and 3) emissions, with details provided in the “Methods”.
Panel C of Fig. 6 shows that, relative to the standard portfolio, the S12/Sales-tilted variant reduces financed emissions by about 6%, driven by reductions in Scopes 1 and 2, while Scope 3 emissions remain nearly unchanged relative to the standard portfolio. By contrast, the S123/Sales-tilted variant achieves a much larger 45% reduction in total emissions, reflecting a 23% decrease in Scopes 1 and 2 and an almost 50% reduction in Scope 3 emissions. The Scope 3 reduction can be further decomposed into a 17% decrease in upstream emissions and a 55% decrease in downstream emissions relative to the standard portfolio.
In sum, shifting from partial to full carbon-intensity metrics allows investors to track the standard value-weighted portfolio while cutting financed emissions by nearly half. This reduction, however, comes at a cost: the full-intensity portfolio exhibits higher turnover and therefore higher transaction costs, reflecting greater variability in portfolio weights. Relative to prior work on carbon-efficient investing that takes the scope of emissions as given, our analysis focuses on how disclosure mandates that expand the scope of reported emissions reshape relative carbon performance and capital allocation19.
SB 253 and capital flows
SB 253 will make the full scope of emissions for eligible firms observable. If investors shift from partial- to full-intensity tilts (S12/Sales vs. S123/Sales), a key question is how much capital would be reallocated. We measure this using two complementary metrics: the total reallocation rate (TRR) for the portfolio as a whole and the sector reallocation rate (SRR) within each sector. The TRR captures the overall scale of portfolio adjustment required to move from partial to full-scope tilting. It expresses the share of the portfolio that would need to be reallocated and can be converted into dollar terms for a given level of invested capital. The SRR applies the same logic within sectors, indicating the proportion of capital already allocated to a sector that would be redistributed among sector peers. Detailed definitions are provided in the “Methods”.
Figure 7 presents reallocation estimates based on historical data as an indication of what might occur once SB 253 disclosures are in place. Panel A shows a total reallocation rate of 29%, implying that approximately $290,000 would be traded for every $1 million invested—about 2.6 times the annual turnover of the standard benchmark portfolio. Panel B decomposes this total into sector reallocation rates, which by construction sum to the overall reallocation rate when weighted by the benchmark portfolio’s sector weights. Reallocation rates vary substantially across sectors, reflecting differences in emissions composition and sector-peer reshuffling. Consumer Discretionary and Telecommunications exhibit the highest rates, ranging from 37% to 44%, consistent with their high reliance on Scope 3 emissions and the substantial reshuffling of rankings when moving from partial to full emissions-intensity metrics. By contrast, Utilities exhibit lower reallocation rates at 16%, reflecting the sector’s smaller share of Scope 3 emissions and the more limited reshuffling of sector-peer rankings when value-chain emissions are incorporated.
Fig. 7: SB 253 capital reallocation rates.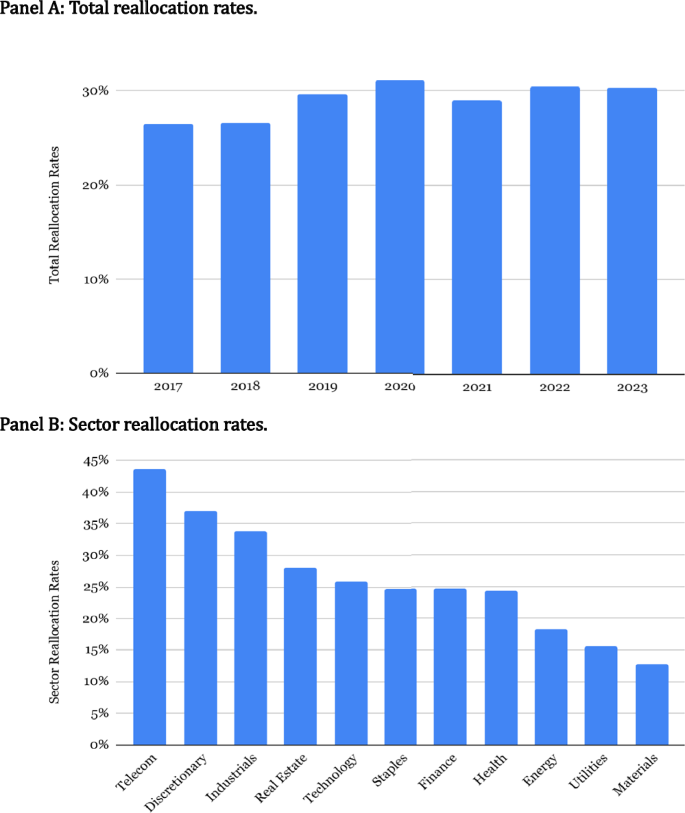
A Total reallocation rates. B Sector reallocation rates. This figure shows, for our sample of SB 253–eligible firms between 2017 and 2023, the scale of capital reallocation implied by a shift from partial-intensity tilts (S12/Sales) to full-intensity tilts (S123/Sales). A shows that the annual total reallocation rate averaged 29%, or about $290,000 traded for every $1 million invested, with all reallocations occurring within sectors. B reports sector reallocation rates, ranging from 16% in Utilities to 37–44% in Consumer Discretionary and Telecom, with Technology at 26%. These results indicate that SB 253 disclosures could trigger large, systematic reallocations of capital within sectors, directing funds toward firms with stronger value-chain emissions performance.
Taken together, these results show that SB 253’s full-scope carbon disclosure mandate would not only alter sector-peer rankings but could also trigger large, systematic reallocations of capital within sectors. Capital could be redirected toward firms with stronger value-chain emissions performance and away from those with weaker performance. We estimate that this effect is more pronounced in sectors where value-chain emissions account for a larger share of the total. We note, however, that because most Scope 3 emissions in our sample are vendor-estimated rather than company-reported, these rates should be viewed as indicative of what might emerge once investors rely on reported value-chain data under California’s SB 253.