
Huge oil-price gyrations are usually not good for the economic psyches of consumers and corporate chiefs.
Numerous financial questions are swirling as a combined U.S.-Israeli military battle with Iran send global oil prices skyward. Will supply be greatly endangered as unrest expands across the oil-rich Middle East? And which budget – housing or corporate – can afford costlier energy?
Let’s look at an obvious war-linked variable: crude oil, the raw commodity that’s refined into fuel.
Higher pump prices likely mean tighter household budgets for drivers. It also translates into ballooning costs for manufacturers that use oil-based materials in their production. And any company that ships its goods should expect higher transportation costs.
This kind of cost shock could push an already weakened economy – California’s and the nation’s – into a recession.
But the immediate uncertainty from any economic shock can be hard to translate into long-lasting business trends. For example, should the Iran war be quickly resolved, any damage to the world’s oil production or shipments may be limited.
Oil spikes have preceded recessions in the past half-century in 1979, 1990, 2000 and 2008, for example. Yet other oil surges did not lead to deep economic despair.
In recent days, oil prices hit four-year highs in the early days of the Iran conflict. What could that mean to California’s economy if this key energy cost stays at such elevated levels?
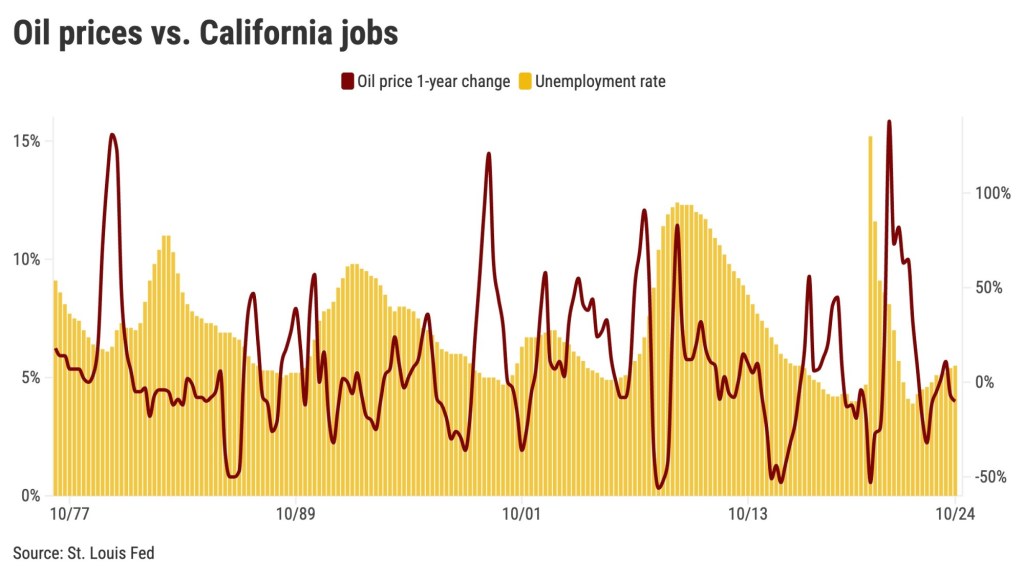
To see the intersection of Golden State’s business performance and historic oil-price swings, my trusty spreadsheet examined 12-month moves in crude oil prices across quarters from 1977 through 2024. The figures were sliced into five groups, focusing on the commodity’s biggest surges compared to its deepest tumbles.
We’re talking dramatic swings in crude oil. In the biggest moves since 1977, oil surged an average of 63% over a year, compared with the commodity’s largest one-year drops, which averaged 35% over 12 months.
Cost of living catch
Not surprisingly, inflation paralleled swings in oil prices.
In 12-month periods when oil prices jumped the most, the U.S. Consumer Price Index rose at a 5.3% annual pace. That was an increase from 3.2% over the previous 12 months.
Conversely, the largest oil-price drops tamed inflation to a 1.7% annual rate from 3.2% 12 months earlier.
Now think about how California’s economy reacts during oil price extremes over these 48 years, spikes vs. tumbles.
California workers may be relieved to learn that per-capita incomes moved somewhat in step with oil prices and inflation.
When oil surged, incomes averaged 7.3% annual gains, up from 6.7% 12 months earlier. When oil was tumbling, income growth cooled to 6.4% from 7% 12 months earlier.
But there’s a catch within those pay patterns. Pocketbook pain is measured by comparing inflation to income growth.
What economists call “real” income growth – raises minus the change in the cost of living – was just 2% when oil spiked vs. 3.4% in the preceding 12 months. Buying power shrank.
But a California paycheck’s borrowing power expanded when oil tumbled: 4.7% real income growth in that year vs. 3.8% in the previous 12 months.
Parallel pops
Remember that when global politics are out of the energy picture, oil prices tend to move with the overall economy.
A robust business climate usually boosts energy demand. So, oil prices often pop.
That same economic strength also elevates the odds that Californians will keep their paychecks.
During oil’s biggest surges since 1977, statewide unemployment averaged 6% – down from 6.7% 12 months earlier.
When oil prices were tumbling, statewide joblessness rose to an average of 6.5% from 5.3% in previous years.
And such oil-linked economic vitality also benefited California homeowners, looking back to 1977.
California home prices, according to a federal index, rose at an 11% annual pace during oil’s big jumps, vs. a typical gain of just 4% annually when oil tumbled.
Look, I’m not saying war – or related oil price hikes – are good for business.
Historically speaking, however, oil-price spikes since 1977 have always led to higher inflation, but California’s unemployment rate decreased 70% of the time.
Jonathan Lansner is the business columnist for the Southern California News Group. He can be reached at jlansner@scng.com