
Applications to the University of California rose substantially over the last decade, leading to a steep decline in acceptance rates to the most competitive campuses. While we’re months away from knowing the official acceptance rates for this year’s cycle, the UC recently released data from the previous year showing which high schools’ students had the highest rates of success in the last cycle.
Over three-quarters (77%) of in-state applicants were admitted to at least one of the nine undergraduate campuses for fall 2025, the highest overall acceptance rate the system has seen in at least nine years. Around 42% of those admitted chose to enroll in the system.
While the large majority of students receive admission letters, the most popular campuses, UCLA and Berkeley, have much lower acceptance rates that continue to decrease — both saw admissions rates drop by 5 percentage points for in-state applicants since 2017. An applicant’s likelihood of admission varies based on GPA and the high school from which they apply, with some high schools outperforming expectations based on the school’s demographics.
The University of California publishes detailed admissions data for every public and private high school in the state. The Chronicle combined the data for the 2025-26 admissions cycle with data from the state Department of Education on the number of seniors at each high school to find application rates by high school.
Data for the current admissions cycle — the 2026-27 school year — is not yet available and not included in our analysis, but acceptance rates tend to remain stable year-to-year, especially for high schools with large numbers of applicants.
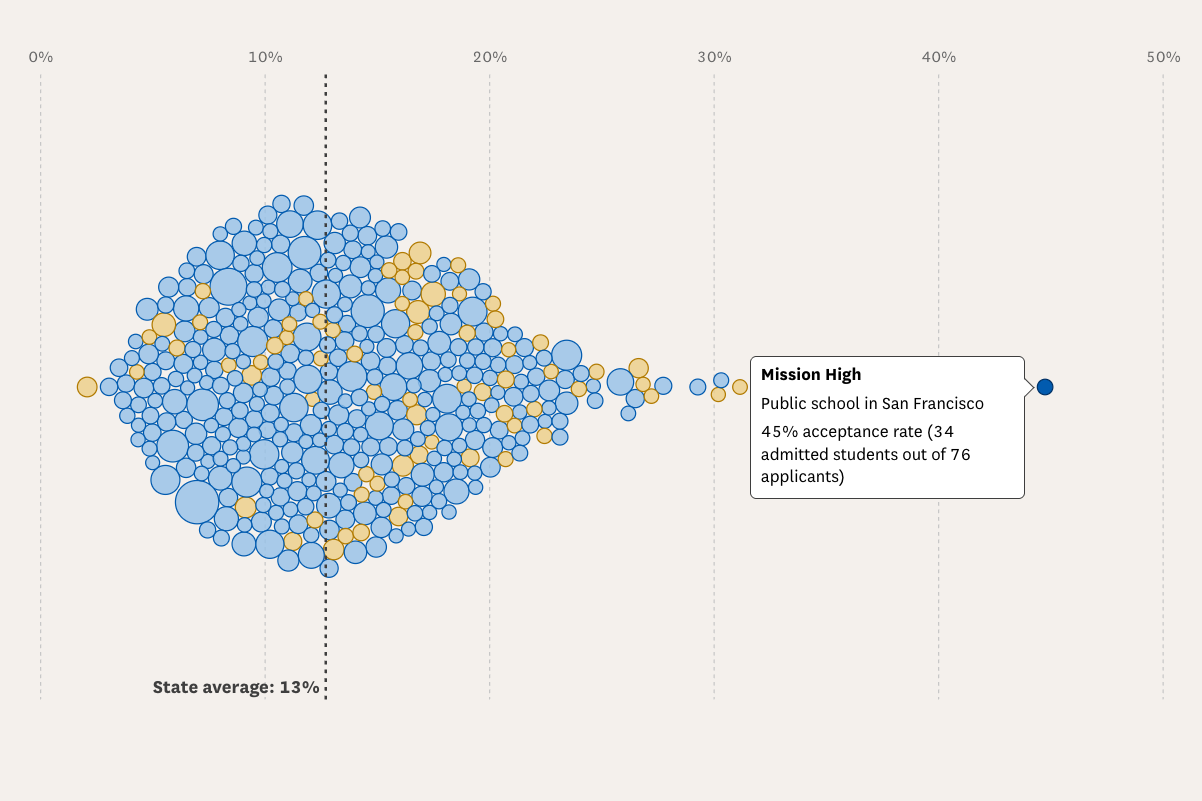
In the graphic below, search for a high school in California to see the application, acceptance and enrollment rates to each UC campus for students from that school.
UC admissions rates from California high schools
Application, acceptance and enrollment rates for fall 2025
Data is not available for schools with less than five applicants or three admittances or enrollees. State averages are for in-state first-time freshmen. Systemwide or school data is not shown if the University of California reported five or more applicants more than the number of seniors reported by the Department of Education. When the difference is less than five, we have shown the data, which can lead to application rates over 100%.
Chart: Nami Sumida and Hanna Zakharenko/S.F. Chronicle · Source: University of California, California Department of Education
In general, UCLA is the most selective UC, admitting 10% of in-state applicants in the last admissions cycle. UC Berkeley is the second most competitive, with a 14% in-state acceptance rate.
But admissions rates can differ dramatically by high school. For example, San Francisco’s Mission High School, a public school with a relatively large share of low-income, Black and Latino students, had 45% of its applicants admitted to Berkeley for fall 2025.
That’s a higher rate than at the Bay Area’s most academically elite schools, such as the private Lick-Wilmerding High School (19%) and the San Francisco Unified School District’s Lowell High School (12%).
Admissions rates by county
Application, acceptance and enrollment rates among California high school students in 2025
Data is not available for schools with less than five applicants or three admittances or enrollees. An asterisk (*) indicates the applicant rate is not shown because there were more seniors reported than the number of applicants.
Chart: Nami Sumida and Hanna Zakharenko/S.F. Chronicle · Source: University of California, California Department of Education
The data also shows disparities by race and ethnicity of applicants. At Mission High, for instance, fewer Hispanic students were accepted into Berkeley (45%), compared with Asian (58%) and Black (50%) students.
Admissions rates by race and ethnicity
Share of applicants of each race or ethnicity who were admitted and the share of admitted students who enrolled in fall 2025
Data is not available for schools with less than five applicants or three admittances or enrollees.
Chart: Nami Sumida and Hanna Zakharenko/S.F. Chronicle · Source: University of California
The UC publishes data on the grade point averages of applicants, admitted students and enrollees. In general, students interested in the competitive campuses, like UCLA, Berkeley and San Diego, have higher average GPAs.
GPA of applicants by high school
Average weighted GPA of students at each high school who applied, were admitted and enrolled for the fall 2025 semester
When calculating individual GPAs, the number of extra points that can be added for honors or AP classes was capped at eight. Average GPA not shown for groups with fewer than five students.
Chart: Nami Sumida and Hanna Zakharenko/S.F. Chronicle · Source: University of California
A campus’ overall acceptance rate and admitted GPA, however, only tell part of the story, as admissions can vary depending on an applicant’s intended major. In 2025, the acceptance rates at Berkeley, for instance, were as low as 2% for students applying to the public health program and as high as 25% among arts and humanities disciplines.
The most selective disciplines across the UCs were nursing at UCLA (1% acceptance rate), nursing at Irvine (1%), public health at UC Berkeley and business at UC Berkeley (5%) — some of the most lucrative majors among UC graduates.
2025 acceptance and enrollment rates by discipline
Acceptance rate among students who applied to majors in each discipline and the share of admitted students who enrolled for the 2025 fall semester
Chart includes data on majors and campuses with 50 or more applicants. Data is on in-state and out-of-state applicants.
Chart: Nami Sumida and Hanna Zakharenko/S.F. Chronicle · Source: University of California
The middle 50% of admitted GPAs at Berkeley tend to fall between 4.0 and 4.3, but students with the highest GPAs are accepted into the architecture, business and engineering programs.
The table below shows the 25th and 75th percentile admitted GPAs, which represent the range of GPAs for the middle half of students admitted into each UC program in 2025.
Admitted GPA by UC discipline
25th and 75th percentile GPAs of students who were admitted into each UC program in 2025
 College application deadline reminders, plus tips on how to research schools and get in.
CreditsData & graphics by Nami Sumida and Hanna Zakharenko. Editing by Dan Kopf and Jess Marmor Shaw.