
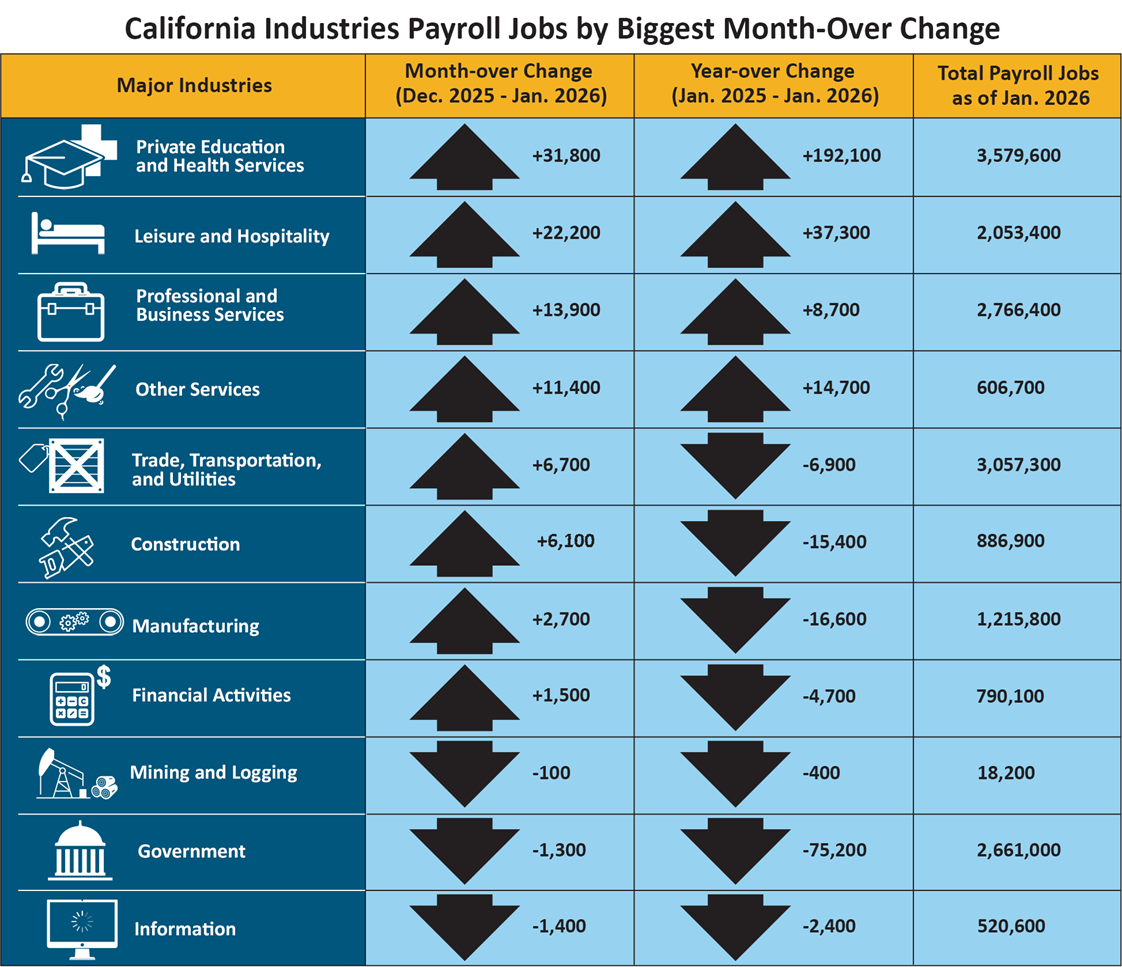
Employers Added 93,500 Jobs
Important Note: The employment data for the month of January 2026 comes from the survey week that included January 12. February 2026 data will be released on April 17. Statistics released today reflect updates to initial 2025 monthly estimates as part of the annual benchmark revision.
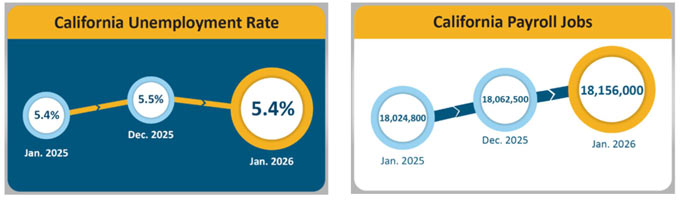
April 4, 2026 – SACRAMENTO — California’s unemployment rate came in at 5.4%1 in January 2026, a decrease from the December 2025 rate of 5.5%. In addition, the State’s employers added 93,500 nonfarm payroll jobs2. These recent data points released by the Employment Development Department (EDD) come from two separate surveys. In addition, as a result of annual benchmark revisions updating past estimates, California’s job loss of 11,100 in 2025 was revised to a gain of 56,600 while the nation’s estimated year-over gain of 584,000 jobs was revised down to 116,000 jobs – a decline of 468,000 jobs in 2025.
California’s Labor Market, by the Numbers…
California’s unemployment rate declined by 0.1 percentage point over the month, matching the national month-over change. Year-over, the State’s unemployment rate has held steady, while the national rate has increased by 0.3 percentage points over the same timeframe.
January’s preliminary month-over job gain (+93,500) was the largest since January 2024. The state’s jobs accounted for more than 58 percent of the nation’s newly revised gain of 160,000 jobs in January 2026.
January marked the third consecutive month that unemployment has decreased in California, with the largest month-over unemployment decrease since August 2022.
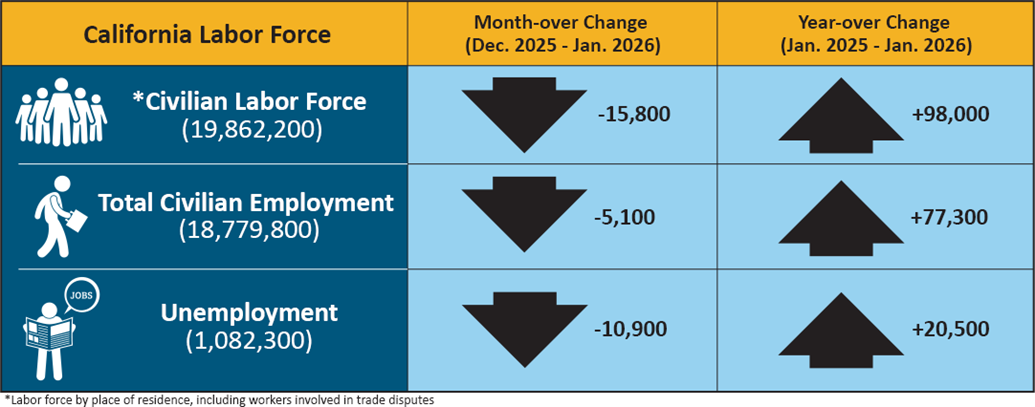
Eight of California’s 11 industry sectors gained jobs in December, with Private Education and Health Services (+31,800) showing gains for the 27th consecutive month, driven by California’s aging population. The industry posted gains in Offices of Physicians, Home Health Care Services, General/Medical Surgical Hospitals, and Child Day Care Services.
Information (-1,400) experienced the largest month-over loss due to larger-than-expected declines in Motion Picture and Video Industries, Software Publishers, and Web Search Portals, and Other Information Services.
1. The unemployment rate comes from a separate federal survey of 4,400 California households.
2. The nonfarm payroll job numbers come from a federal survey of 80,000 California businesses.
Data Trends about Jobs in the Economy
Total Nonfarm Payroll Jobs (Comes from a monthly survey, seasonally adjusted, of approximately 80,000 California businesses)
Month-over — Total nonfarm jobs in 11 major industries totaled 18,156,000 in January – a gain of 93,500 from December. This followed December’s post-benchmark revision of 41,300 jobs, resulting in a month-over December gain of 3,500 jobs.
Year-over — Total nonfarm jobs increased by 131,200 (1% increase) from January 2025 to January 2026 compared to the U.S. year-over gain of 130,000 jobs (0.1% increase).
Total Farm Jobs — Agriculture industry jobs decreased from December by 22,100 to 406,800 jobs in January. Agriculture had 11,700 more farm jobs in January 2026 than it did in January 2025.
Data Trends about Workers in the Economy
Employment and Unemployment in California (Based on a monthly federal survey of 4,400 California households which focuses on workers in the economy)
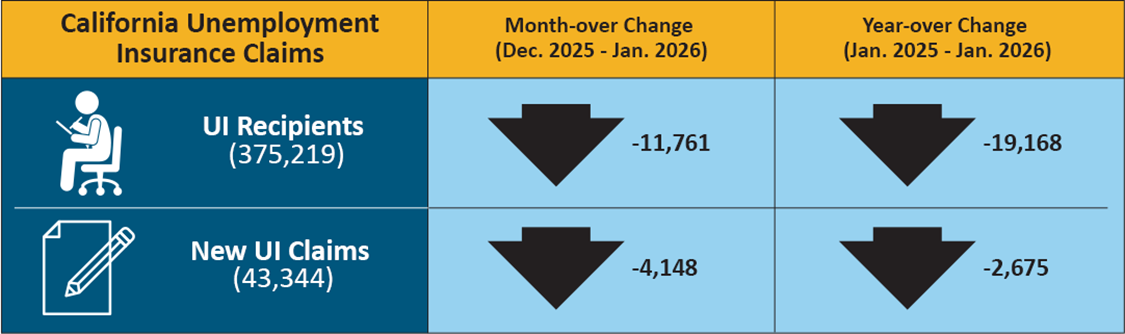
Employed — The number of Californians employed in January was 18,779,800, down 5,100 from December’s total and up 77,300 compared to January of last year.
Unemployed — The number of unemployed Californians was 1,082,300 in January, a decrease of 10,900 over the month, but an increase of 20,500 from January 2025.
Unemployment Insurance Claims (Not Seasonally Adjusted)
The following data is from a sample week that includes the 19th of each month:
In related data that figures into the State’s unemployment rate, there were 375,219 people certifying for Unemployment Insurance (UI) benefits during the January 2026 sample week. That compares to 386,980 people in December and 394,387 people in January 2025. Concurrently,43,344 initial claims were processed in the January 2026 sample week, which was a month-over decrease of 4,148 claims from December and a year-over decrease of 2,765 claims from January 2025.
MONTHLY LABOR FORCE DATA FOR COUNTIES
January 2026 (Preliminary); 2024 Benchmark
NOT SEASONALLY ADJUSTED
COUNTYLABOR FORCEEMPLOYMENTUNEMPLOYMENTRATE
STATE TOTAL
19,622,900
18,537,900
1,085,000
5.5%
ALAMEDA
860,200
820,300
39,900
4.6%
ALPINE
590
550
40
6.6%
AMADOR
14,700
13,740
960
6.5%
BUTTE
89,600
83,700
5,900
6.6%
CALAVERAS
17,380
16,190
1,200
6.9%
COLUSA
11,220
9,220
2,000
17.8%
CONTRA COSTA
577,200
549,700
27,500
4.8%
DEL NORTE
9,250
8,600
650
7.0%
EL DORADO
89,900
85,200
4,700
5.2%
FRESNO
472,700
430,900
41,900
8.9%
GLENN
11,670
10,720
950
8.1%
HUMBOLDT
59,500
56,100
3,400
5.6%
IMPERIAL
74,400
60,500
13,900
18.6%
INYO
8,230
7,810
420
5.1%
KERN
408,700
371,300
37,500
9.2%
KINGS
59,400
53,400
5,900
10.0%
LAKE
26,530
24,350
2,190
8.2%
LASSEN
8,260
7,620
630
7.6%
LOS ANGELES
5,112,600
4,833,400
279,200
5.5%
MADERA
69,900
63,900
6,000
8.6%
MARIN
122,400
117,300
5,100
4.2%
MARIPOSA
6,720
6,200
520
7.7%
MENDOCINO
36,030
33,680
2,350
6.5%
MERCED
123,900
110,800
13,100
10.6%
MODOC
2,990
2,710
280
9.2%
MONO
8,160
7,810
350
4.3%
MONTEREY
208,200
186,200
22,000
10.6%
NAPA
72,000
68,500
3,500
4.9%
NEVADA
47,190
44,820
2,360
5.0%
ORANGE
1,606,200
1,540,100
66,100
4.1%
PLACER
207,900
198,700
9,200
4.4%
PLUMAS
7,250
6,480
770
10.6%
RIVERSIDE
1,197,300
1,131,500
65,800
5.5%
SACRAMENTO
782,800
742,200
40,600
5.2%
SAN BENITO
34,200
31,700
2,500
7.2%
SAN BERNARDINO
1,035,300
979,900
55,400
5.3%
SAN DIEGO
1,650,300
1,573,200
77,200
4.7%
SAN FRANCISCO
499,600
479,400
20,300
4.1%
SAN JOAQUIN
374,800
349,100
25,700
6.8%
SAN LUIS OBISPO
130,500
124,500
6,000
4.6%
SAN MATEO
408,600
393,100
15,500
3.8%
SANTA BARBARA
218,400
206,400
12,000
5.5%
SANTA CLARA
1,024,700
982,000
42,700
4.2%
SANTA CRUZ
135,600
126,000
9,600
7.1%
SHASTA
81,700
76,900
4,800
5.9%
SIERRA
1,340
1,250
90
6.5%
SISKIYOU
15,880
14,360
1,510
9.5%
SOLANO
218,300
206,300
12,000
5.5%
SONOMA
244,000
232,900
11,100
4.6%
STANISLAUS
253,400
234,600
18,900
7.4%
SUTTER
45,600
41,000
4,600
10.1%
TEHAMA
27,120
25,320
1,800
6.6%
TRINITY
5,450
5,080
370
6.8%
TULARE
220,300
195,800
24,500
11.1%
TUOLUMNE
21,570
20,300
1,260
5.9%
VENTURA
416,700
395,900
20,800
5.0%
YOLO
112,400
105,400
7,100
6.3%
YUBA
36,100
33,400
2,700
7.4%
Source: CA. EDD