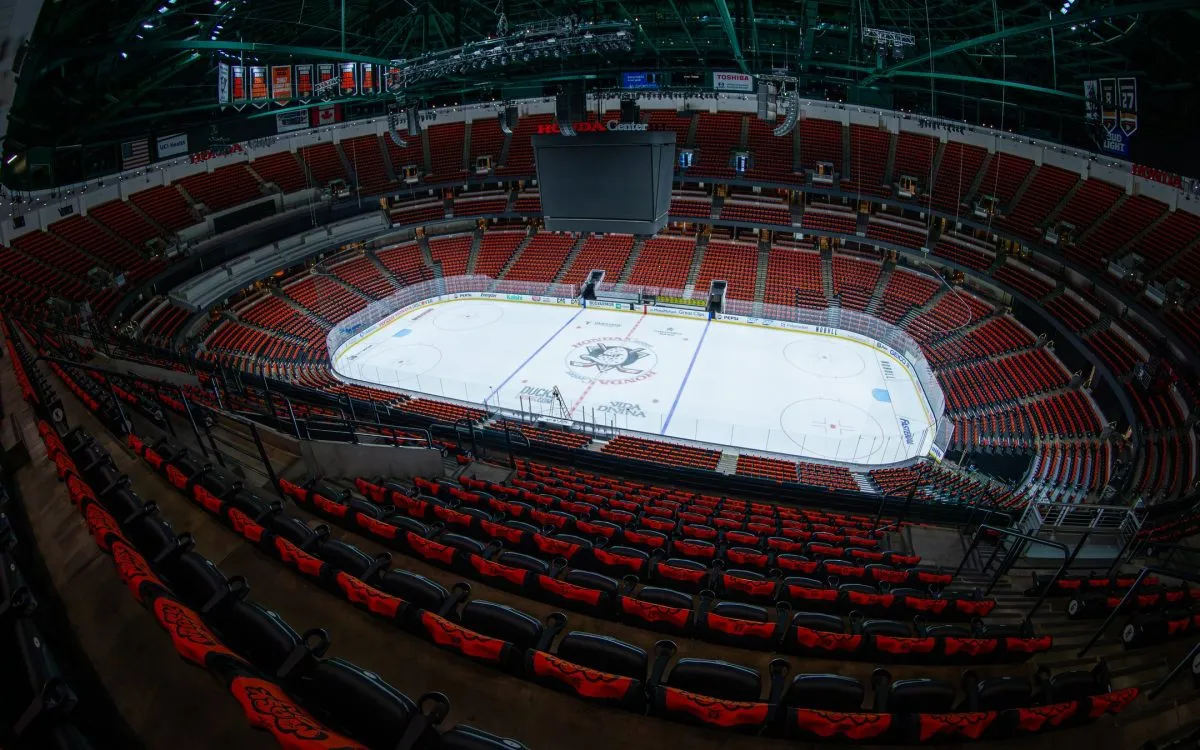

(Photo Credit: @AnaheimDucks on X/Twitter)
Into the Second Round we go. Next up for VGK are the Anaheim Ducks.
Anaheim finished in 3rd place in the Pacific Division despite holding the lead for a good portion of the second half of the regular season. Like Vegas, they experienced many ups and downs over the year, including losing streaks of nine and six games and a pair of five-game winning streaks plus a seven-game streak. They defeated the Golden Knights all three times in the regular season.
Let’s dive into the stats to see how the two teams match up ahead of tonight’s Game 1.
Record
Vegas: 39-26-17, 95 points (13th)
Anaheim: 43-33-6, 92 points (15th)
Goals For
Anaheim: 265, 3.23 per game (13th)
Vegas: 264, 3.22 per game (14th)
Goals Against
Vegas: 242, 2.95 per game (12th)
Anaheim: 288, 3.51 per game (29th)
Shots For
Anaheim: 2523, 30.8 per game (3rd)
Vegas: 2378, 29.o per game (8th)
Shots Against
Vegas: 2001, 24.4 per game (2nd)
Anaheim: 2329, 28.4 per game (20th)
Save Percentage
Vegas: .879 (27th)
Anaheim: .876 (30th)
Power Play
Vegas: 24.6% (6th)
Anaheim: 18.6% (23rd)
Penalty Kill
Vegas: 81.4% (T-7th)
Anaheim: 76.4% (T-26th)
Blocks
Anaheim: 1181 (17th)
Vegas: 1179 (18th)
Hits
Anaheim: 1718 (13th)
Vegas: 1713 (14th)
Despite being considered the more explosive offensive team, the Ducks only outscored the Golden Knights by one goal in the regular season. Defensively, the contrast is much more stark with VGK allowing 46 fewer goals. Anaheim games are typically action-packed with tons of shots and plenty of goals. They lead the playoffs in goals scored and have upped their shot numbers to north of 32 per night.
The 23rd-ranked power play in the regular season caught fire in the First Round, hitting on an incredible 50% of their opportunities and accounting for almost a third of their goals.
On to the fancier numbers.
5-on-5 Shot Share (Corsi)
Vegas: 54.4% (3rd)
Anaheim: 52.1% (7th)
5-on-5 Goal Share (GF%)
Vegas: 48.8% (19th)
Anaheim: 47.37 (23rd)
5-on-5 Expected Goal Share (xGF%)
Vegas: 54.0% (5th)
Anaheim: 50.8% (13th)
5-on-5 – High Danger Save Percentage (HDSV%)
Anaheim: 81.9% (19th)
Vegas: 77.5% (32nd)
5-on-5 – High Danger Shooting Percentage (HDSV%)
Vegas: 18.6% (11th)
Anaheim: 16.8% (24th)
5-on-5 – High Danger Scoring Chance Share (HDCF%)
Vegas: 56.1% (1st)
Anaheim: 50.6% (15th)
5-on-5 PDO
Vegas: 0.983 (28th)
Anaheim: 0.981 (30th)
VGK hold the edge on Anaheim in most of the advanced 5-on-5 numbers. However, like the Golden Knights, the Ducks’ PDO kind of ruined everything for them this year. Both teams allowed more than they were supposed to and scored a lot fewer than they were supposed to. Most of Anaheim’s issues are defensive which tanks a lot of the “share” stats. They create plenty of offense, and in the playoffs, they’ve been finishing.
Now let’s dive into game state numbers.
When Score First
Vegas: 23-4-7 (.779)
Anaheim: 22-9-2 (.697)
When Concede First
Anaheim: 21-24-4 (.469)
Vegas: 16-22-10 (.438)
Lead After 2nd Period
Vegas: 23-0-3 (.942)
Anaheim: 24-1-1 (.942)
Trail After 2nd Period
Vegas: 6-22-10 (.289)
Anaheim: 5-26-4 (.200)
Wins When Trailing At Any Point
Anaheim: 26 (1st)
Vegas: 21 (T-7th)
Losses After Leading At Any Point
Vegas: 14 (T-6th)
Anaheim: 14 (T-6th)
Time Spent Leading
Vegas: 16:22 per game (25th)
Anaheim: 15:56 per game (27th)
Time Spent Trailing
Vegas: 23:58 per game (31st)
Anaheim: 22:57 per game (29th)
These two teams are so similar in how they’ve played a majority of their games this season. They’ve both struggled to score first, they’ve both been elite at coming back, and they both wonder why they can’t just play great for 60 consecutive minutes. It’s going to make for a weird feeling all series because in a weird way, the team that’s behind will feel more comfortable.
Finally, some other miscellaneous numbers that these teams either excel or struggle with.
Minor Penalties
Vegas: 226 (T-1st)
Anaheim: 272 (22nd)
Forced Icings
Vegas: 403 (3rd)
Anaheim: 329 (20th)
Snap Shot Goals
Anaheim: 100 (5th)
Vegas: 67 (17th)
Takeaways
Anaheim: 416 (3rd)
Vegas: 363 (25th)
3rd Period Goals
Vegas: 108 (1st)
Anaheim: 97 (11th)
Shorthanded Goals
Anaheim: 8 (T-6th)
Vegas: 6 (T-15th)
4-on-4 Goal Differential
Anaheim: +4 (2nd)
Vegas: -3 (T-27th)
So there you have it. The Golden Knights certainly have the edge which was proven in the end by the standings in the Pacific Division. But, Anaheim are a dangerous team that have done enough this season to strike fear in anyone. It should be a close, fun, exciting series.
**Stats for this article were sourced from NHL.com, NaturalStatTrick.com, and MoreHockeyStats.com.**