
The June 2 primary for California governor is even more jumbled and unpredictable than usual, especially after the withdrawal of one of the front-runners, ex-Rep. Eric Swalwell. Only the top two vote-getters across all parties will move forward to the November general election. Six Democrats and two Republicans are in a knife fight to advance.
With so many candidates on the ballot, one way to understand who might prevail is to look beyond party labels to consider who might appeal to different types of voters. Though basic partisanship is a key factor in how Californians vote, Chronicle research shows that it doesn’t explain everything. Yes, voters in liberal San Francisco and Los Angeles counties always vote more similarly than those in conservative Kern and Shasta counties. Yet there are important, but subtle differences within these places that mostly vote blue or red.
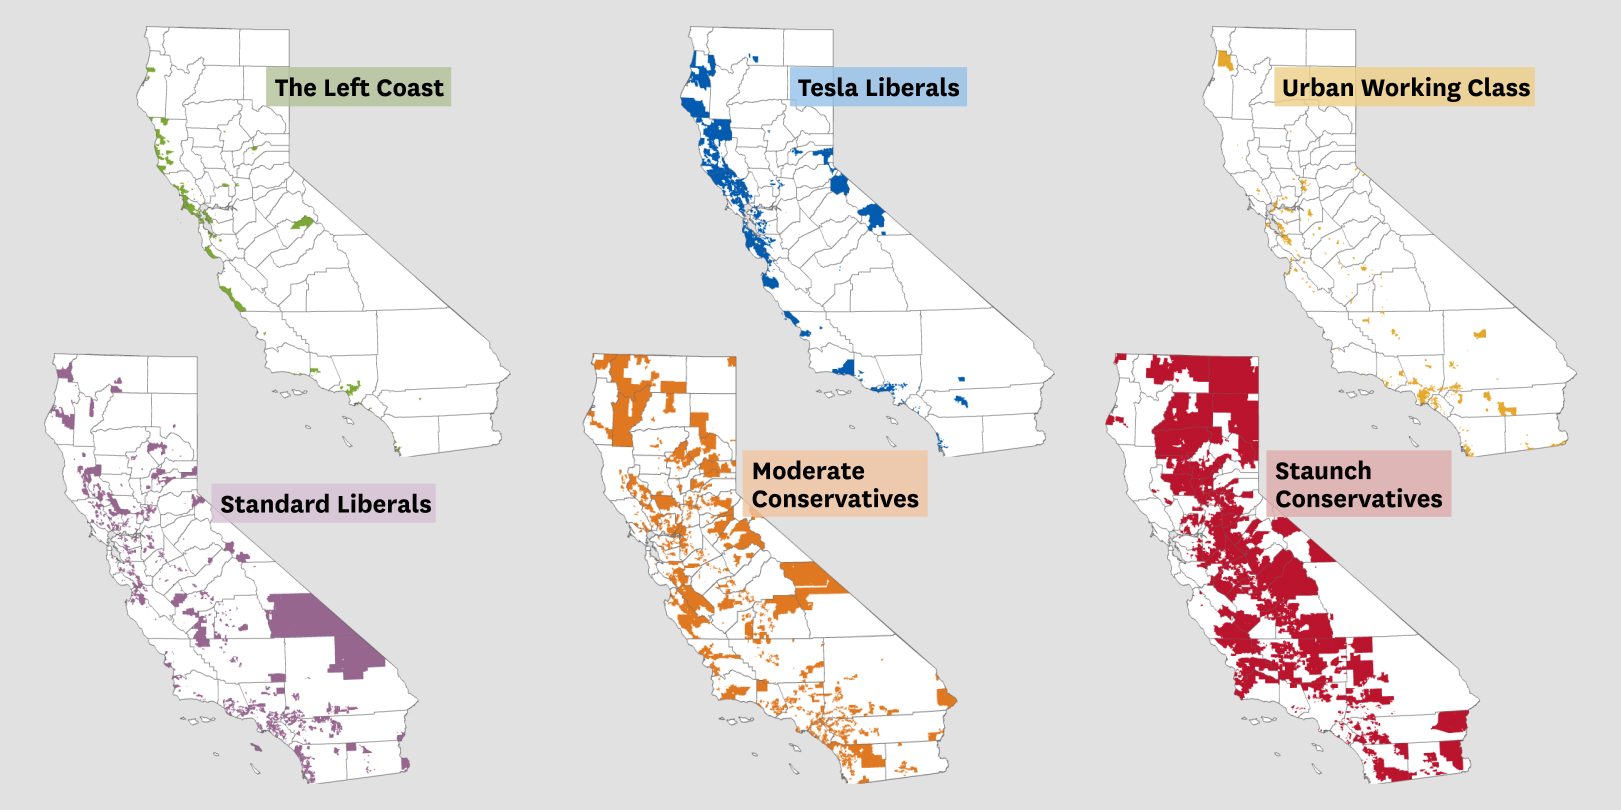
To understand exactly how voters differ beyond party affiliation, the Chronicle analyzed how the state’s nearly 20,000 voting precincts voted on 65 different ballot measures between 2016 and 2024 on topics ranging from the minimum wage to plastic bag bans. We used an algorithm to group precincts with similar voting patterns.
The result was six major groups of precincts that are broadly separated on two axes.
One axis is just a partisan spectrum running from left to right. But the other is more subtle: The analysis shows areas that are similar on a partisan basis can still differ on a working-class “populist” vs. a professional-class “technocratic” orientation: Populist areas disproportionately favored issues like the minimum wage hike, for instance, and technocratic ones backed the bag ban.
California’s six voting clusters
Each circle is a cluster, sized by voting population and positioned by ideology (horizontal axis) and governing style (vertical axis)
Clusters were created based on precinct-level results across 65 different ballot propositions from 2016 to 2024.
Chart: Nami Sumida/S.F. Chronicle · Source: Chronicle research
The analysis has limitations: Land doesn’t vote, people do. And in every geographically-defined precinct, there’s a wide variety of voters with myriad views. Since voting is private, we can’t analyze individual voters — taking a few hundred or a few thousand at a time is as close as we can get.
In addition, limiting our analysis to ballot initiatives gets at each group’s policy views but leaves out the reality that sometimes, people vote for candidates for offices like governor based on other factors, like ethnic affinity.
Still, the groupings reveal a lot about which kinds of voters live near one another — and about how even in a liberal state, not all Democratic areas are the same.
Cluster No. 1
The Left Coast
Precincts in dense urban areas or culturally left-leaning rural areas along the coast
13% of the voting population is in these precincts
Defining characteristics:
The most Democratic group and the most supportive of Bernie Sanders in 2016
Highest share of renters and second most college-educated
Particularly likely to support voting rights for minors and parolees, affirmative action and oppose the death penalty
What it means for the governor’s race:
Porter has a resume that appeals to this group, but Steyer is courting it heavily.
Where these precincts are in major metros:
Bay AreaLos AngelesSan DiegoSacramento
It may be no surprise that the most left-wing parts of the state include urban places like San Francisco, the West Side of Los Angeles and downtown San Jose — along with collegiate enclaves like Berkeley, Davis, Santa Cruz, La Jolla (San Diego County) and even Chico.
“They’re hipsters,” said California Republican strategist Mike Madrid, upon reading a demographic table and seeing a map of this group.
Well, maybe in some areas. The bloc we are calling the Left Coast also includes almost all of Oakland and downtown Los Angeles, both of which are heavily working class (this is the most Black of the groups), as well as the sparsely populated and fog-bathed Marin and Sonoma coasts: redoubts of old hippiedom.
If not demographics or urbanism, what unites these precincts is their firm commitment to a broad range of left-wing causes, from voting rights to school bonds. Notably, some of the causes this group supported by the largest margins relative to the rest of the state were losers: huge bonds for schools (Prop 13 in 2020), voting rights for minors (Prop 18 in 2020) and the abolition of the death penalty (Prop 62 in 2016) among them.
They’re also broadly united in being squeezed by high costs, particularly for housing. A high percentage of residents here — 70% — are renters.
“They want the comforts that their parents gave them growing up, and that they can no longer afford,” said Madrid — although again, that’s truer of the college-educated denizens of this group.
Like all groups, this one isn’t politically monolithic either: Some areas were distinguished by greater economic populism, while others were more socially progressive.
Cluster No. 2
Tesla Liberals
Precincts primarily in upscale suburban areas of big metros
12% of the voting population is in these precincts
Defining characteristics:
The oldest, wealthiest and most college-educated group
The most Asian and the second-whitest
Favor mainstream socially left issues, like gay marriage, as well as many “nanny state” regulations, but are more libertarian on economic issues
What it means for the governor’s race:
Mahan’s moderate urbanist mien could appeal to the most technocratic voters, but Porter represents many voters like this in Congress.
Where these precincts are in major metros:
Bay AreaLos AngelesSan DiegoSacramento
Once upon a time, the wealthiest areas in California, as in the rest of the country, leaned Republican: After all, GOP lawmakers voted to keep their taxes low and perpetuate the free-market conditions that made many of them prosperous.
Although less lopsided than the Left Coast, well-off, professional, socially conscious communities like Mill Valley, Los Altos and Beverly Hills are nearly as reliably Democratic, despite their extraordinary wealth.
We are calling this group the “Tesla Liberals.” Although many in these areas have undoubtedly soured on Tesla’s founder Elon Musk as his politics have shifted right, these communities, with their wealth and environmental consciousness, naturally furnished Tesla’s earliest customer base.
They favor socially liberal causes like supporting democracy (e.g., fighting corporate campaign spending in 2016’s Prop 59, and abortion in 2022’s Prop 1 and LGBT rights in 2024’s Prop 3). They’re even willing to impose some costs on themselves and others in the name of environmental protection (a plastic bag ban, bonds for water resources) and public health (cigarette taxes).
But don’t confuse liberal identity with leftist radicalism.
These areas are much less in favor of policies that impose explicit costs on themselves — or on the systems that made them prosperous. Rent control, housing bonds and affirmative action were all causes that proved less popular here than in other Democratic-leaning areas.
The result is a group that could reasonably look paternalistic to outsiders. For example, this group was disproportionately in favor of restricting flavored tobacco — a largely young, nonwhite and working-class vice.
“The way to think about them is that their support of regulatory schemes, especially around climate policy, is a luxury good,” said Republican strategist Rob Stutzman, a former adviser to Gov. Arnold Schwarzenegger.
“They can afford it and it feels good.”
Cluster No. 3
Urban Working Class
Precincts in dense working-class neighborhoods of inner cities
26% of the voting population is in these precincts
Defining characteristics:
Heavily Hispanic, but with substantial Asian and Black populations too
The youngest, poorest and least well-educated. High share of renters and the most households with children
Economically populist but more socially traditionalist, has swung sharply to the right recently
What it means for the governor’s race:
This group lacks a champion, but Steyer is targeting them, and Becerra may be surging among them.
Where these precincts are in major metros:
Bay AreaLos AngelesSan DiegoSacramento
The state’s most populous group is also its most populist. Based heavily in its inner cities, this bloc resembles the Tesla Liberals in partisan terms, in aggregate handing Democrats between 65% and 80% of the vote in presidential and gubernatorial contests over the last decade.
But that’s where the similarities end.
If Tesla Liberals are socially progressive but technocratic about government, this largely Urban Working Class group — heavily represented in the Hispanic cores of Los Angeles, Fresno, San Leandro, and even the Filipino communities of Daly City and the Vietnamese parts of East San Jose — is their political opposite.
On the one hand, this group disproportionately wants the government to help on kitchen table issues like funding for education and housing. They were much more supportive of increasing the minimum wage and of rent control than the Tesla Liberals.
But on the other hand, these areas are traditionalist on some social issues, showing much less enthusiasm for liberal priorities like gay marriage and abortion rights than other areas with a similar history of voting for Democrats.
“These were people who were turned off by the culture wars,” said Eric Jaye, a San Francisco-based Democratic political strategist. “And in many cases, by the way, they had their jobs under stress because of unfettered immigration.”
Not coincidentally, this group has seen its partisan preferences change the most between 2016 and 2024. Once almost as Democratic-leaning as the Left Coast, it has zoomed right since Donald Trump took the Republican Party in a more anti-establishment direction, voting by larger margins for Trump in each election — and by more in 2024 than the Tesla Liberals.
Urban Working Class voters have moved away from Democrats in recent elections
Share of voters in each cluster who supported the Democratic presidential candidate
Chart: Nami Sumida/S.F. Chronicle · Source: Chronicle research
In this year’s gubernatorial primary, Madrid has seen evidence that voters in these areas are open to candidates like former Health and Human Services Secretary Xavier Becerra, who has avoided positioning himself on the social left.
Although this is a populous group, it consistently has the lowest turnout: It comprises a quarter of the state’s adults, but only about 13% of the vote in gubernatorial primaries.
How each cluster’s turnout compares to its share of voters
Share of the voting population vs. share of voters in the 2022 primary
Chart: Nami Sumida/S.F. Chronicle · Source: Chronicle research
Cluster No. 4
Standard Liberals
Precincts primarily in the middle-class suburbs of major cities
25% of the voting population is in these precincts
Defining characteristics:
Evenly divided between Hispanic, white and all other groups of voters
Votes exactly in the state’s political middle: generally liberal, but not ideological
More areas like this in Southern and Central California
What it means for the governor’s race:
Voters here are mixed, and any winning candidate’s path runs through this group.
Where these precincts are in major metros:
Bay AreaLos AngelesSan DiegoSacramento
California’s “normiest” group is roughly as large as the Urban Working Class and, on the whole, took no position on any proposition that differed from the state as a whole by more than 3 percentage points. Likewise, it voted between 55% and 60% Democratic in presidential and gubernatorial elections, right in the middle of the state.
In most regions, these precincts constitute the largest or second-largest group. That applies to huge swaths of Southern California’s San Fernando Valley, cities like Torrance and Redondo Beach in the South Bay region of Los Angeles County, much of Ontario and Fontana in the Inland Empire, northern San Diego County and the suburbs of major Central Valley cities like Sacramento and Fresno.
But Standard Liberal areas are underrepresented in the hyper-liberal Bay Area, which overwhelmingly consists of precincts in the Left Coast, Tesla Liberal or Urban Working Class blocs. You have to go to the outskirts, to places like Livermore or Gilroy, to find precincts that look like California as a whole.
Standard Liberals are less common in the Bay Area than elsewhere in California
Share of voters in each region who fall into each cluster
Greater Los Angeles includes Los Angeles, Orange, Riverside, and San Bernardino counties.
Chart: Nami Sumida/S.F. Chronicle · Source: Chronicle research
That doesn’t mean that voters here are necessarily all center-leftists.
“Your expectation might be there’s a huge block of centrist voters. Well really, there’s not,” said Jaye. Instead, he stressed, it’s in these places that the mix of voters best reflects California as a whole: committed Democrats of various kinds moderately outnumbering committed Republicans.
Still, if you want to know what the consensus view is in California, go here: The average voter here favors some regulation on environmental, democracy and social issues, but isn’t extreme on urbanism, social justice and wealth redistribution. And almost certainly, any path to victory in the gubernatorial race runs through these precincts.
“Whoever they vote for is going to win the race,” said Madrid.
Unsurprisingly, this group also mirrors the demographic spread of the state: It has a narrow Hispanic plurality over white residents, but with a large Asian and a smaller Black and multiracial population too. Just over one-third of adults are college educated, a hair under the state average of 38%.
Cluster No. 5
Moderate Conservatives
Precincts in right-leaning suburban and exurban areas
19% of the voting population is in these precincts
Defining characteristics:
The transition zone between the state’s standard liberal areas and its right wing
Mostly exurban, but also includes traditionally Republican suburbs in Southern California
Second-wealthiest and second-oldest group in the state
What it means for the governor’s race:
Any Republican with hopes of advancing will have to run up his margins here.
Where these precincts are in major metros:
Bay AreaLos AngelesSan DiegoSacramento
When you think of upscale, older, right-leaning parts of California, you might imagine the country clubs and beachfront mansions of Orange County and Palos Verdes.
You’d be thinking too small.
Certainly, those communities form some of the most influential parts of the wide swath of Moderately Conservative precincts in California — the state’s third-largest group in aggregate. But this group, which comprises every place where Republicans narrowly outnumber their Democratic neighbors, are a strikingly diverse bunch. They run from tony Huntington Beach to Coronado, with its large military presence, to working-class Riverside and the eastern exurbs of Sacramento.
Only half of adults here are white — less than among the Tesla Liberals — and fully a quarter are Hispanic. Another 12% are Asian, and a fifth overall are immigrants.
Given that diversity, the conservative character of this group skews economic rather than full-on MAGA. These parts of the state have consistently opposed new bonds for education (e.g., Prop 13 in 2020), housing (Prop 1 in 2018) and the environment (Prop 68 in 2018); likewise, they opposed raising the state’s minimum wage (Prop 32 in 2024). But they aren’t nearly as gung-ho on social issues, voting only slightly to the right of the state on protecting gay marriage (Prop 3 in 2024) and abortion rights (Prop 1 in 2022).
Cluster No. 6
Staunch Conservatives
Mostly precincts in rural farming and ranching regions, but some conservative urban areas too
6% of the voting population is in these precincts
Defining characteristics:
Smallest, whitest and most rural
Scarce in urban areas but still present in heavily Republican Southern California suburbs
Particularly conservative on identitarian issues like guns and abortion
What it means for the governor’s race:
Chad Bianco’s MAGA orientation could play well here.
Where these precincts are in major metros:
Bay AreaLos AngelesSan DiegoSacramento
California has MAGA regions too. There just aren’t that many people there.
The state’s least populous group of precincts is the Staunch Conservatives, places where Democrats rarely notch above 30% of the vote in two-party contests. Such places are increasingly rare in California, at least in terms of population; by contrast, this is the state’s largest grouping by land area.
“It’s the forests, the deserts and the mountains. And of course, it’s the farms,” said Madrid.
These areas have distinctively Western red-state politics. Small wonder that conservatives leaving California often end up in places where voters like them constitute a majority — like Idaho and Montana.
In relative terms, no issue animated these areas more than the prospect of background checks for buying ammo (2016’s Prop 63), which passed overwhelmingly in the state but failed by large margins here. They also stand out for their protection of rural and farming interests, as in their opposition to regulations mandating more space for farm animals (2018’s Prop 12).
Once upon a time, huge swaths of Southern California had an orientation like this — and some of the staunchest conservative communities, like Yorba Linda in Orange County, still do. But increasingly, heavily Republican areas form islands in the diverse patchwork of greater Los Angeles. Instead, the only part of the state where this orientation is truly dominant is the rugged North, where jurisdictions like Shasta County have taken on a decidedly MAGA character.
It may not be surprising that this is the whitest group, but it’s also notable for having the state’s largest share of Native American voters.
What do these clusters tell us about the governor’s race?
Although these groupings are helpful to understand what kinds of voters live where, they aren’t necessarily how candidates view their paths to victory. Instead, campaigns can draw on much finer tools to go after voters: Voter file and consumer data let them target people by mail or online down to the individual.
Still, the path to victory for some candidates more clearly mirrors geography than for others.
Former L.A. mayor Antonio “Villaraigosa can look at a map … and then be able to scale that out and say, okay, which areas look like the areas I’ve done well in in Los Angeles?” said Mason Herron, a political analyst based in San Diego. Villaraigosa is the only candidate who has run for governor before, when he came a distant third in the 2018 race in which Gavin Newsom prevailed.
His areas of strength were firmly based in the Urban Working Class cluster. This year, Villaraigosa has failed to break through. Instead, Madrid thinks it’s Becerra who will do well among the state’s largest group of voters. That automatically puts him in a strong position, one that’s reflected by polls and betting markets.
California precincts, colored by cluster
Map: Nami Sumida/S.F. Chronicle · Source: Chronicle research
Former U.S. Rep. Katie Porter, likewise, has had electoral success representing an Orange County district that straddles some Left Coast, Tesla Liberal and Standard Liberal precincts. Her voting record and appeal skew toward the technocratic end of the spectrum, notably on consumer protection, even if her rhetoric is more populist. She’s been endorsed by Massachusetts Sen. Elizabeth Warren, who has also made a name crafting technocratic solutions to social problems.
Perhaps no candidate has positioned himself as more technocratic in both style and substance than Matt Mahan, the mayor of wealthy and highly educated San Jose. Uniquely among Democrats, he has not catered to the highly engaged Left Coast flank, instead making a play for upscale moderates, as in his opposition to the state’s proposed billionaire wealth tax and in his support for deregulation in housing policy. But with poll numbers in the single digits, it’s not clear he’s expanded his appeal beyond the Tesla Liberal class.
“He’s really relying on this lane,” said Herron. “He’s looking at the moderate liberal, maybe even the moderate conservative type of voter, and really hoping to reach them.”
Then there’s former hedge fund CEO Tom Steyer, a billionaire product of the Tesla Liberal class who’s never held elected office but has used his considerable fortune to craft an explicitly populist persona — one that’s not opposed to big taxes on plutocrats like himself. Likely, he will hope to triumph among Standard Liberals and even the Urban Working Class by trying to appeal to the widest swath possible.
“There’s the scalpel way to run a campaign and a sledgehammer approach. He’s taking a more sledgehammer approach,” said Herron. “You can just look at the polling and say, OK, what do Democrats care most about?”
Finally, former Fox News host Steve Hilton and Riverside County Sheriff Chad Bianco, the two major Republicans running, will be vying to secure the votes of California’s right-leaning minority. Although both are polling well enough to have a chance to make the top two, they’re engaged in a high-stakes gamble: Their ceilings of support are low, and both risk being locked out if Democrats consolidate. Their styles could end up playing better in different parts of the state.
“To be superficial about it, one has the mustache, and the other walks around with a button-down and a jacket,” said Herron, speculating that the more mainstream-presenting Hilton might do better among the areas with more Moderate Conservatives than the more MAGA-attuned Bianco.
Bianco, after all, made a name seizing voting machines in service of Donald Trump’s baseless accusation that rife voter fraud cost him the 2020 presidential election.
The five most distinctive votes by cluster
How differently each cluster voted from the statewide vote in percentage points (pp.)
Chart: Nami Sumida/S.F. Chronicle · Source: Chronicle research
About this story
The Chronicle’s analysis relies on precinct-level election results from the California Statewide Database of election data and demographic data from the Census Bureau.
Election results for all statewide propositions, in primary, general and special elections, were compiled for the years from 2016 through 2024. Because different voting precinct boundaries were used in each election cycle, we used a method provided by the Statewide Database to “crosswalk” all results to 2024 general election precinct boundaries.
Precincts were categorized by their votes across the 65 ballot propositions during that time using different iterations of a k-means clustering algorithm. We ran various iterations of the analysis to check that small changes to our methods did not lead to large differences in the results.
We also performed a principal component analysis, a kind of “dimensionality reduction,” to generate the two-dimensional plot of the clusters. Although more dimensions were available, the two shown substantially capture the ways in which the groups vary from each other.
We used U.S. Census data to characterize the groups we obtained.
The racial and ethnic makeup of each precinct comes from the 2020 census. Our analysis grouped residents into mutually exclusive racial and ethnic categories, which is an oversimplification that doesn’t always match how people identify. Anyone who identifies as Hispanic or Latino is counted in that group, regardless of race. White, Black, and Asian American and Pacific Islander categories represent non-Hispanic adult residents who reported belonging only to those single races. Members of other ethnic groups and those of mixed ancestry form much smaller groups; their shares were not shown.
All other demographic data came from the Census Bureau’s 2020 to 2024 American Community Survey, which we obtained at the level of the census tract, the smallest geography for which most of this information is available. Since these geographies are not identical to voting precincts, we inferred the demographics of the precincts by calculating the adult population overlap between the two geographies.
 Go deep into the numbers with the SFChronicle data team as your guides.
CreditsReporting and data by Aseem Shukla. Graphics, design and development by Nami Sumida. Editing by Dan Kopf, Caleb Pershan and Sara Libby.