
Federal scientists have announced that La Niña — the phenomenon in which Pacific Ocean waters off South America are cooler than normal — has officially begun and is likely to continue into winter.
From social media to coffee shops and even some TV weather reports, a common claim is that La Niña means a dry winter is coming for California, and in years when the opposite occurs, El Niño, a wet winter is on the way.
But the reality, history shows, is that a lot depends on location.
“You have to look at the data. Get past the hype,” said Jan Null, a meteorologist with Golden Gate Weather Services in Half Moon Bay. “There’s no guarantee of a dry winter or a wet winter, only that there will be winter.”
Null, a former lead forecaster with the National Weather Service, has spent years tracking the amount of rainfall California receives every winter and looking for trends.
The big takeaway: Generally speaking, during La Niña winters, Southern California more often has had drier conditions than Northern California. Put another way, the farther north, the more likely it is to be wet during La Niña winters, and the farther south, the more likely it is to be dry.
Since 1950, there have been 25 winters with La Niña conditions, Null’s records show.
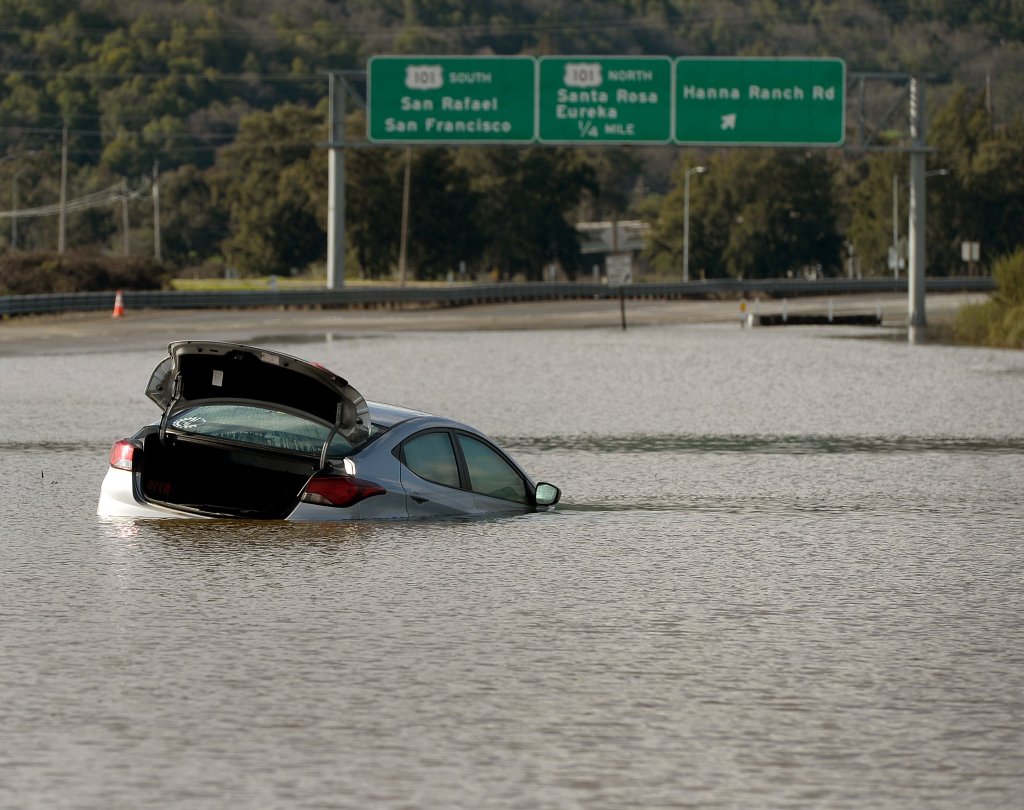
Although some of those winters were dry, like 2017-18 or 1976-77, some also were very wet, such as the winter of 2016-17, when relentless atmospheric river storms caused the near-failure of Oroville Dam and flooding in downtown San Jose. Or 2022-23, when massive snow storms shut down Sierra Nevada ski resorts for days and broke a previous three-year drought.
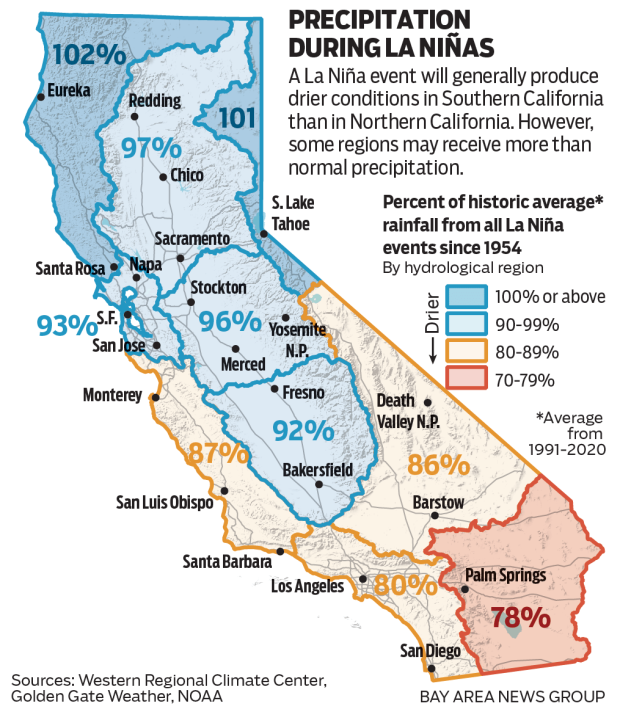 In the Bay Area, the average rainfall over those 25 La Niña winters was 93% of normal.
But in Southern California, rainfall during those La Niña winters has averaged just 80% of normal, Null’s data show.
In the far northern part of California, near the Oregon border, rainfall was even higher — 102% of average during the 25 La Niña winters.
“La Niña often, but not always, leads to higher odds of drier conditions in the southern part of the state,” said Michelle L’Heureux, a meteorologist with the National Weather Service’s Climate Prediction Center in College Park, Maryland. “The northern part of California is often more of a coin toss.”
Over those 25 La Niña winters, the Bay Area has had 10 winters with rainfall below 80% of normal, and seven with rainfall above 120% of normal. But in the Los Angeles Area there have been 13 winters below 80% and only 3 above 120%.
“La Niña is not a one-size-fits-all,” Null said. “It’s a bigger signal in Southern California.”
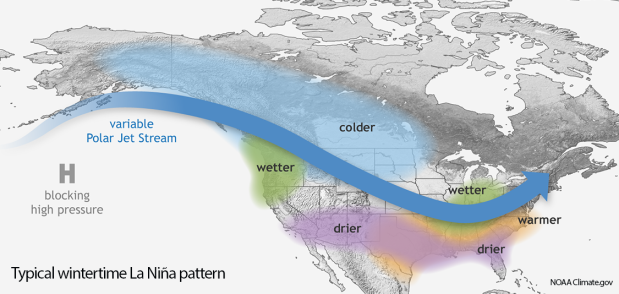 La Niña, the conditions that exist when water temperatures in the Pacific are cooler than normal at the equator, is a major influence on North America’s weather. (Image: NOAA)
When ocean temperatures shift, that often causes changes in wind patterns. Historically, La Niña leads to a northward shift in the jet stream over the North Pacific Ocean and North America during winter. That decreases the chances of precipitation across the southern half of the United States and increases the chance of a wetter winter over the northern U.S.
California’s water picture
How is California’s water picture looking now as the state heads into this winter?
Not bad. There have been three normal or wetter-than-normal winters in a row.
As a result, most of the major reservoirs around California were at or above average capacity on Thursday.
The largest, Shasta, near Redding, was 58% full, or 105% of its historical average for this date. Similarly, the second-largest, Oroville in Butte County, was 57% full, or 103% of average, and San Luis, between Gilroy and Los Banos, was 54%, or 125% of average.
“That’s pretty good as we head into winter,” said Michael Anderson, a climatologist with the California Department of Water Resources.
But the rain hasn’t been spread out equally. Over the past year, there was a very clear pattern. Totals were near normal in Northern California but well below normal in Southern California.
During the year that ended Oct. 1, for example, Santa Rosa received 123% of its historic average rainfall. San Francisco had 87%. But Los Angeles had only 52%.
“We got nearly an average water year,” Anderson said. “But it wasn’t evenly distributed. The storms mostly were north of I-80.”
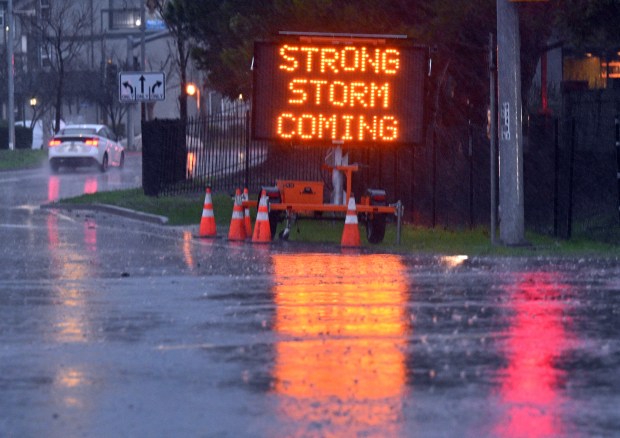 A warning sign in Marin City on Wednesday, Jan. 4, 2023. (Sherry LaVars/Marin Independent Journal)
California normally receives 50% of its annual rainfall during three months: December, January and February. Last year, soaking storms in Northern California in November ended fire season. But they missed Southern California.
That lack of precipitation, combined with record high winds, contributed to the parched conditions that allowed the devastating Palisades and Eaton fires to explode out of control in Los Angeles in early January, killing 31 people and destroying 16,000 homes and other buildings.
Overall, Northern California had nine atmospheric river storms last winter that were rated strong or higher, according to the Center for Western Weather and Water Extremes at the University of California, San Diego. Those delivered billions of gallons of water and ended fire danger. But every one made landfall north of Monterey Bay. None hit Southern California.
Big swings in weather — from soaking winters to extreme droughts — are occurring more often due to the warming climate, scientists say. Hotter weather dries out vegetation more. But it also can cause more moisture to evaporate from the ocean into storms, making them wetter when they do hit.
“California must be ready to respond to emergencies from droughts to floods to fires,” said Karla Nemeth, director of the California Department of Water Resources. “There is no such thing as a normal water year.”
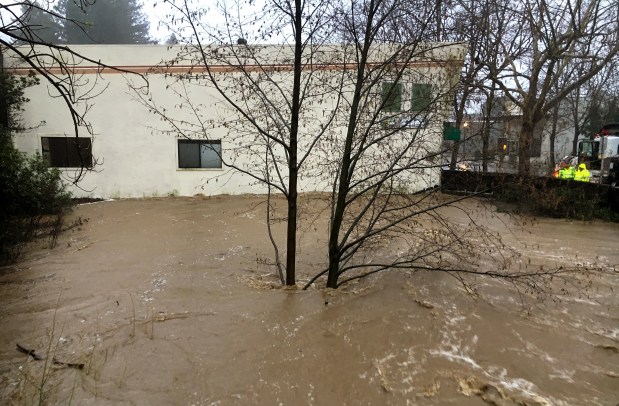 Floodwaters lap against a building along San Anselmo Avenue in San Anselmo during a storm on Feb. 7, 2017. The flooding forced evacuations in the area. (Robert Tong/Marin Independent Journal)
Originally Published: October 12, 2025 at 1:00 PM PDT