
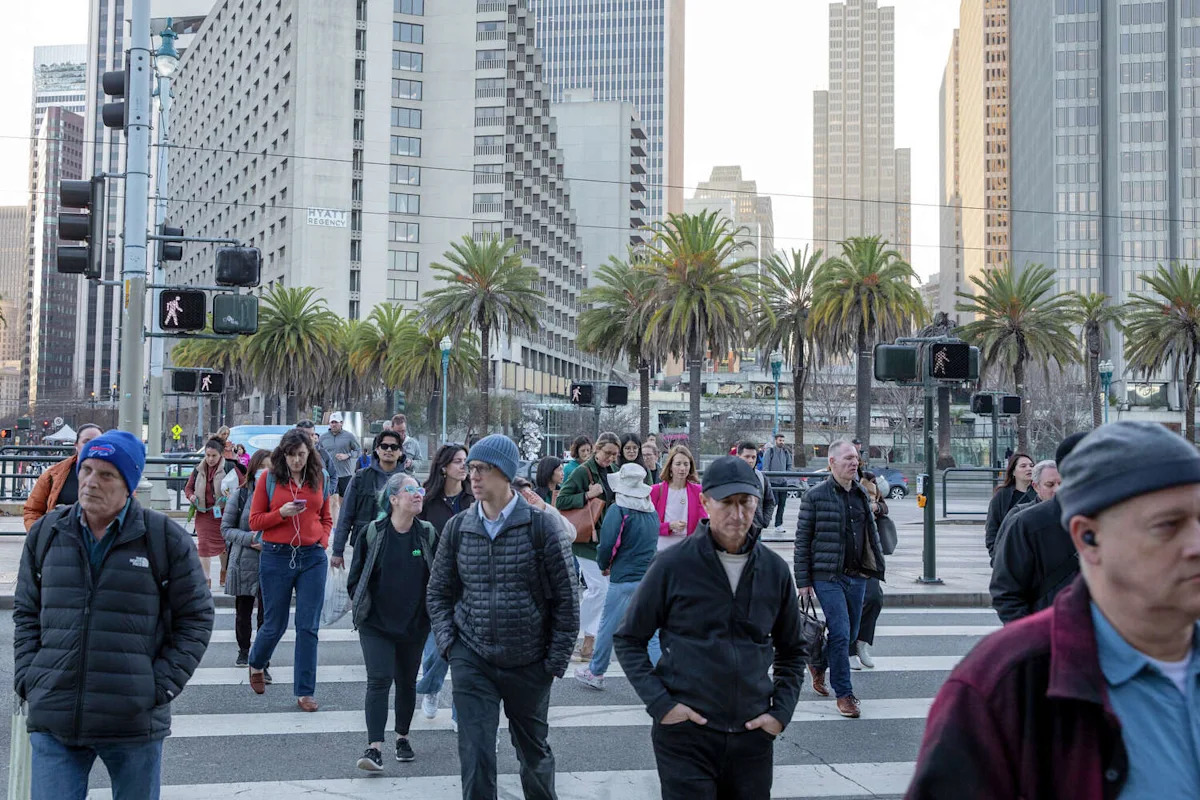
California contains multitudes. Its powerhouse industries, from tech to Hollywood to agriculture, have shaped the Golden State, influencing affordability, migration and ultimately, who lives where.
The result is a demographic landscape with distinct regional patterns.
To see how those patterns vary across the state, the Chronicle analyzed recently released U.S. Census Bureau population estimates that break down county populations by age, race and ethnicity in 2025. The Census treats Hispanic origin as an ethnicity rather than a race, so people of any race may also identify as Hispanic. As is common among demographers, the Chronicle grouped Hispanic residents of all races together and counted each racial group only among non-Hispanic residents, preventing overlap.
Using that data, the Chronicle created an interactive map to visualize which combination of age and race or ethnicity has the largest population in each California county.

White people in their 60s and 70s are most numerous in coastal enclaves like Marin, San Luis Obispo and Santa Cruz counties, as well as in the northern- and eastern-most parts of the state. But in the more affordable Central Valley and Inland Empire, Hispanic children between 10 and 19 abound. But some counties break that pattern: Hispanic children in their teens are also most numerous in Santa Barbara and Ventura, for example.
Near major job centers like the Bay Area, Los Angeles and San Diego, young adults predominate. In Alameda County and on the Peninsula, people who identify as Asian who are in their 30s were the most common demographic group, while in San Francisco, White people in their 30s were most prevalent. In Los Angeles, Orange and San Diego counties, Hispanic people between 20 and 29 outnumber any other age and demographic group.
There are some pockets of northern California where young adults are more common as well: In Yolo and Solano counties, Hispanic people between 20 and 29 are the most numerous demographic group, while in Butte and Yuba counties, White people in their 20s and 30s were largest.
Subscribe
There’s more to San Francisco with the Chronicle. Subscribe today for just 25¢.
This article originally published at White 30-somethings dominate S.F. Here’s the most common demographic in every county.