
About half of the largest emissions reduction in California’s cap-and-trade program came from clean power that already existed.
One of the central challenges in reducing greenhouse gas (GHG) emissions through local mandates, standards, or emissions caps is mitigating the risk of emissions leakage. Leakage is shifting emissions-creating activity away from regulating jurisdictions toward jurisdictions with less strict, or no, regulation. Various mechanisms have been proposed to discourage leakage, including border taxes on carbon-intensive imports and output-based subsidization of local industry. The European CBAM is the hottest new mechanism, but California has been trying to stem leakage from its electricity sector for over a decade, and its experience can be informative of what we might expect of similar efforts elsewhere.
California’s electricity sector during the last decade has been an acute setting for this concern. As part of a suite of policies adopted to meet California’s ambitious GHG reduction goals, the California Air Resources Board (CARB) developed a cap-and-trade program (recently rebranded as cap-and-invest – next will be “cap-and- puppies!”) that took effect in 2013.
More than a decade after implementation, annual CA GHG emissions from the covered sectors had fallen by roughly 15 percent. One sector played an outsized role in achieving these reported reductions: emissions attributed to imported electricity. Although emissions from electricity imports accounted for only about 10 percent of covered emissions in 2012, they delivered almost half of the reported reduction across all covered sectors, falling from about 44 mmTons in 2011 to under 15 mmTons by 2021.
Why Imports Are a Hard Case
Emissions from a power plant in California are measured at the stack. Emissions from electricity imports are not, but, unlike most other cap-and-trade markets, imports are still covered under the cap. Under CARB’s Mandatory Reporting Regulation, an entity that buys power outside California is responsible for identifying the source of that power and surrendering allowances for the associated emissions. This “first deliverer” design was a deliberate and, I think, largely correct response to a real threat. Simulation work from before the program started predicted that capping in-state generators while leaving imports alone would produce leakage close to one-for-one. California gas plants back down, Utah gas plants ramp up, nothing happens to the atmosphere.
Charging importers for the carbon content of what they bring in blocks that direct leakage channel. But it opens another one. Importers now have every incentive to procure low-carbon energy, and the cheapest way to procure low-carbon energy is often to buy it from a dam or a nuclear plant that already exists. If that resource was already serving customers in Oregon or Arizona, and those customers now buy from a dirtier source, California’s reported emissions fall and west-wide emissions don’t move at all. We knew that this “reshuffling” strategy was also a real risk. Studies by myself and others showed that there was ample low carbon electricity sloshing around the west to facilitate these kind of trades.
In a new working paper, Kevin Novan and I have now done the forensic accounting of how much of California’s greening of imported electricity can be traced to west-wide emissions reductions and how much of it is reshuffling. The answer is about half. This can be seen as a glass is half-empty or half-full result, depending on your expectations.
Following the Megawatt-Hours
In the paper, Kevin and I deploy two independent methods to measure how much leakage there may have been. The most direct method categorizes the reported changes in imported sources and compares those changes to results at the power plants. If a source that started selling more energy to California really was generating additional clean energy, its total output should have gone up. If it was simply redirecting energy it was already producing, its total output should be flat while its California sales climb. So we combined CARB’s import data with plant-level generation and capacity data from EIA and EPA, and traced each source category on both dimensions at once.
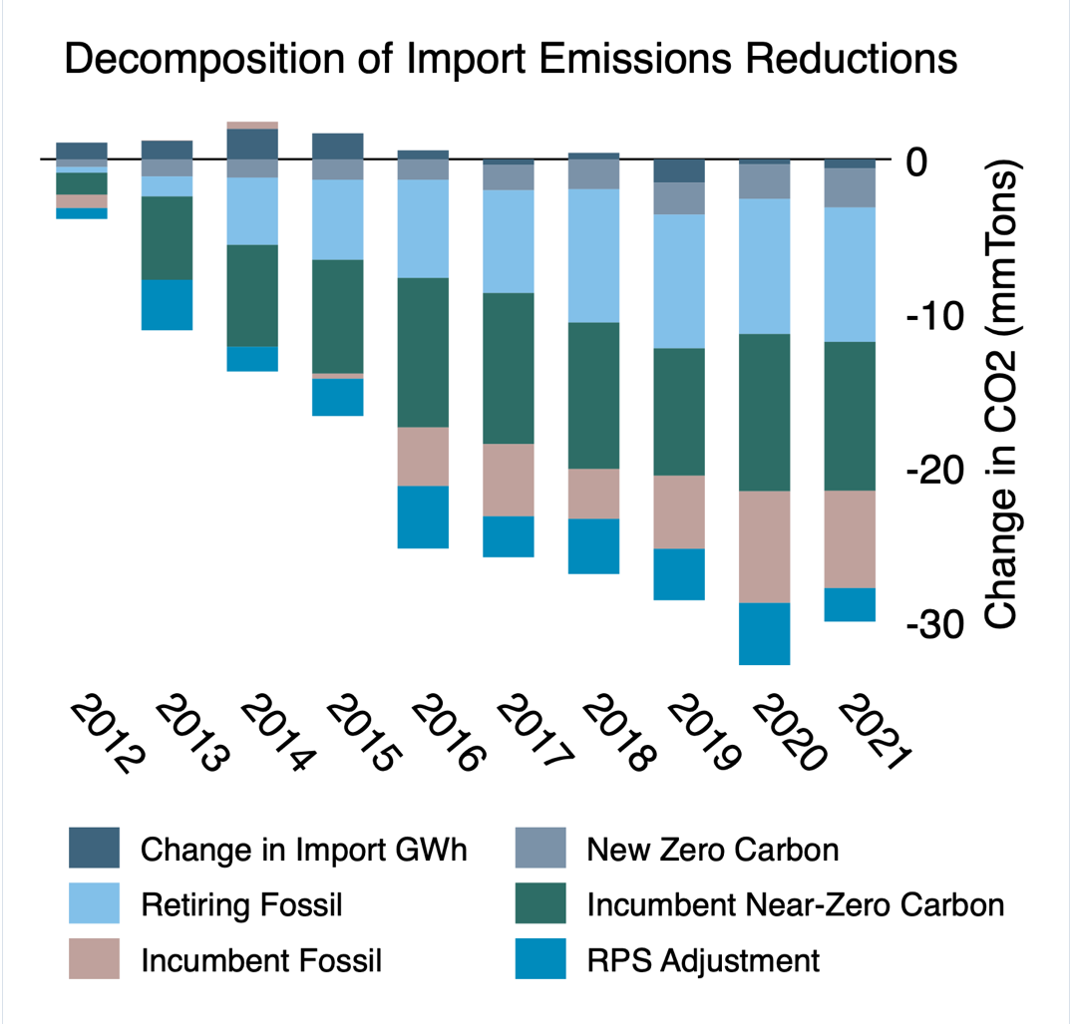
Between 2011 and 2021 annual emissions from imports declined by about 29 million tons per year. The data lets us decompose the 29 million ton reduction into six channels and sort them into reductions that show up in west-wide output and reductions that don’t.
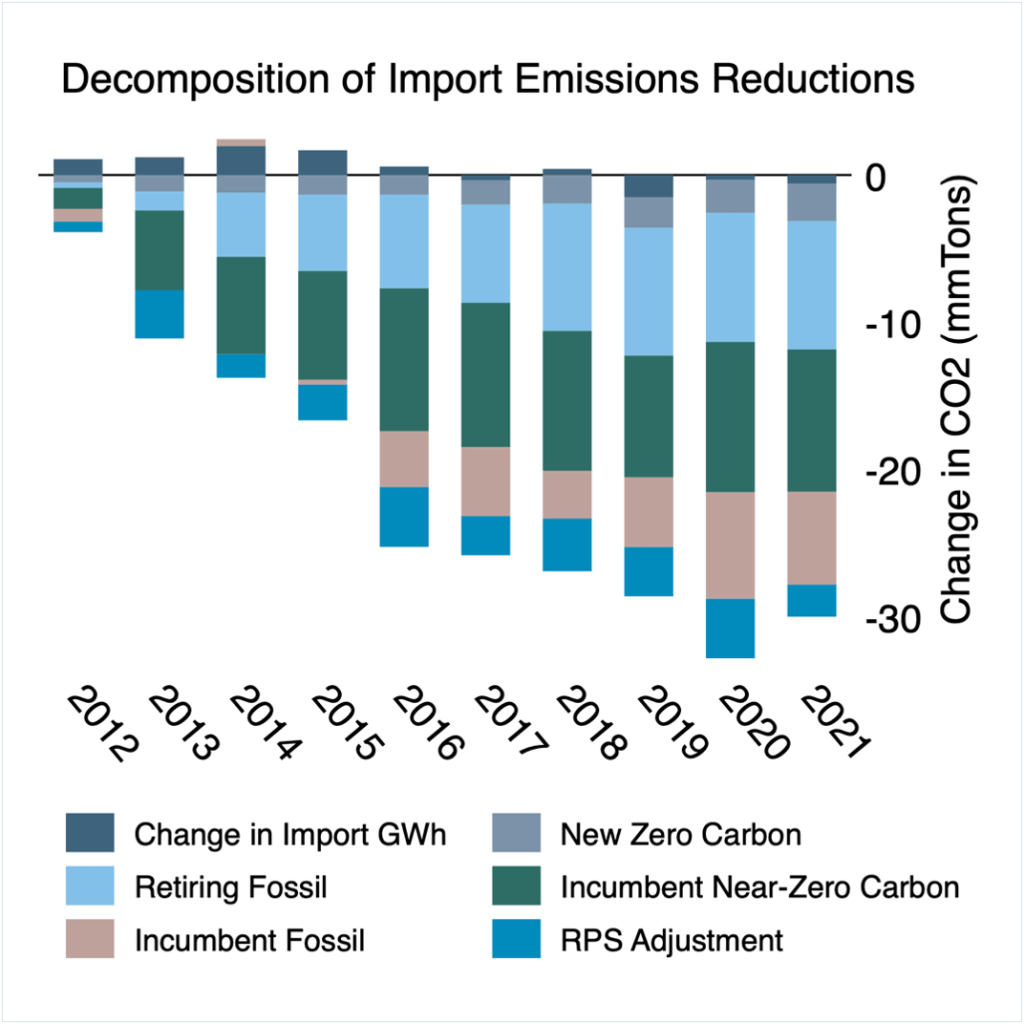
Decomposition of the cumulative reduction in reported import emissions relative to 2011, by channel.
A good deal of it is clearly real, and this deserves emphasis. Out-of-state coal capacity fell about 26 percent over the decade, and for the plants that retired units, their total output fell as much as or more than their sales into California. A reshuffled unit keeps generating and sells elsewhere; these units shut down.
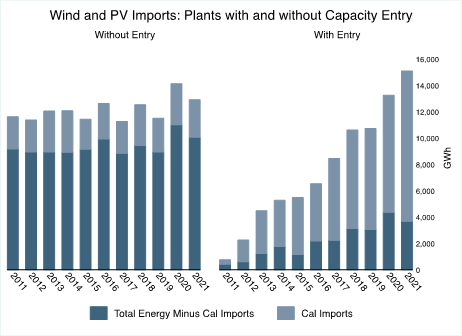
Essentially all of the growth in imported renewables came from facilities with no pre-2011 capacity, meaning new construction rather than reassignment of existing wind and solar. Import volumes themselves fell somewhat, which is also a real reduction. A sixth category, the RPS adjustment, credited utilities for renewable energy that is not imported into California, and is genuinely hard to classify.
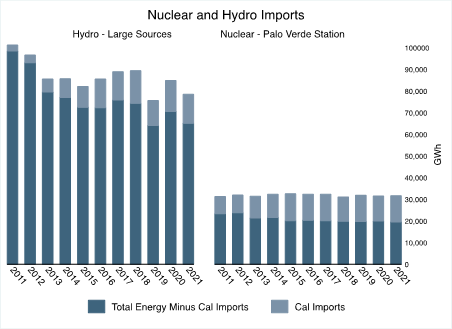
Nuclear and hydro look nothing like coal. Reported imports from the Palo Verde nuclear station in Arizona rose about 50 percent, from roughly 8,000 to 12,000 GWh per year, while Palo Verde’s total output sat unchanged at just over 30,000 GWh. The extra sales to California came from reducing sales elsewhere, not from new production. The same pattern holds for specified large hydro, whose imports to California rose while total output fell, and for a fast-growing category reported only as “primarily hydropower,” which carries a near-zero rate and can’t be traced to a plant at all.
The comparison with the western grid as a whole tells the same story. The low-carbon share of California’s reported imports rose far faster than the low-carbon share of western generation overall. California was drawing an increasingly clean slice from a pool whose own composition was changing much more slowly.
Adding it up, roughly half of the 29 million tons traces to increased imports from existing near-zero-carbon sources and to shifts in the volume and carbon intensity of fossil imports. Whoever had been buying that hydro and nuclear energy before had to replace it with something, and that something was dirtier.
Who’s Buying the Hydro?
We can’t link a specific import to a specific California retailer, but California retailers must file details with the California Energy Commission in the Power Source Disclosure program. These data are suggestive, and they point somewhere the program’s designers weren’t looking in 2012. In 2012, the concern was that legacy utilities would shed coal plants to other out-of-state utilities and replace them with clean imports from existing resources. However, over the last decade, community choice aggregators (CCAs) have taken a large share of retail load away from legacy utilities. A newly formed CCA has no dirty legacy portfolio to shed, so when it contracts with existing out-of-state hydro to serve its new customers, that isn’t reshuffling in any sense CARB’s rules contemplate. The utilities, having lost the load, cut their higher-carbon imports. At the system level the outcome is nearly identical to an incumbent swapping coal or gas for hydro. What got reshuffled was the customers.

I don’t want to attribute motives here. My sense is that CCAs were mainly trying to assemble and market low-carbon portfolios as fast as possible, but one consequence was a rapid drop in reported import emissions.
Is There Some Kind of Rule Against This?
Not really, and not for lack of trying. It’s much easier said than done, especially for a single US state operating within the limits of the US constitution. From 2010 to 2013 CARB worked hard on rules to mitigate power-sector reshuffling without disrupting the western market, constrained throughout by the interstate commerce clause — you cannot simply forbid buying clean power from a neighboring state. What emerged was a list of thirteen “safe harbor” transaction types CARB would not pursue as reshuffling. As far as we know this activity fell within those safe harbors.
There were also exploratory discussions about penalizing the most flagrant version of the problem by adjusting the free allowance allocation: if PG&E dropped a fossil import in favor of an existing zero-carbon source, CARB could claw back allowances and negate the benefit. That was never codified, and the CCA migration has since weakened the link between allocation and retail service enough that it probably wouldn’t have bitten anyway.
We are not aware of any of these trends constituting a violation. That is precisely the point. Meaningful leakage was possible entirely within the rules.
What This Means for the CBAM
California’s first-deliverer program is the closest thing we have to a natural experiment on border carbon adjustments. The EU’s Carbon Border Adjustment Mechanism is built on the same logic: assign emissions to imports based on the carbon intensity of the specific facility that produced them. Washington State’s program does the same thing for electricity.
Three lessons seem worth carrying over. First, the design does work against the channel it was built for. Out-of-state coal did not quietly redirect its output away from California — it retired, and new renewables actually got built. That is a genuine accomplishment and shouldn’t get lost.
Second, facility-level attribution creates an unavoidable incentive to select the cleanest slice of an unchanged production pool. Fowlie, Petersen and Reguant (2021) made this point about heterogeneous producer intensity. Our results are what that looks like in practice. A steel or cement exporter with multiple facilities has exactly the option California’s importers had, and enumerating prohibited transactions after the fact is not going to catch it. The more promising check is aggregate: does the reported reduction line up with what actually changed in the exporting region’s output?
Third, electricity should be the easy case. Plants are individually metered, output is reported hourly, and the EPA’s Continuous Emissions Monitoring System gives us stack-level CO2 for nearly every fossil unit in the country. If reshuffling is this hard to detect with that much data, I am not optimistic about verifying facility-level carbon intensity for cement clinker arriving at Rotterdam.
The European designers of the CBAM have one big advantage over California’s regulators: they don’t have to worry about the US constitution’s interstate commerce clause. This clause largely prevented California from simply assigning a generic emissions rate to all imported energy. To do so would have discriminated against low carbon energy outside of California. But this is also the most effective way of preventing reshuffling. If all imports are treated the same there is no need to line up the clean sources for imports.
Follow us on Bluesky, LinkedIn, and our new Instagram. Also subscribe to our email list to keep up with future content and announcements.
Suggested citation: Bushnell, Jim. “California’s Electricity Imports Are Much Cleaner. How Much of it is Real?” Energy Institute Blog, August 3, 2026, https://energyathaas.wordpress.com/2026/08/03/californias-electricity-imports-are-much-cleaner-how-much-of-it-is-real/