
Highlights
The national luxury threshold (90th percentile) fell to $1,250,750 in July, down 2.7% year over year, marking the 28th straight month of annual decline.
Austin posted the steepest luxury price drop in the country, with its threshold down 9.6% year-over-year to $1,262,726, more than 3 times the national pace.
Boston and San Francisco tied for the second-steepest decline, both down 8.6% year-over-year, though the two markets are moving for very different reasons.
San Francisco’s million-dollar listing count fell 20.9% year over year, even as homes there sell in a median of 37 days, the fastest pace of any luxury metro tracked, pointing to a market clearing out rather than cooling off.
California accounts for 4 of the 10 metros with the steepest luxury price declines: San Francisco, San Diego, San Jose, and Oxnard.
National Luxury Overview
Pricing
July 2026
Monthly Change
YoY Change
Luxury Threshold 90th Percentile
$1,250,750
-2.1%
-2.7%
High-End Luxury Threshold 95th Percentile
$1,973,160
-1.2%
-1.2%
Ultraluxury Threshold 99th Percentile
$5,427,818
-1.6%
-1.7%
Million-Dollar Listing Share
13.2%
-0.5pp
-0.6pp
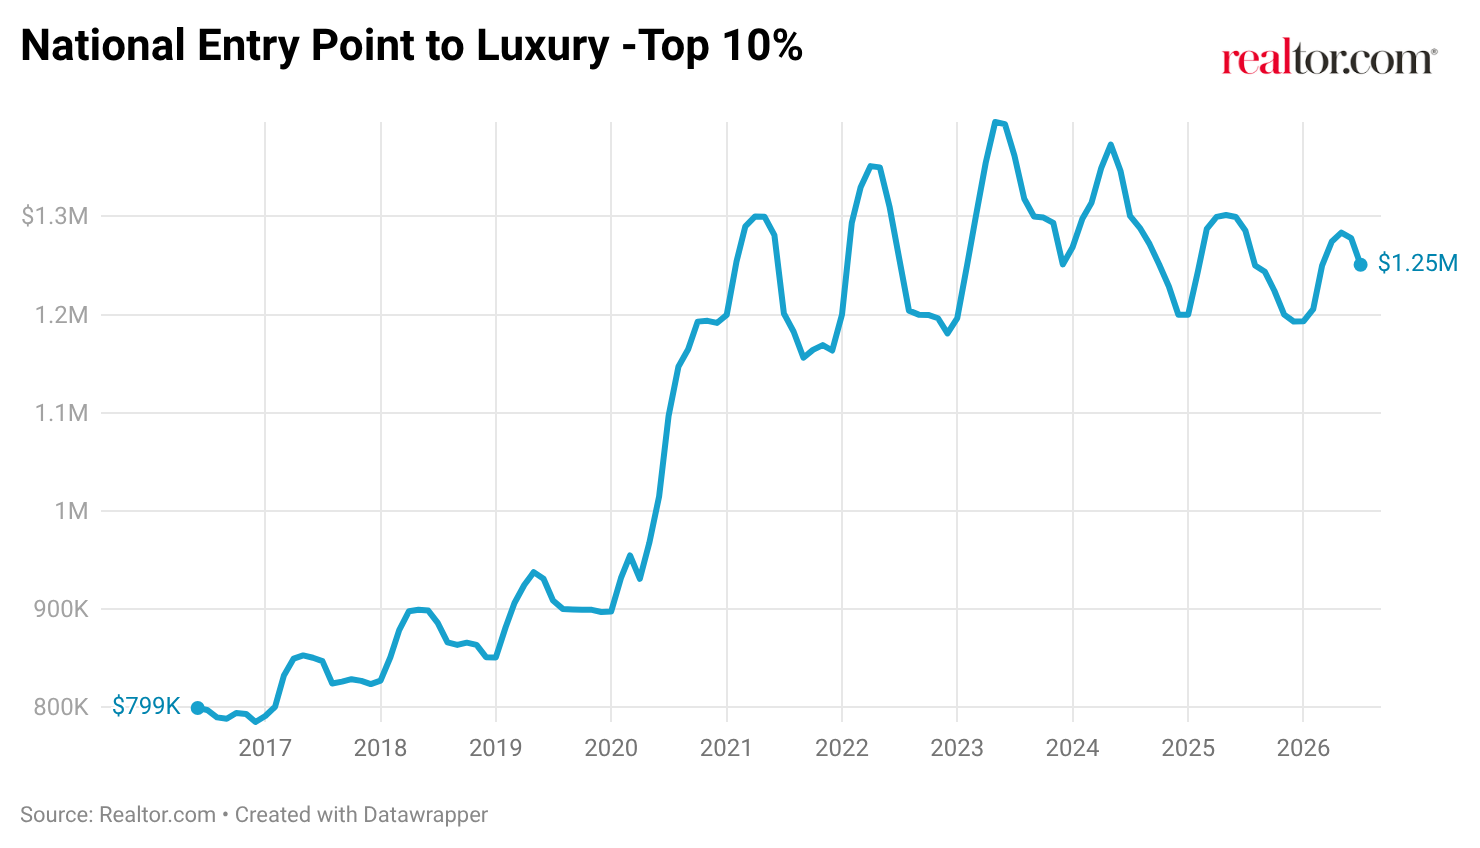
The national entry point to luxury slipped to $1,250,750 in July, 2.7% below July 2025. This is the 28th straight month of annual decline, widening from June’s 1.7% drop. The pattern held across tiers, with high-end luxury (95th percentile) down 1.2% year over year and ultraluxury (99th percentile) down 1.7%. The million-dollar listing share stood at 13.2% of all active listings in July, down 0.6 percentage points from both June (13.7%) and July 2025 (13.7%). Seven-figure-plus homes are a modestly shrinking slice of the market as the luxury price thresholds themselves keep easing.
Pace of the Luxury Market
Indicator
July 2026
Monthly (Days)
YoY (Days)
Median Days on Market 90th Percentile
68
5 days slower
3 days faster
Median Days on Market 95th Percentile
76
7 days slower
3 days faster
Median Days on Market 99th Percentile
91
4 days slower
5 days faster
Median Days on Market Median Listing
57
4 days slower
1 day faster
Luxury homes took longer to sell in July than in June across every tier, which is typical for the midsummer season, however, all four tiers are still moving faster than they were a year ago. The 90th percentile sold in a median of 68 days, 3 days faster than July 2025. The pattern was similar at the 95th percentile (76 days, 3 days faster year over year) and 99th percentile (91 days, 5 days faster year over year). The overall median listing came in at 57 days, 1 day faster than a year ago.
Top 10 Most Expensive Metropolitan Luxury Markets
Rank
Area
10% Most Expensive Listings Start at:
10% Most Expensive MoM
10% Most Expensive YoY
Average Annual Million-Dollar Listings Count
Multiple to National Luxury Threshold
1
Bridgeport-Stamford-Danbury, CT
$4,130,000
-1.7%
-5.5%
524
3.3
2
Los Angeles-Long Beach-Anaheim, CA
$3,997,157
-2.5%
-3.8%
9208
3.2
3
Kahului-Wailuku, HI
$3,950,000
0.2%
-0.8%
711
3.2
4
Naples-Marco Island, FL
$3,687,718
-1.2%
5.5%
2150
2.9
5
San Jose-Sunnyvale-Santa Clara, CA
$3,273,750
0.8%
-6.9%
1066
2.6
6
Oxnard-Thousand Oaks-Ventura, CA
$2,949,150
-1.6%
-6.0%
637
2.4
7
New York-Newark-Jersey City, NY-NJ
$2,851,904
-3.8%
-3.0%
11488
2.3
8
Crestview-Fort Walton Beach-Destin, FL
$2,806,764
-2.3%
-2.6%
1350
2.2
9
San Diego-Chula Vista-Carlsbad, CA
$2,766,487
-1.8%
-7.3%
2249
2.2
10
Atlantic City-Hammonton, NJ
$2,616,950
1.7%
4.8%
540
2.1
Bridgeport-Stamford-Danbury, CT, held on to the top spot with its 90th-percentile threshold at $4,130,000, down 5.5% year over year, but little changed from where it’s sat the past two months.
At the other end of the list, Atlantic City-Hammonton, NJ, stepped into the No. 10 spot this month, passing San Francisco-Oakland-Fremont, CA.
The rest of the list held its shape: Los Angeles-Long Beach-Anaheim, CA, and Kahului-Wailuku, HI, again held the No. 2 and No. 3 spots, with Kahului’s threshold nearly flat year over year at -0.8%, the mildest annual move in the top 10. Naples-Marco Island, FL (+5.5%), and Atlantic City (+4.8%), were the only two markets in the group to post year-over-year gains.
Metros with the Largest Annual Price Drops
Rank
Area
10% Most Expensive Listings Start at:
Top 10% Listings YoY
Million-Dollar Listing Count YoY
Median Days on Market – Million Dollar Listings
Share of Million Dollar Listings
0
USA
$1,250,750
-2.7%
-2.0%
66
13.2%
1
Austin-Round Rock-San Marcos, TX
$1,262,726
-9.6%
-17.8%
78
14.1%
2
Boston-Cambridge-Newton, MA-NH
$2,485,340
-8.6%
7.4%
53
36.3%
3
San Francisco-Oakland-Fremont, CA
$2,490,089
-8.6%
-20.9%
37
43.2%
4
San Diego-Chula Vista-Carlsbad, CA
$2,766,487
-7.3%
-16.6%
46
42.9%
5
Washington-Arlington-Alexandria, DC-VA-MD-WV
$1,406,428
-7.0%
1.7%
45
17.6%
6
San Jose-Sunnyvale-Santa Clara, CA
$3,273,750
-6.9%
-1.6%
38
62%
7
Oxnard-Thousand Oaks-Ventura, CA
$2,949,150
-6.0%
-11.2%
53
46.5%
8
Denver-Aurora-Centennial, CO
$1,269,259
-5.9%
-15.7%
57
15.3%
9
Charleston-North Charleston, SC
$2,165,450
-5.5%
1.6%
68
21.4%
10
Bridgeport-Stamford-Danbury, CT
$4,130,000
-5.5%
-4.0%
51
41.1%
The national threshold for luxury is down 2.7% from 1 year ago. Ten metros fell at least twice as fast. Austin leads the group. Its luxury entry point dropped to $1,262,726, down 9.6% year-over-year, the steepest decline of any market tracked and more than 3 times the national pace. Million-dollar listings in Austin also had a sharp fall, down 17.8% from last year. Austin’s higher-end tiers moved in step, with the 95th percentile down 9.6% and the 99th percentile down 5.4%.
Boston and San Francisco follow at -8.6% each, though the two markets got there differently. Boston’s million-dollar listing count grew 7.4% year-over-year. San Francisco moved the opposite way: its million-dollar count fell 20.9% year-over-year. However, San Francisco luxury is also the fastest-moving of the 10, at a median 37 days on market for million-dollar listings, hinting at a market with a different undertone than the surface data suggests.
California accounts for 4 of the 10 markets where luxury prices are falling fastest (San Francisco, San Diego, San Jose, Oxnard). San Jose remains the most concentrated luxury market in the country, where 62% of active listings top $1 million, yet its threshold still slipped 6.9% and its 99th percentile fell 12.6%.
San Francisco: A Lower Bar Is Not a Weaker Market

San Francisco, California: A view of homes in North Beach – Heather Diehl/Getty Images
San Francisco-Oakland-Fremont posted one of the steepest luxury threshold declines in the country, with the entry point to the top 10% of listings falling 8.6% year over year to $2,490,089. On the surface, the initial read may give a false impression of what’s going on in the market. A drop in home prices typically signals softening demand and an overdue recalibration, but homes in San Francisco are still routinely selling above asking price. In fact, the metro is currently classified as a Seller’s market in the second quarter of 2026. Million-dollar listings are also selling quickly here, with a median of 37 days on the market, the fastest among the overall luxury metro list. This is nearly twice as fast as the national average for million-dollar homes,, which stands at 66 days on the market. Much of the same goes for the San Jose metropolitan area, where homes are also selling quickly, with a median of 38 days on market for million-dollar listings.
The decline is coming from a pool that’s emptying, not one that’s stalling. Another number that may suggest different things at the surface is the number of million-dollar listings. In some markets, this could mean sellers priced just above $1 million have delisted, cut their price, or that new listings are simply coming in below where they would have priced a year ago. However, in a fast-moving metro, it can suggest that more homes are coming off of the market as more buyers compete for them. The San Francisco metro million-dollar property count fell 20.9% from a year ago. Million-dollar properties here are selling faster than new ones are coming on the market.
The demand driving that turnover has a specific source. The AI buildout has pulled an extraordinary amount of capital and hiring into the region, and the wealth it has generated is concentrated in exactly the buyer pool that competes at the top of this market. What looks like a market marking itself down may be a market clearing itself out.
All data in this report is sourced from Realtor.com® listing trends as of July 2026, reflecting active inventory of existing homes, including single-family residences, condos, townhomes, row homes, and co-ops. Listings reflect only those provided by MLS platforms to Realtor.com via a listing feed. New-construction listings are excluded unless actively listed on participating MLSs.
Luxury segmentation is based on market-specific price percentiles, with the 90th percentile representing entry-level luxury, the 95th percentile marking high-end luxury, and the 99th percentile indicating ultraluxury. All calculations are based on listing prices, not final sales prices.
Metropolitan and micropolitan areas are defined using the Office of Management and Budget’s OMB-2023 delineations, with Claritas 2025 household estimates used for relative comparisons. Where appropriate, we limited analysis to metros or micros with a minimum threshold of active million-dollar listings on average over the past year to ensure meaningful comparisons.
Historical listing trend data extends to July 2016, but year-over-year comparisons in this report use July 2025 as the baseline.
Luxury by the Numbers
90th percentile = Entry-level luxury (top 10% of prices)
95th percentile = High-end luxury
99th percentile = Ultraluxury (often rare or custom properties)