
Oakland’s pilot speed-ticket cameras are already making a difference by dramatically lowering speeds on most of the roads where they’re located, according to a study released today by Oakland’s Department of Transportation.
“Compared to baseline data in 2024, 2026 speed counts show the number of cars traveling 11 MPH or more over the speed limit decreased by an average of 70%,” the report stated. “This represents 20,000 fewer cars speeding in Oakland every day across all 18 locations.”
The baseline data referred to in the report was gathered during a 72-hour study conducted each summer for the last three years using pneumatic tube indicators, which send air pulses to a machine that calculates speed and other metrics of passing drivers.
The new cameras may not deserve all the credit. According to a graph of the baseline data provided to The Oaklandside, vehicle speeds declined significantly between 2024 and 2025, before the cameras went up, a phenomenon the city could not explain. That decline accelerated after the cameras were installed.
Other key findings: Most of the city’s citations were sent to non-Oakland addresses. And a handful of drivers accounted for a large share of speeding citations: 98 vehicles received more than 50 speeding citations in the six months covered by the study.
526,324 notices of violation
 One of Oakland’s 35 new speed cameras, on Broadway near 27th Street. Credit: Jose Fermoso for The Oaklandside
The city provided The Oaklandside with the speeding-vehicle counts at all 18 locations where the cameras are now located for those 72-hour studies in 2024, 2025, and 2026. The number of speeding cars traveling more than 10 miles an hour above the speed limit decreased by 42% between 2024 and 2025, before the cameras were installed, and by another 59% between 2025 and 2026, after the cameras were installed.
The city found that the cameras at the 7th Street location, between Adeline and Linden streets, showed the largest declines in speeding. That location, during the annual 72-hour studies, had 1,760 speeding vehicles in 2024, 341 in 2025, and 158 in 2026, representing year-over-year reductions of 81% and 54%, respectively.
The report found that the city has sent 121,473 warnings and 193,508 citations to drivers since citations began on March 15, 2026, after a two-month warning period. Warnings are sent to a vehicle’s owner after the infraction for exceeding the speed limit by 11 to 15 miles per hour, with tickets going out only on the second infraction. Owners of vehicles that speed by over 15 miles per hour receive a citation even if it’s their first time.
Tickets start at $50 and rise in cost as speeds rise. The 18 camera road locations, occupied by 35 total cameras, have a variety of speed limits.
The program’s two-month warning period started on January 15, when all infractions received only warnings. Combining all warnings and citations, the city has sent out 526,324 notices of violation this year.
The transportation department did not provide The Oaklandside with the number of people who have paid those citations, nor has it said how many low-income citation recipients applied to pay a reduced fee.
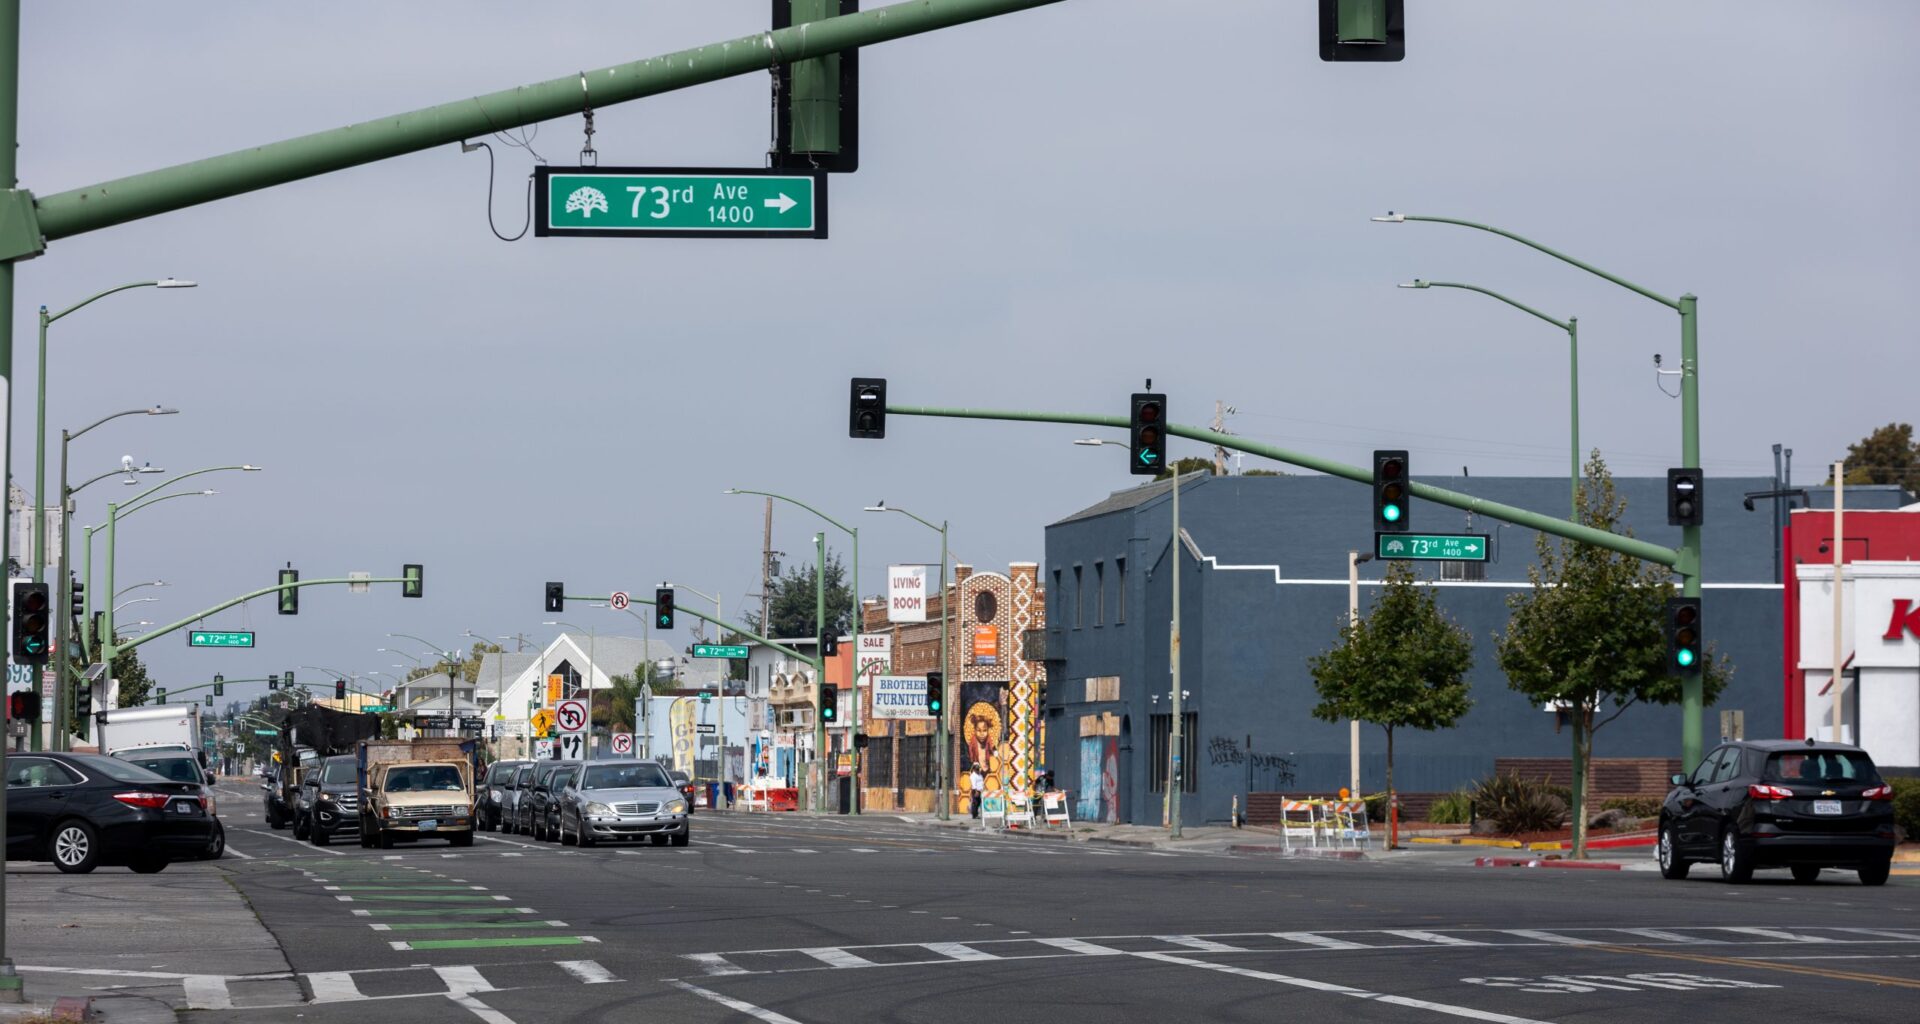
According to the city, the following five locations produced the most violations in the first six months of the program. The list is similar to a list included in the city’s first report from the spring, though some locations have moved up or down in the rankings. Even the worst location for speeding, the 73rd Avenue southbound road between Fresno Street and Krause Avenue, saw a reduction in average daily citations from the March report to today’s, from 320 to 253 a day.
• 73rd Ave. between Fresno St. and Krause Ave., southbound (253 per day, on average)
• Broadway between 27th and 28th sts., northbound (238 per day)
• Hegenberger Rd. between Spencer and Hawley sts., southbound (180 per day)
• West Grand Ave. from Chestnut to Linden sts., westbound (180 per day)
• Broadway between 27th and 28th sts., southbound (179 per day)
‘Making sure safety goes hand in hand with equity’
The data indicates that the specter of receiving a speeding citation may already be leading to fewer citations.
“While Oakland has issued a high volume of warnings and citations, both are trending downwards,” the city said.
Oakland Mayor Barbara Lee, in announcing the findings in a press release this morning, said she saw the cameras as a success.
“Our speed camera pilot program slows drivers down and keeps our streets safer — and with sliding-scale fines and community service options, we’re making sure safety goes hand in hand with equity,” she said.
Transportation director Josh Rowan, whose department manages the cameras, said the data would inform policy going forward. More importantly, he said, the citations might be making people more aware of how fast they drive. He told us that he’d heard from some people who had received citations that they didn’t realize they had been speeding so significantly over the limit.
“I think our cars are so comfortable and so quiet that I think a lot of times we don’t know how fast we’re going,” he said. “They perform so well, and we sort of hit these natural cruising speeds.”
“What I’m hoping is maybe it’s bringing a little more awareness to how fast we’re actually driving,” he said.
11 plates with more than 100 citations each
One of the most eye-popping data points released by the city is the number of individual vehicles with multiple citations. According to one table, 11 unique license plate numbers received 101 or more citations each, which is about one every other day. Another 87 plates received between 51 and 100 citations each.
The citation data provides one indicator that the cameras may be affecting driver behavior. More than half of vehicles that received a citation — 51% — did not receive another. Another 19% of cited vehicles received only two citations.
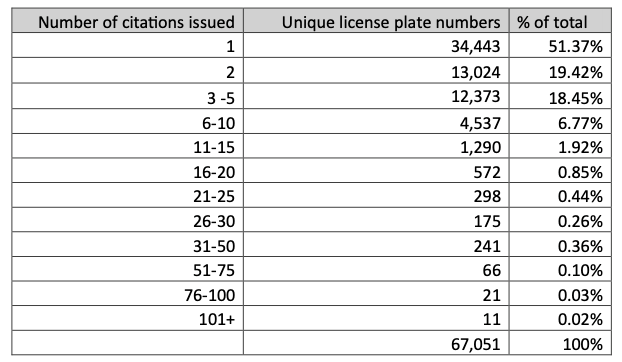 A chart from “Oakland Speed Safety Cameras: Six-Month Report,” based on speed camera data from January 14 to July 15, 2026, issued by Oakland’s Department of Transportation on August 20, 2026. Credit: Oakland Department of Transportation
The study found that most people who receive citations are relatively close to avoiding one, with the average citation-level speeding landing at 14 miles an hour above the speed limit, the lowest level $50 infraction.
Most camera locations clocked speeding drivers at 11 to 15 miles an hour above the speed limit on average, with the exception of the two cameras on Foothill Boulevard between 19th and 20th avenues, which recorded average speeds of 19 miles an hour above the speed limit. The city is in the process of making infrastructure changes to Foothill a few blocks east of where the cameras are located, including adding high-visibility crosswalks that may encourage traffic to slow down.
In an interview with The Oaklandside, Rowan, the transportation director, said the number of citations and warnings likely would have been higher if not for a “blackout” period between June 15 and July 15. That’s when the speed camera vendor, Verra Mobility, failed to process some violations in time to send them out due to a staffing shortage. The law that created the pilot speed camera program for Oakland and other California cities requires governments to provide written notice of a violation to the registered owner of the vehicle within 15 calendar days. In other words, an untold number of vehicle owners who should have received a citation got a free pass during that stretch.
“Verra explained to Oakland that its backlog was caused by higher violation volumes than estimated, as well as unexpected attrition in their processor training program when multiple candidates dropped out,” the report says.
58% of citations went to addresses outside of Oakland
Another notable data point: about 58% of the people who were mailed citations had an address outside of Oakland. “I think it reinforces that a lot of people who don’t live here are going to places here, and they’re cutting back and forth between 580 and [our roads],” Rowan said.
The transportation department is reviewing camera data to identify where new traffic-slowing infrastructure is most urgently needed. In San Francisco, the city used speed camera data to pinpoint poor infrastructure design that was enabling speeding. Rowan said his team is also looking at areas not covered by the speed cameras in order to better assess what impact they’re having.
“The cameras, I think, do a good job sort of reinforcing what we believe to be happening, but then there has to be some sort of follow-up action which changes the design,” Rowan said this week. “That includes challenging us about how to better engage with the community and explain what we’re trying to do.”
The director, who is starting his third year on the job, said implementing steps to make streets safer can often produce pushback. He noted that a stretch of 73rd Avenue is in the process of getting a new pedestrian and bike median that will narrow car lanes and slow down traffic, and that the plan has been criticized by many community members. One of the 73rd Avenue speed cameras had the most citations of any camera in the program over the last six months.
“They said, ‘We know we need safer streets, but we sure do feel surveilled,’” Rowan said. “It’s meeting a lot of resistance, because [there’s] this legacy of the city not acting in the best interest of that neighborhood.”
Rowan said his team is looking to group its road safety plans into three categories: Those that can be implemented within six months (usually using in-house crews), those that will require a six to 18-month window (often using contractors), and larger capital projects that can take longer, up to six to 10 years (requiring funds and participation by county, state, and federal agencies).
In recent weeks, the city has added new signage at camera locations to encourage drivers to slow down. The city also added “20 mph” paint markings on all lanes of 7th Street approaching Broadway and additional speed camera signs on Broadway itself, which has had some of the highest citation rates.
“*” indicates required fields