

A Comprehensive Look at FMBL’s Upcoming Payout, Dividend History, and Financial Health
Farmers & Merchants Bank of Long Beach FMBL recently announced a total dividend of $28 per share, with the ex-dividend date set for 2026-09-14. This amount includes a $28 per share cash dividend payable on 2026-09-30. As investors look forward to this upcoming payment, the spotlight also shines on the company’s dividend history, yield, and growth rates. Using data from GuruFocus, let’s look into Farmers & Merchants Bank of Long Beach’s dividend performance and assess its sustainability. Understanding these metrics is essential for value investors seeking reliable income streams and long-term capital appreciation.
What Does Farmers & Merchants Bank of Long Beach Do?
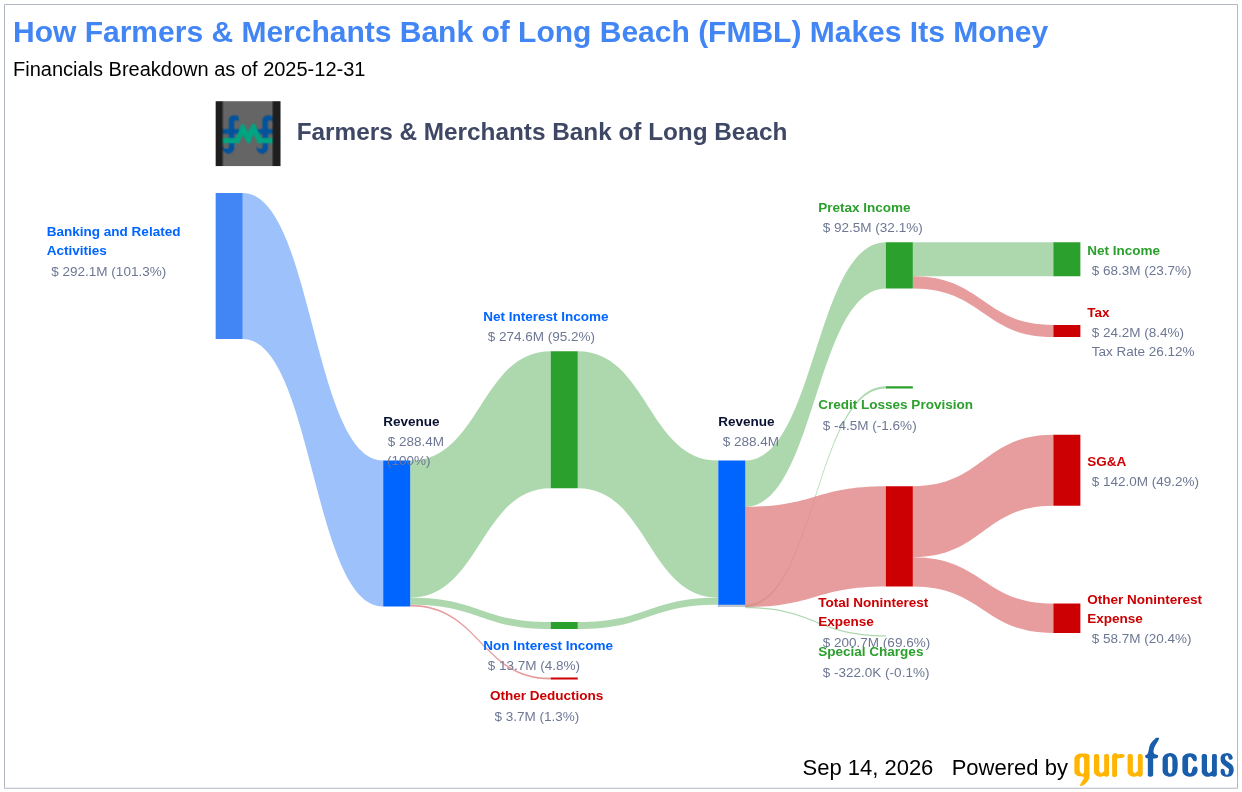
Farmers & Merchants Bank of Long Beach offers a broad range of banking products and services to individuals, professionals, and small to medium-sized businesses. The bank operates branches across California’s Los Angeles County, Orange County, and Santa Barbara County, supported by online and mobile banking platforms. As a full-service commercial bank, it provides services including demand, money market, savings, and time deposits, as well as loans such as commercial real estate, construction, commercial business, and residential loans, including single-family and multifamily financing, along with other business-oriented banking services. This diversified portfolio helps the bank maintain stability across economic cycles.
A Glimpse at Farmers & Merchants Bank of Long Beach’s Dividend History
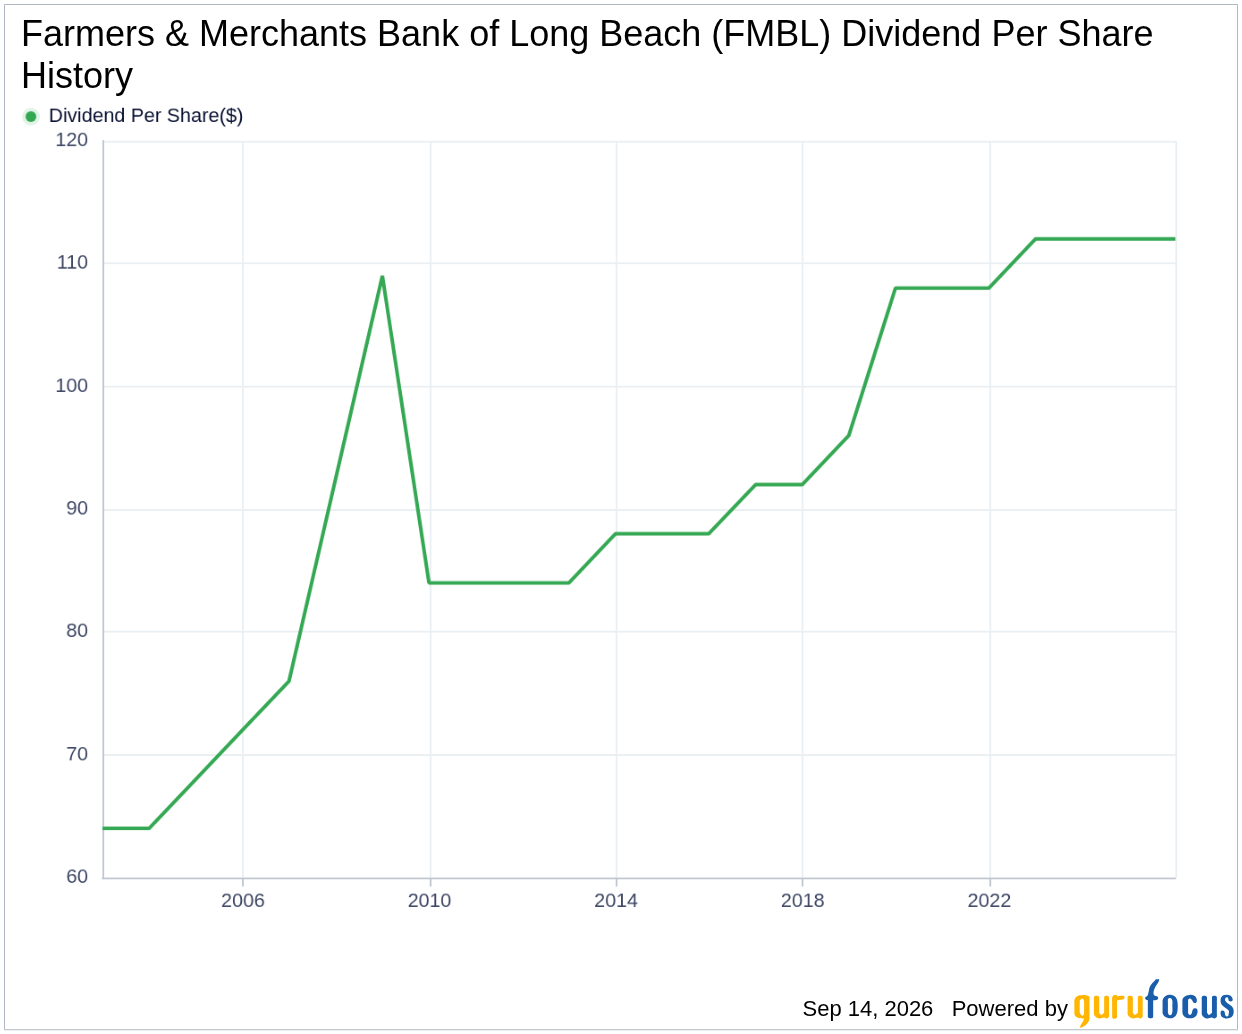
Farmers & Merchants Bank of Long Beach has maintained a consistent dividend payment record since 2001. Dividends are currently distributed on a quarterly basis. This long-standing commitment to returning capital to shareholders demonstrates the bank’s disciplined financial management and its prioritization of investor returns. Such consistency is a hallmark of reliable dividend-paying stocks.
Farmers & Merchants Bank of Long Beach has increased its dividend each year since 2009. The stock is thus listed as a dividend achiever, an honor that is given to companies that have increased their dividend each year for at least the past 17 years. Below is a chart showing annual Dividends Per Share for tracking historical trends.
Breaking Down Farmers & Merchants Bank of Long Beach’s Dividend Yield and Growth
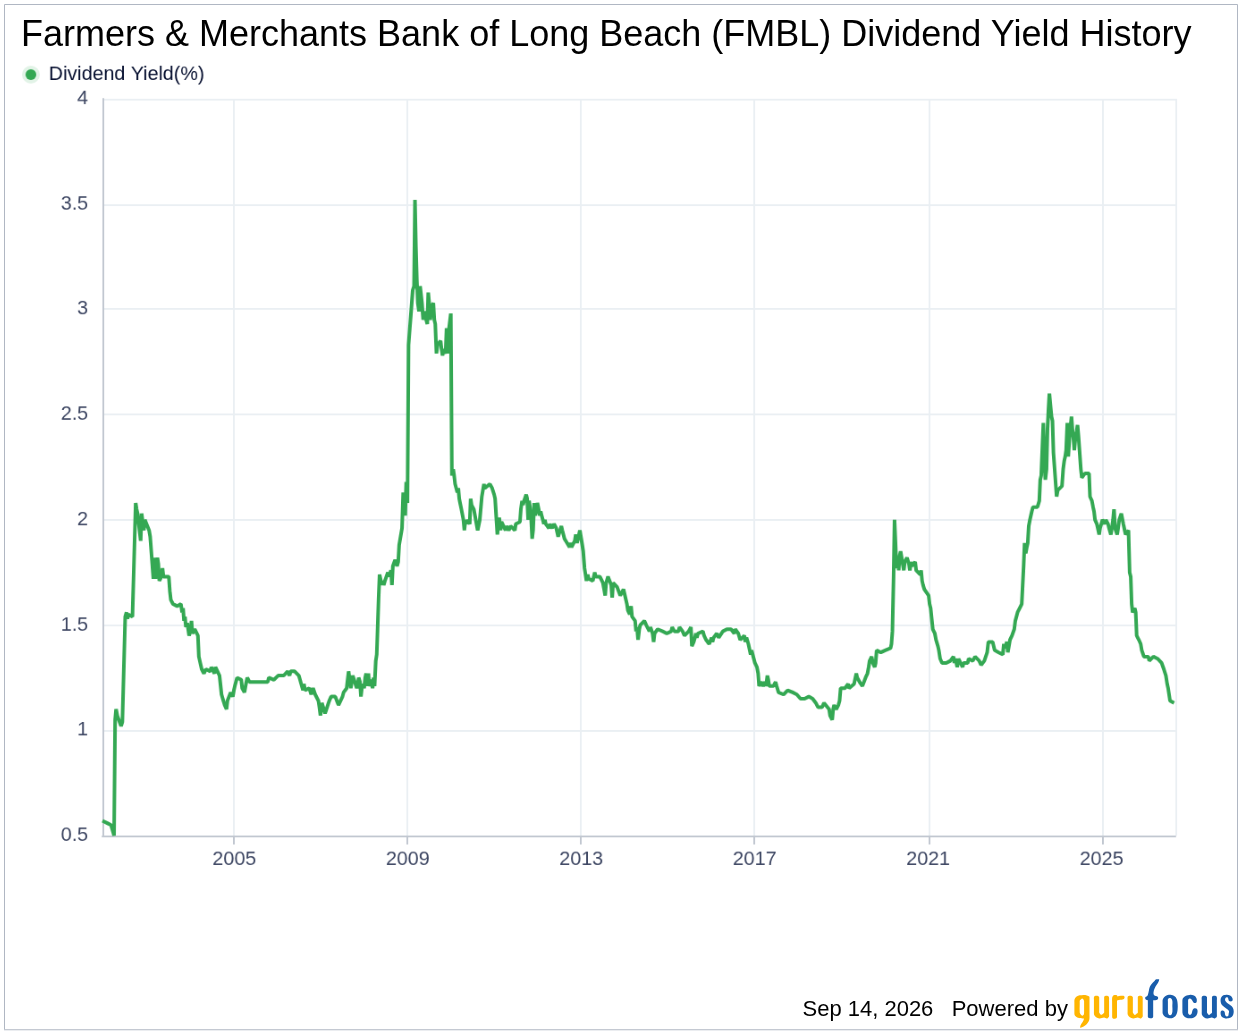
As of today, Farmers & Merchants Bank of Long Beach currently has a 12-month trailing dividend yield of 1.13% and a 12-month forward dividend yield of 1.13%. This suggests an expectation of the same dividend payments over the next 12 months. The trailing yield reflects actual payments made over the past year, while the forward yield estimates future payouts based on current dividend rates. For income-focused investors, these yields provide a baseline for evaluating the stock’s income potential relative to peers and fixed-income alternatives.
Extended to a five-year horizon, this rate increased to 0.80% per year. And over the past decade, Farmers & Merchants Bank of Long Beach’s annual dividends per share growth rate stands at 2.70%. These figures indicate a modest but steady upward trajectory in dividend distributions, which can be attractive for investors prioritizing gradual income growth over time.
Based on Farmers & Merchants Bank of Long Beach’s dividend yield and five-year growth rate, the 5-year yield on cost of Farmers & Merchants Bank of Long Beach stock as of today is approximately 1.18%. Yield on cost measures the annual dividend rate divided by the original purchase price, offering a useful perspective for long-term holders.
The Sustainability Question: Payout Ratio and Profitability
To assess the sustainability of the dividend, one needs to evaluate the company’s payout ratio. The dividend payout ratio provides insights into the portion of earnings the company distributes as dividends. A lower ratio suggests that the company retains a significant part of its earnings, thereby ensuring the availability of funds for future growth and unexpected downturns. As of 2026-06-30, Farmers & Merchants Bank of Long Beach’s dividend payout ratio is 0.16. This low ratio implies ample room for continued dividend payments even if earnings fluctuate.
Farmers & Merchants Bank of Long Beach’s profitability rank offers an understanding of the company’s earnings prowess relative to its peers. GuruFocus ranks Farmers & Merchants Bank of Long Beach’s profitability 5 out of 10 as of 2026-06-30, suggesting fair profitability. The company has reported positive net income for each year over the past decade, further solidifying its high profitability. This consistent earnings record supports the bank’s ability to sustain dividends through varying economic conditions.
Growth Metrics: The Future Outlook
To ensure the sustainability of dividends, a company must have robust growth metrics. Farmers & Merchants Bank of Long Beach’s growth rank of 5 out of 10 suggests that the company has a fair growth outlook. While not exceptional, this ranking indicates a balanced position that could improve with strategic initiatives or favorable market conditions.
Revenue is the lifeblood of any company, and Farmers & Merchants Bank of Long Beach’s revenue per share, combined with the 3-year revenue growth rate, indicates a strong revenue model. Farmers & Merchants Bank of Long Beach’s revenue has increased by approximately -3.10% per year on average, a rate that underperforms approximately 90.24% of global competitors. This decline warrants attention, as sustained revenue contraction could pressure future dividend growth.
The company’s 3-year EPS growth rate showcases its capability to grow its earnings, a critical component for sustaining dividends in the long run. During the past three years, Farmers & Merchants Bank of Long Beach’s earnings increased by approximately -14.40% per year on average, a rate that underperforms approximately 90.16% of global competitors. Negative EPS growth may signal challenges in maintaining or increasing dividend payouts without straining financial resources.
Lastly, the company’s 5-year EBITDA growth rate of -11.40% underperforms approximately 92.41% of global competitors. EBITDA, or earnings before interest, taxes, depreciation, and amortization, is a measure of operating profitability. A declining trend here suggests weakening operational efficiency, which could impact long-term dividend sustainability.
Next Steps for Dividend Investors
In conclusion, Farmers & Merchants Bank of Long Beach’s upcoming $28 per share dividend, payable on 2026-09-30 with an ex-dividend date of 2026-09-14, reflects its ongoing commitment to shareholders. The bank’s low payout ratio of 0.16 and consistent dividend history since 2001, including annual increases since 2009, underscore a conservative approach to capital distribution. However, the fair profitability and growth rankings, combined with negative trends in revenue, EPS, and EBITDA growth, present a mixed picture. Value investors should weigh these factors carefully, considering both the bank’s stable dividend record and its recent operational challenges. For those seeking high-yield opportunities, GuruFocus Premium users can screen for high-dividend yield stocks using the High Dividend Yield Screener. Will Farmers & Merchants Bank of Long Beach’s dividend remain a reliable income source, or will growth headwinds prompt a reassessment of its payout strategy?
This stock alert was generated using automated technology and GuruFocus financial data to provide readers with timely and accurate market reporting. This content was reviewed by GuruFocus editorial team prior to publication. Please send any questions or comments about this story to [email protected].