
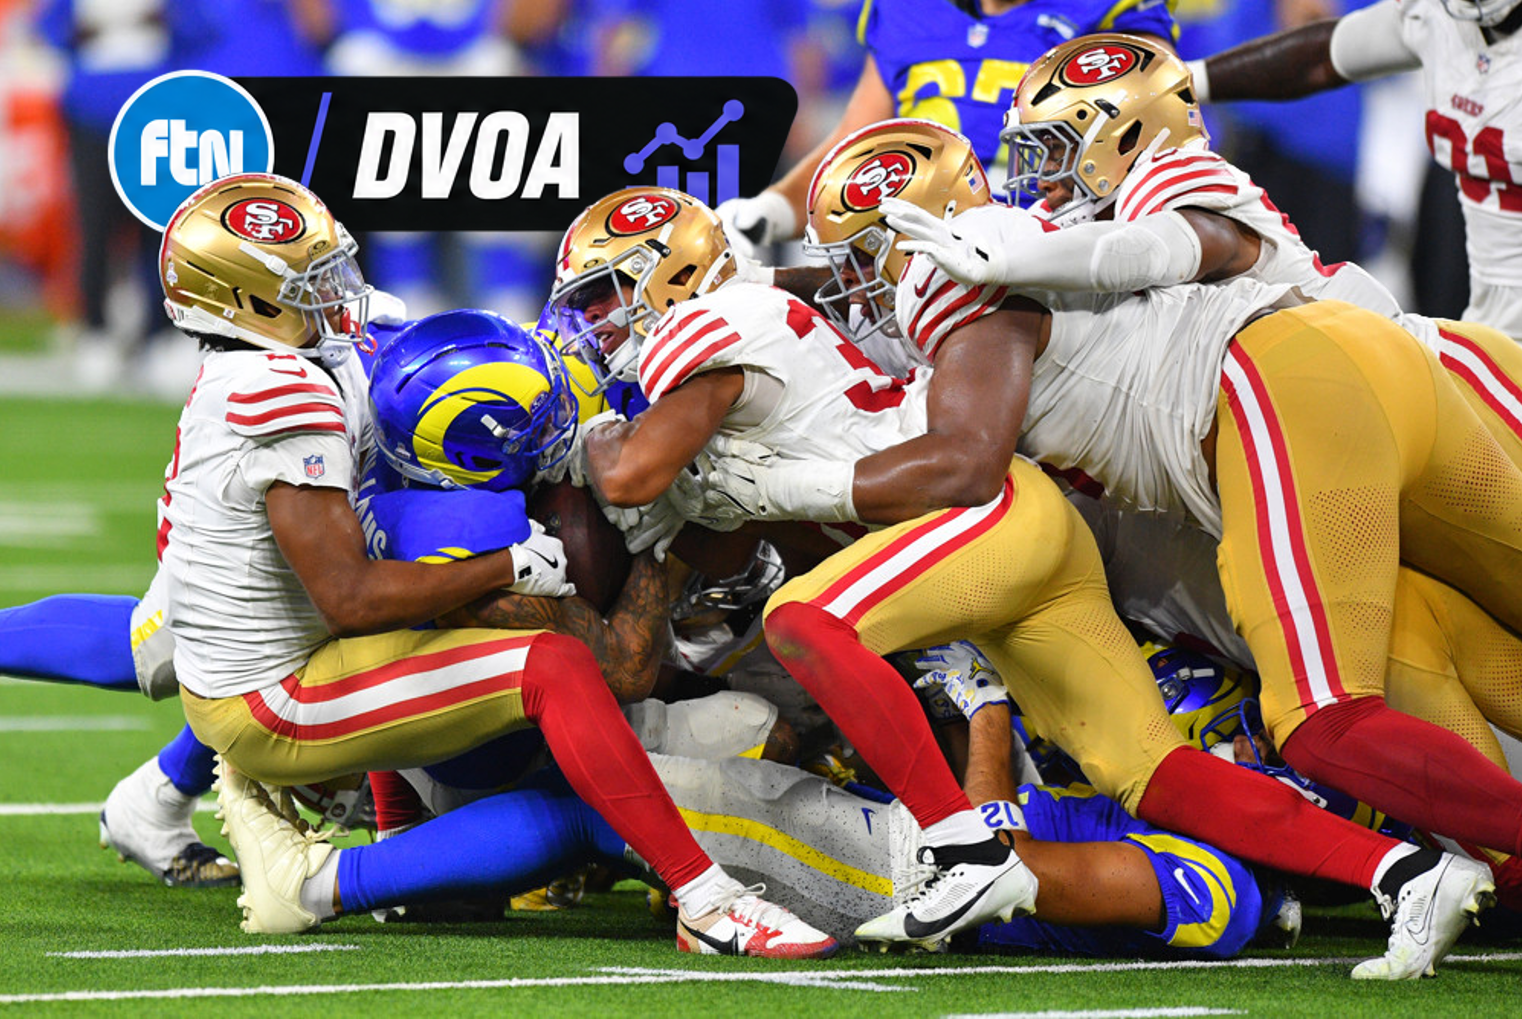
The San Francisco 49ers are No. 1 in DVOA after the first week of the NFL season, following their impressive win over the Super Bowl favorite Los Angeles Rams in Australia last Thursday. The 49ers have a new change in DVOA to thank for their position ahead of the Jacksonville Jaguars.
This year, for the first time, I am including opponent adjustments in DVOA during the first three weeks of the season instead of waiting until four games are in the books before I apply adjustments. The adjustments I’m using now are based entirely on last year’s adjustments. Opposing pass offense is adjusted to 50% of last year’s adjustments. Opposing run offense is 30% and opposing defense is 20%. (These numbers are based on some testing I did before the season to find what are hopefully the most accurate ratios for predicting future performance.)
Without these adjustments, Jacksonville would be first after their 34-10 win over Cleveland. But these new numbers reflect what we all know, which is that it is going to be a lot easier to beat the Browns than the Rams in 2026! Baltimore, Buffalo and Kansas City then round out the top five. Chicago is the top offense and Pittsburgh is the top defense.
(Note that the individual stats still do not include adjustments until after Week 4.)
For the most part, DVOA falls about as you would expect after Week 1. That’s not the way it usually is. Every 1-0 team is ranked ahead of every 0-1 team, and that’s really rare. Believe it or not, this is the first time in DVOA history (since 1977) that every 1-0 team has been positive and every 0-1 team has been negative. It’s only the third time that all of the winning teams have higher DVOA after Week 1 than all of the losing teams, following 1980 and 1993.
Seattle remains on top in our DAVE ratings which combine preseason projections with the results so far, but the Buffalo Bills move up to second and are now our Super Bowl favorites thanks to their win over another top AFC contender, the Houston Texans.
One other change we’re making in DVOA this year: after some research, we’ll be counting SoFi Stadium in Los Angeles as a dome stadium (actually, a retractable dome) for purposes of weather adjustments. Previously, we counted it as a warm weather stadium because it is open on the sides, but it is clear that passing and kicking is easier at SoFi than in other outdoor stadiums. This change will drop the offense and special teams ratings for the Rams and Chargers but improve their defensive ratings. At some point soon, we’ll have the 2020-2025 numbers also updated to reflect this change.
* * * * *
These are the FTN DVOA and DAVE ratings through one week of 2026. Our Defense-adjusted Value Over Average (DVOA) system breaks down every single play and compares a team’s performance to the league average based on situation in order to determine value over average. (Explained further here.) There are small opponent adjustments currently based on 2025 stats.
OFFENSE and DEFENSE DVOA are adjusted for performance indoors and consider all fumbles, kept or lost, as equal value. SPECIAL TEAMS DVOA is adjusted for type of stadium (warm, cold, dome, Denver) and week of season. As always, positive numbers represent more points so DEFENSE is better when it is NEGATIVE.
DAVE is a formula which combines our preseason forecast with current DVOA to get a more accurate projection of how a team will play the rest of the season. DAVE is currently 83% preseason forecast for offense and 98% preseason forecast for defense and special teams.
RK
TEAM
TOTAL
DVOA
TOTAL
DAVE
RK
W-L
OFF.
DVOA
OFF.
RK
DEF.
DVOA
DEF.
RK
S.T.
DVOA
S.T.
RK
1
SF
70.3%
10.9%
5
1-0
28.6%
5
-32.7%
4
9.0%
6
2
JAX
67.7%
8.8%
10
1-0
38.9%
3
-36.5%
3
-7.7%
25
3
BAL
64.9%
9.1%
9
1-0
35.5%
4
-25.5%
7
3.9%
14
4
BUF
50.4%
18.9%
2
1-0
48.5%
2
8.6%
22
10.5%
3
5
KC
47.6%
7.9%
11
1-0
3.1%
15
-47.3%
2
-2.9%
21
6
NYJ
40.2%
-8.8%
25
1-0
11.0%
11
-23.3%
9
5.9%
11
7
CHI
38.7%
9.4%
7
1-0
55.0%
1
20.6%
25
4.2%
13
8
PIT
36.4%
-4.2%
22
1-0
-11.0%
19
-58.5%
1
-11.1%
28
9
SEA
29.2%
19.3%
1
1-0
-11.4%
20
-30.7%
5
9.9%
4
10
LV
26.7%
-11.7%
27
1-0
-6.4%
17
-26.5%
6
6.5%
9
11
NYG
26.6%
-3.7%
21
1-0
17.6%
7
-5.8%
16
3.2%
15
12
CIN
26.2%
4.1%
13
1-0
11.8%
10
-14.3%
10
0.1%
17
13
ARI
18.8%
-2.3%
19
1-0
24.5%
6
5.4%
20
-0.3%
18
14
DET
17.0%
9.6%
6
1-0
10.2%
12
-6.2%
15
0.6%
16
15
MIN
14.0%
-4.4%
23
1-0
-17.7%
24
-25.3%
8
6.5%
10
16
PHI
9.9%
9.3%
8
1-0
6.8%
14
-8.2%
13
-5.0%
22
RK
TEAM
TOTAL
DVOA
TOTAL
DAVE
RK
W-L
OFF.
DVOA
OFF.
RK
DEF.
DVOA
DEF.
RK
S.T.
DVOA
S.T.
RK
17
NE
-9.2%
3.3%
14
0-1
-16.0%
23
0.8%
17
7.5%
8
18
TB
-11.6%
0.7%
18
0-1
-13.8%
22
8.8%
23
11.0%
2
19
DAL
-15.7%
4.6%
12
0-1
16.1%
8
30.0%
26
-1.8%
19
20
WAS
-16.7%
-5.2%
24
0-1
-13.0%
21
1.9%
18
-1.8%
20
21
GB
-19.0%
-2.6%
20
0-1
-20.8%
26
-8.7%
12
-7.0%
24
22
HOU
-20.2%
13.5%
4
0-1
9.1%
13
37.4%
30
8.1%
7
23
NO
-26.1%
-17.3%
28
0-1
-10.9%
18
7.5%
21
-7.8%
26
24
DEN
-30.0%
0.9%
17
0-1
-46.3%
30
-7.1%
14
9.1%
5
25
CAR
-38.2%
-9.0%
26
0-1
14.1%
9
45.7%
32
-6.7%
23
26
MIA
-44.6%
-17.9%
29
0-1
-31.3%
28
4.6%
19
-8.7%
27
27
LAC
-46.7%
1.6%
15
0-1
-1.9%
16
31.1%
27
-13.6%
30
28
ATL
-48.1%
-21.3%
31
0-1
-46.7%
31
-11.4%
11
-12.9%
29
29
LAR
-49.7%
16.0%
3
0-1
-23.8%
27
12.3%
24
-13.6%
31
30
IND
-54.7%
1.5%
16
0-1
-19.7%
25
40.6%
31
5.6%
12
31
CLE
-75.6%
-31.4%
32
0-1
-54.5%
32
34.6%
29
13.4%
1
32
TEN
-88.3%
-21.3%
30
0-1
-37.9%
29
34.6%
28
-15.8%
32