
Summary
San Francisco 49ers lead DVOA standings after close win against Cardinals: The 49ers stay atop DVOA with 68.7% season mark and 64.7% for the win over Arizona.
Jaguars surge in DVOA after big win; Patriots drop to last in offense: Jacksonville climbs nine spots; New England falls to 25th in offense despite good defense.
Texans show subtle improvement; Rams buoyed by loss, remain highest-ruled losing team: DVOA suggests Houston’s offense remains stable while its defense worsens; L.A. moves up despite the loss.
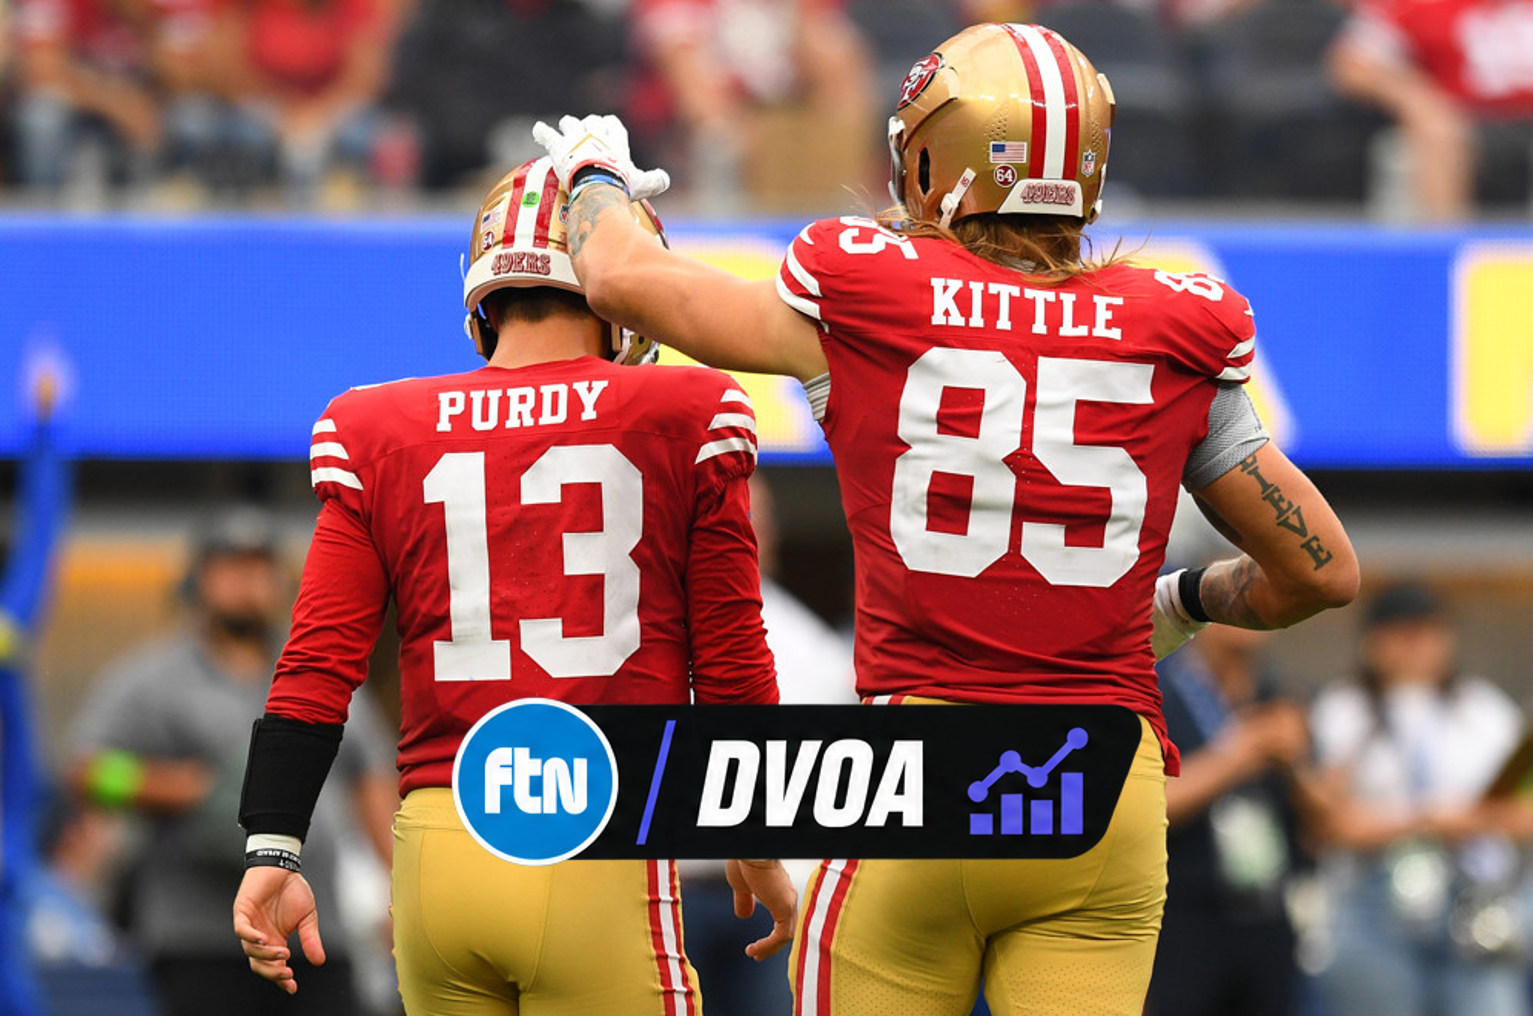
The San Francisco 49ers continue to dominate our DVOA ratings, even after a close win over the Arizona Cardinals this week. Although the final score was a surprisingly close 36-30, the 49ers were the far more efficient team, with 8.7 yards per play compared to 4.5 for the Cardinals. As a result, the 49ers get 64.7% DVOA for the win. Their DVOA for the season is now at 68.7%, which is far ahead of the No. 2 team Jacksonville. The Jaguars move up nine spots with their huge win over the Patriots. Buffalo is third, Kansas City fourth, and Baltimore fifth.
With their three impressive early-season wins, the 49ers now rank as the ninth-best team in DVOA ever through three games.
BEST TOTAL DVOA THROUGH 3 GAMES, 1977-2026
YEAR
TEAM
W-L
DVOA
2019
NE
3-0
90.2%
1996
GB
3-0
86.6%
2007
NE
3-0
82.1%
1991
WAS
3-0
78.9%
2007
PIT
3-0
73.7%
1980
PHI
3-0
70.6%
2019
DAL
3-0
69.7%
2015
ARI
3-0
69.5%
2026
SF
3-0
68.7%
2013
DEN
3-0
68.6%
2005
CIN
3-0
68.3%
2003
KC
3-0
68.2%
The 49ers have also moved into the top spot in DAVE, which incorporates preseason projections, and in our Super Bowl odds. The 49ers are one of only six teams to put up a pass offense DVOA over 100% in the first three games of the season. Only the 1984 and 2023 Dolphins had a higher pass offense DVOA than this year’s 49ers through three games.
BEST PASS OFFENSE DVOA THROUGH 3 GAMES, 1977-2026
YEAR
TEAM
W-L
DVOA
1984
MIA
3-0
105.7%
2023
MIA
3-0
103.5%
2026
SF
3-0
102.8%
2005
PIT
2-1
102.5%
1998
DEN
3-0
102.1%
2018
KC
3-0
101.7%
1978
PIT
3-0
99.4%
2024
BUF
3-0
98.3%
1999
WAS
2-1
96.3%
2005
PIT
2-1
93.5%
2007
NE
3-0
90.2%
2019
DAL
3-0
87.4%
That 35-6 Jacksonville win over New England showed how far the Patriots have fallen this season. The Patriots drop from 13th to 25th this week, and they are now the bottom team in offense. If there’s any silver lining, it’s that their defense is good (eighth) and that their offense is nowhere near as bad as the last-place offense usually is at this point. I went back to look to see if this is the biggest fall we’ve ever seen from an offense, and not quite. I limited my search to teams where the same quarterback from the previous year started all three games, and the worst fall belongs to the 1984 Los Angeles Rams with Vince Ferragamo at quarterback. The Rams benched Ferragamo for Jeff Kemp after Week 3 of that season.
Biggest Offensive Fall as of Week 3, Same QB
YEAR
TEAM
W-L
Y-1
RK
WK3
RK
DIF
QB
1984
LARM
1-2
9.1%
6
-42.3%
28
-51.5%
V.Ferragamo
2008
CLE
0-3
9.2%
8
-37.8%
30
-47.0%
D.Anderson
2005
NYJ
1-2
18.6%
5
-28.1%
28
-46.7%
C.Pennington
2026
NE
1-2
16.2%
3
-29.9%
32
-46.1%
D.Maye
2009
CAR
0-3
9.9%
9
-34.5%
31
-44.5%
J.Delhomme
2005
MIN
1-2
18.7%
4
-25.6%
27
-44.4%
D.Culpepper
2011
KC
0-3
1.1%
16
-41.2%
32
-42.4%
M.Cassel
2000
GB
1-2
8.2%
11
-34.2%
29
-42.3%
B.Favre
2007
NO
0-3
8.4%
9
-33.8%
30
-42.2%
D.Brees
2015
DEN
3-0
18.7%
3
-22.3%
31
-41.1%
P.Manning
The good news for Patriots fans is that some of these quarterbacks did get their groove back. Brett Favre, certainly, and Drew Brees with the Saints. Brees was in a similar situation, since he was an MVP candidate when the Saints broke out in 2006 and then they started 0-4 in 2007. They finished 7-9 that year but obviously the franchise built things to win a Super Bowl two years later.
Another team that’s really struggling is the Houston Texans but DVOA suggests they are not struggling as much as you think. The Texans had 66% Post-Game Win Expectancy in their loss to the Colts this week and still rank 17th in DVOA. What’s really remarkable is that the Texans offense, which looks awful to the naked eye, has about the same DVOA that it had last season! It’s their defense that has gotten worse. The Texans at 0-3 are ahead of four different teams with winning records: Pittsburgh, the New York Giants, Philadelphia, and Cleveland.
The Rams are also doing better than you think. They had 85% PGWE for their loss to Denver on Sunday night and they actually move up from 14th to 10th in DVOA this week. They are the highest-ranked team with a losing record while Denver is just 16th right now at 2-1.
* * * * *
These are the FTN DVOA and DAVE ratings through three weeks of 2026. Our Defense-adjusted Value Over Average (DVOA) system breaks down every single play and compares a team’s performance to the league average based on situation in order to determine value over average. (Explained further here.) There are small opponent adjustments currently based on 2025 stats. Regular adjustments based on 2026 performance begin after Week 4.
OFFENSE and DEFENSE DVOA are adjusted for performance indoors and consider all fumbles, kept or lost, as equal value. SPECIAL TEAMS DVOA is adjusted for type of stadium (warm, cold, dome, Denver) and week of season. As always, positive numbers represent more points so DEFENSE is better when it is NEGATIVE.
DAVE is a formula which combines our preseason forecast with current DVOA to get a more accurate projection of how a team will play the rest of the season. DAVE is currently 65% preseason forecast for offense and 90% preseason forecast for defense and special teams.
RK
TEAM
TOTAL
DVOA
LAST
WEEK
TOTAL
DAVE
RK
W-L
OFF.
DVOA
OFF.
RK
DEF.
DVOA
DEF.
RK
S.T.
DVOA
S.T.
RK
1
SF
68.7%
1
24.7%
1
3-0
56.0%
1
-15.1%
5
-2.5%
21
2
JAX
43.1%
11
10.6%
7
2-1
19.5%
6
-24.9%
2
-1.3%
19
3
BUF
37.7%
2
21.6%
2
3-0
37.5%
2
3.5%
22
3.8%
9
4
KC
35.2%
4
14.6%
5
3-0
22.9%
4
-13.8%
6
-1.5%
20
5
BAL
26.8%
3
11.5%
6
2-1
28.1%
3
-1.4%
15
-2.7%
22
6
SEA
19.6%
5
19.3%
4
2-1
-2.3%
15
-20.9%
3
1.0%
15
7
CIN
18.8%
6
5.3%
11
2-1
10.2%
10
-4.5%
11
4.0%
7
8
MIN
17.3%
9
-1.6%
16
3-0
-25.8%
30
-30.3%
1
12.8%
1
9
LV
16.0%
10
-7.5%
23
3-0
0.2%
13
-10.3%
9
5.6%
5
10
LAR
13.9%
14
21.5%
3
1-2
11.4%
9
-15.6%
4
-13.0%
32
11
CHI
13.0%
18
3.5%
14
2-1
13.5%
8
-0.2%
17
-0.7%
18
12
DAL
9.4%
7
8.3%
10
1-2
22.6%
5
16.9%
27
3.7%
10
13
CAR
4.7%
12
-8.6%
25
1-2
-1.1%
14
0.5%
18
6.3%
4
14
DET
1.0%
21
10.6%
8
2-1
15.5%
7
17.2%
28
2.7%
13
15
NYJ
-1.1%
8
-7.7%
24
1-2
2.8%
12
-3.4%
13
-7.4%
28
16
DEN
-1.4%
15
5.2%
12
2-1
-6.8%
18
-3.6%
12
1.8%
14
RK
TEAM
TOTAL
DVOA
LAST
WEEK
TOTAL
DAVE
RK
W-L
OFF.
DVOA
OFF.
RK
DEF.
DVOA
DEF.
RK
S.T.
DVOA
S.T.
RK
17
HOU
-2.6%
25
10.3%
9
0-3
-2.7%
16
-3.2%
14
-3.1%
24
18
PIT
-3.3%
19
-6.0%
21
2-1
-13.5%
23
-13.8%
7
-3.5%
25
19
ARI
-9.9%
17
-5.0%
19
1-2
7.1%
11
21.9%
31
4.9%
6
20
NYG
-9.9%
23
-13.6%
27
2-1
-16.0%
25
3.4%
21
9.4%
2
21
TB
-10.2%
20
-2.8%
17
0-3
-14.0%
24
-0.8%
16
3.1%
12
22
PHI
-10.2%
16
4.3%
13
2-1
-6.4%
17
3.3%
20
-0.5%
17
23
ATL
-16.5%
31
-17.9%
30
1-2
-19.5%
27
-9.3%
10
-6.2%
27
24
IND
-19.4%
26
0.0%
15
1-2
-9.6%
21
19.2%
30
9.4%
3
25
NE
-21.0%
13
-4.7%
18
1-2
-29.9%
32
-11.6%
8
-2.7%
23
26
WAS
-21.2%
28
-6.2%
22
1-2
-8.3%
20
8.3%
23
-4.7%
26
27
CLE
-22.1%
27
-25.4%
32
2-1
-24.0%
29
2.0%
19
4.0%
8
28
NO
-25.1%
24
-16.9%
29
1-2
-6.9%
19
18.5%
29
0.3%
16
29
TEN
-31.0%
29
-16.9%
28
0-3
-11.7%
22
8.3%
24
-11.0%
31
30
GB
-31.9%
22
-8.9%
26
1-2
-22.7%
28
12.8%
26
3.6%
11
31
LAC
-34.9%
30
-5.7%
20
0-3
-16.8%
26
10.5%
25
-7.6%
29
32
MIA
-59.4%
32
-23.2%
31
0-3
-26.3%
31
24.8%
32
-8.2%
30