
September 29, 2026 12:58 PM, EDT
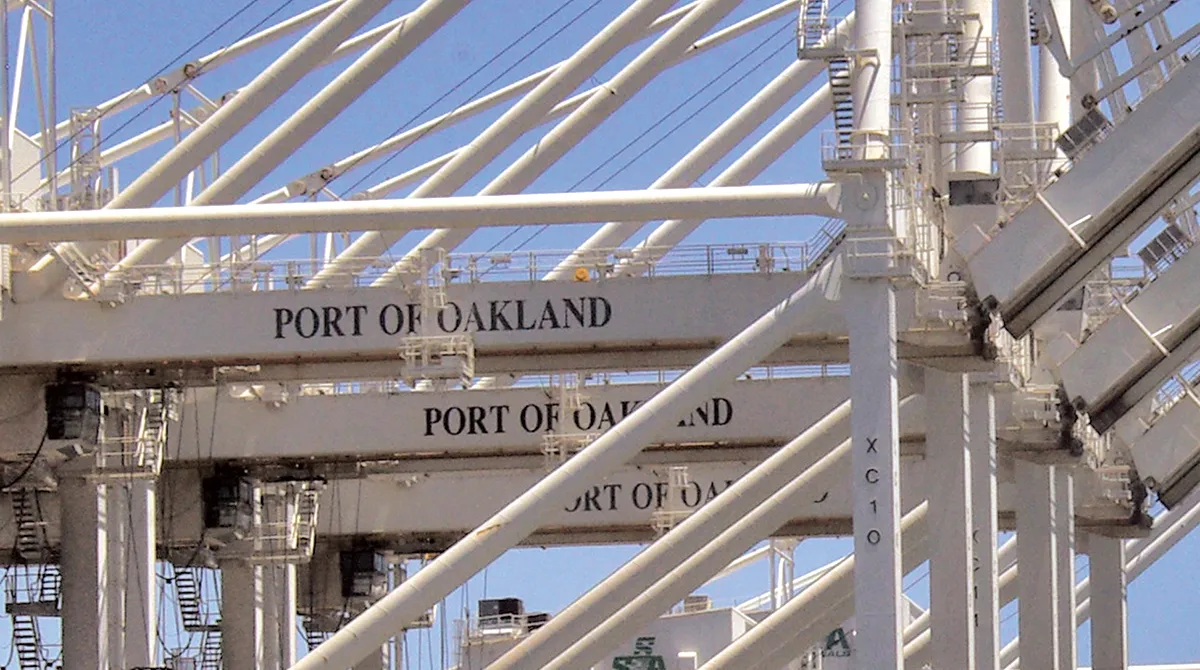
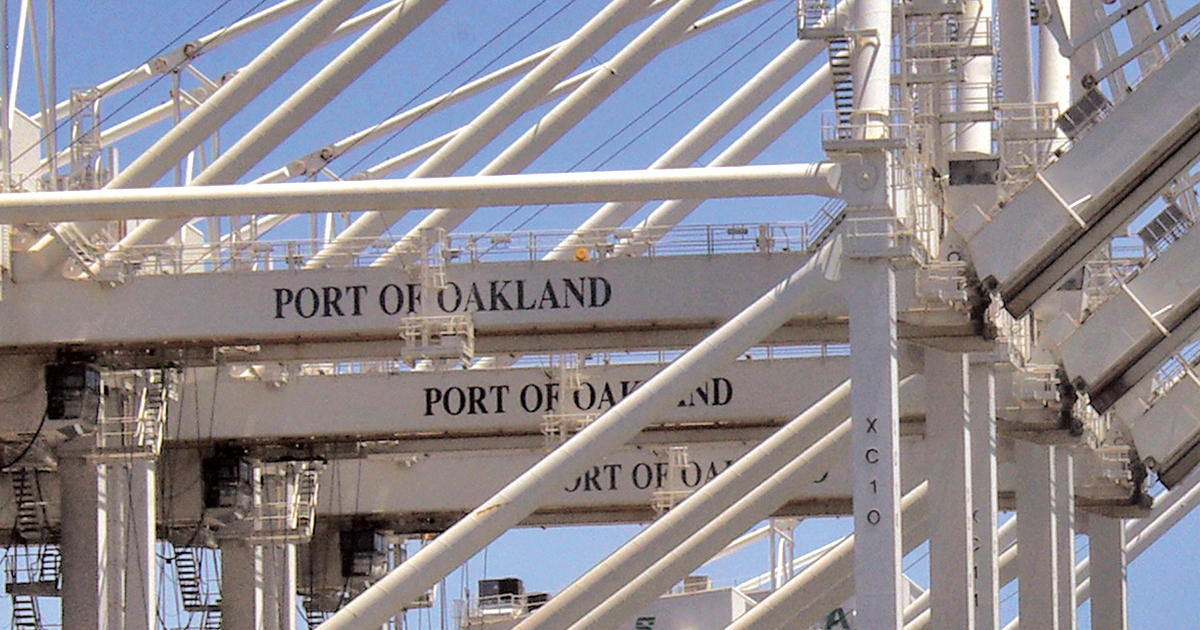
Port of Oakland container volume declined 9.6% to 173,818 TEUs from 192,313. (Port of Oakland via flickr)
Key Takeaways:
Trucking firms serving major U.S. ports struggled to convert strong August import volumes into higher dry van demand despite near-record container activity.Container imports rose 3.3% to 2.6 million TEUs, but weak consumer confidence and carrier exits limited truckload pricing power, analysts said.Port congestion persists as rising dwell times, equipment shortages and difficult empty-container returns continue to strain intermodal carriers, industry officials said.
Trucking companies serving major U.S. ports struggled to fully capitalize on a surge in import volumes during August, data shows.
“Retailers appear to be front-loading holiday inventory given tariff and shipping uncertainty, which shows up at the ports but not yet on the highway,” said James Roe, director of shipping, logistics and infrastructure at AlixPartners. “Combine that with consumer confidence at its weakest point in eight months, and you get a dry van [trailer] market where pricing power is coming almost entirely from carriers leaving the industry.”
Roe noted that container imports hit 2.6 million 20-foot-equivalent units in August, the third-highest month on record, while both the Port of Los Angeles container and Port of Long Beach saw busy August volume. “Normally you would expect that kind of import strength to translate fairly quickly into dry van truckload demand, and it has not,” he said. “The gap between container imports and truckload demand is the real story for dry van.”
Container volumes at the Port of Los Angeles slipped 0.3% to 955,907 TEUs from 958,355 a year earlier, but the facility notched its busiest three-month stretch on record with 2.9 million units. The Port of Long Beach reported a 2% increase to 919,992 TEUs from 901,846 a year ago, marking its fifth-strongest month ever.
Descartes Systems Group reported in its monthly global shipping report that container imports increased 3.3% from a year earlier to 2,603,709 TEUs. Volumes also rose 3.8% from July. The report noted that ongoing conflict in the Red Sea continues to pressure shipping routes and costs.
Delays at the ports
The Pacific Merchant Shipping Association reported truck dwell time held relatively steady at 2.95 days in August, roughly in line with the past year. Rail dwell climbed to 6.75 days, among the highest levels of the past year. The data covers the San Pedro Bay port complex, including Los Angeles and Long Beach. The association described the results as mixed, with strong cargo volumes reflecting sustained demand even as intermodal dwell times continue to rise.
“As import dwell goes up and rail dwell goes up, then the turn times go up and the ports get congested,” Harbor Trucking Association CEO Robert Loya said. “Then we’re having problems returning empties because there’s no room.”
The Harbor Trucking Association represents intermodal carriers operating in Los Angeles, Long Beach, Oakland, Seattle and Tacoma. Longer turn times mean carriers are spending more time inside port facilities before leaving with containers. Loya said tighter yard space also increases the number of lengthy transactions.
“We’re struggling big time over the last few months as volume continues to be at a good pace,” Loya said. “But we’re suffering because we can’t return equipment.”

Arpan Podduturi of Samsara examines how AI, telematics and onboard cameras are converging to protect drivers and reduce risk. Tune in above or by going to RoadSigns.ttnews.com.
Loya said the congestion has worsened long-standing challenges with the container return process. Return windows for empty containers can be extremely tight, making it difficult for truckers to get equipment back to terminals amid heavy traffic. He added that import volumes also have been bolstered by a backlog tied to flooding in China.
“What started it for us on the land side was our inability to return empties, which led to no chassis, which led to imports sitting on the dock, because we’re not picking them up, because we have no wheels to pick them up,” Loya said. “Chassis providers are also short.”
Loya noted that the industry experienced similar, though more severe, congestion during the coronavirus pandemic, when global supply chain disruptions caused cargo and equipment to pile up at ports. This time, carriers also are contending with elevated diesel prices.
Other ports
The Northwest Seaport Alliance’s container volume fell 8.2% to 235,795 TEUs from 256,735.
Port Houston’s container volume increased 0.9% to 373,756 TEUs from 370,430.
Port of Oakland container volume declined 9.6% to 173,818 TEUs from 192,313.
“Data from Project44’s platform indicates a decline in volumes at key ports on the East and West Coast, showing a 10% reduction in daily truckload shipments month over month near the Port of New York and New Jersey and a 30% reduction in daily truckload shipments month over month around the port of Tacoma,” said Eric Fullerton, vice president of data insights at Project44.
The South Carolina Ports Authority and the Port Authority of New York and New Jersey had not released August volume data by press time.